5242
Quantitative and qualitative analysis of left ventricular remodeling after myocardial infarction: 4D flow MRI in a swine model1Department of advanced technology, K-mediHub, Daegu, Korea, Republic of, 2Kangwon National University, Chuncheon, Korea, Republic of, 3Asan Medical Center, Seoul, Korea, Republic of
Synopsis
Keywords: Flow, Heart
Left ventricular remodeling and functional changes may affect the intra-cardiac hemodynamics, however, has not yet been systematically studied. This study provides comprehensive understanding on chronic hemodynamics changes after myocardial infarction (AMI) in a swine model by using sequential cardiac magnetic resonance imaging (MRI) and 4D flow MRI. The orientations of infilling blood flow and vortex cores were shifted due to the infarcted tissue, decreasing the local rotation of the intracardiac flow as MI progresses. It’s trends also correlated well with the decreased radial strain and global function. These findings may provide new hemodynamic based diagnosis markers for MI.Introduction
A myocardial infarction (MI) is a damage of myocardial tissue due to the limited of oxygen delivery caused by block in coronary artery. Non-invasive imaging technique such as magnetic resonance imaging (MR) can directly visualize and quantify the damaged tissue area. Especially, MR-based late gadolinium enhancement (LGE), T1 and T2 mapping methods have been widely adopted to estimate the tissue properties in infarcted region by measuring ischemic property and water content1,2. Left ventricular remodeling and functional changes may affect the intra-cardiac hemodynamics, however, has not yet been systematically studied. In this study, conventional cardiac MR (CMR) and 4D flow MR was applied to the myocardial infarction swine model to evaluate the chronic changes after acute MI (AMI).Methods
A serial MR imaging was performed at baseline, 0, 3 days, 1, 2, 3, 4, 5, 7 and 11 weeks after MI. Left anterior descending artery was reperfused after 1hr of occlusion using balloon catheter. All MR examinations were scanned using a commercial 3T scanner (Skyra, Siemens AG, Munich, Germany). The CMR protocols included cine imaging, LGE imaging, native T1 and T2 mapping followed by 4D flow acquisition. The region with more than 25% of LGE was defined as infarcted, while the others are defined as adjacent and remote based on the infarcted region. Global function of LV was analyzed using a commercial software (CVI 42, Circle Cardiovascular Imaging, Canada) by clinician with 8 years of CMR experiences.Vortex core, which is a collection of vortical flow rotating together through a common axis, was visualized by Lambda2 method using 3d flow data acquired by 4D flow MRI. Voxel-wise curl of the 3d velocity field was used to compute the vorticity. Following AHA guideline for CMR analysis, bull’s eye map of the spatially (6 segments in basal and mid planes, 4 segment in apex) and temporally (early to peak filling) averaged vorticity magnitude was created3.
Results
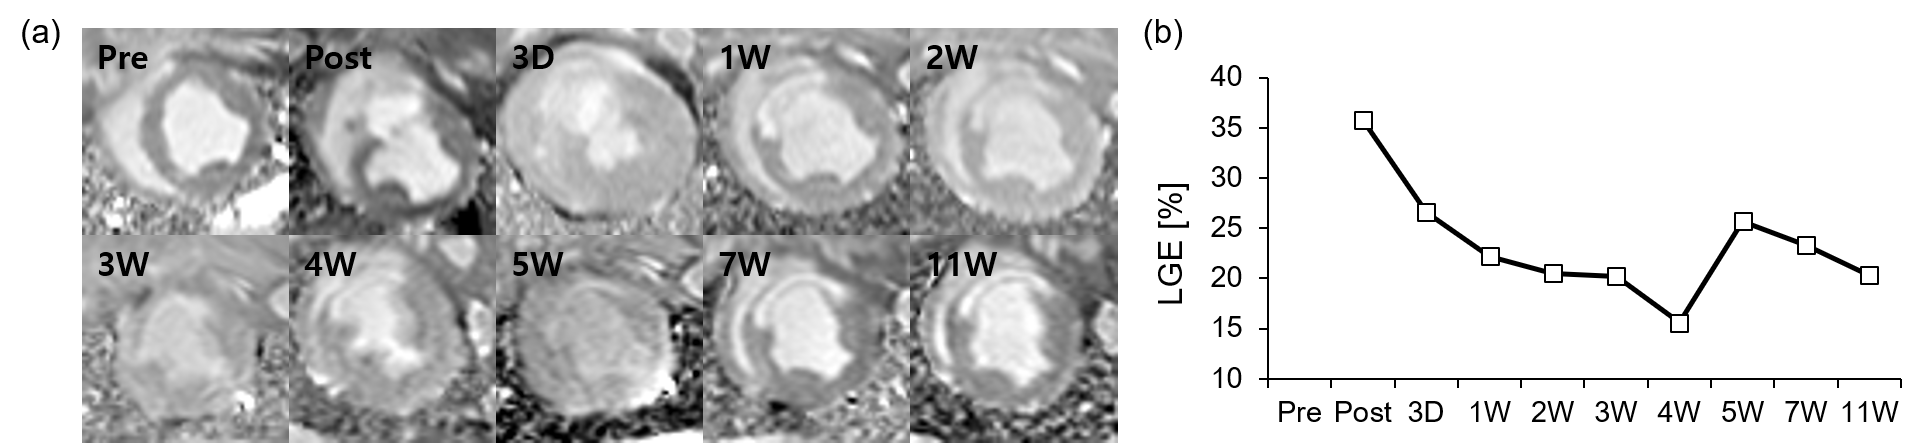
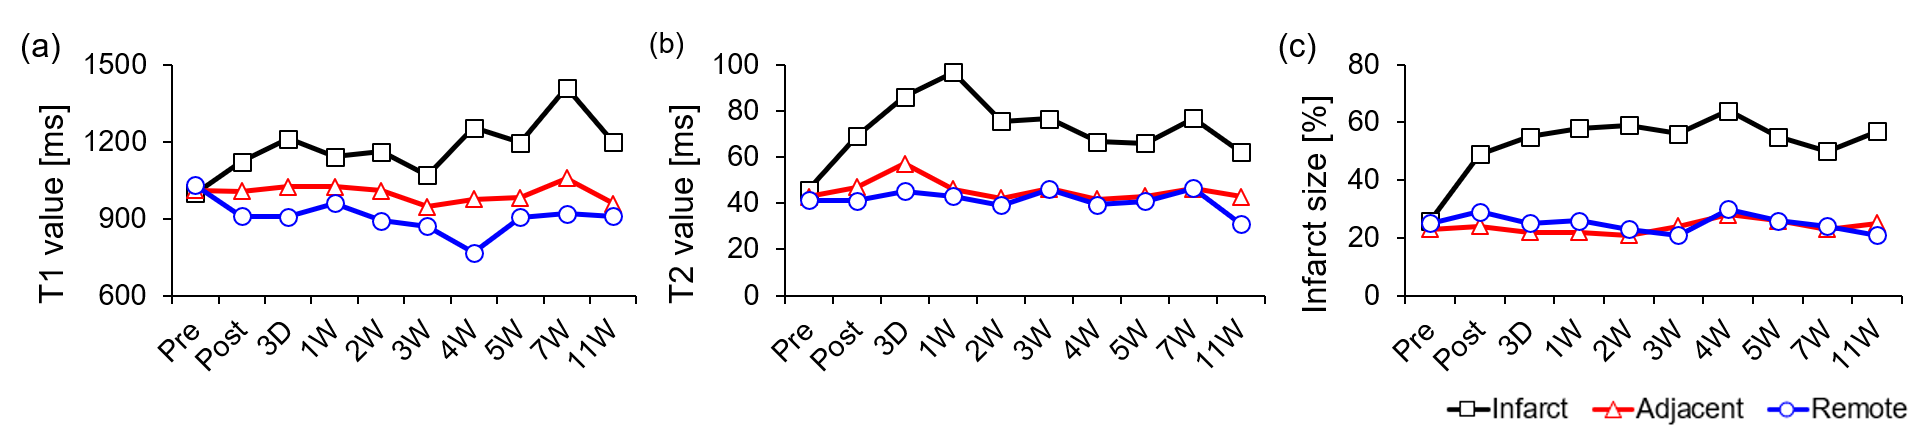
Territorial transmural infraction at mid-ventricular anteroseptal region was visualized by using LGE imaging (Fig. 1a). After the immediate occlusion of mid left anterior descending artery (LAD), predominant infarcted region was detected in LGE image. The corresponding LGE values for each image were shown in Fig. 1b. Initially, immediate post after MI had a significantly high LGE value of 35.8%. LGE values largely decreased during 4 weeks from 35.8% to 15.6%, while the values seem to be variable after these periods.The infarcted size was also quantified by using native T1, T2, and extracellular volume (ECV) mapping (Fig. 2). Native T1 value at infarct region gradually increases after AMI, while T1 value during chronic periods significantly increases (Fig. 2a). On the other hand, AMI induced significant increase in T2 value at infarct region with the peak T2 value at 1W, while gradually decreasing after these periods (Fig. 2b). Infarcted size estimated by ECV mapping was maintained during chronic periods after the significant increase at post case (Fig. 2c).
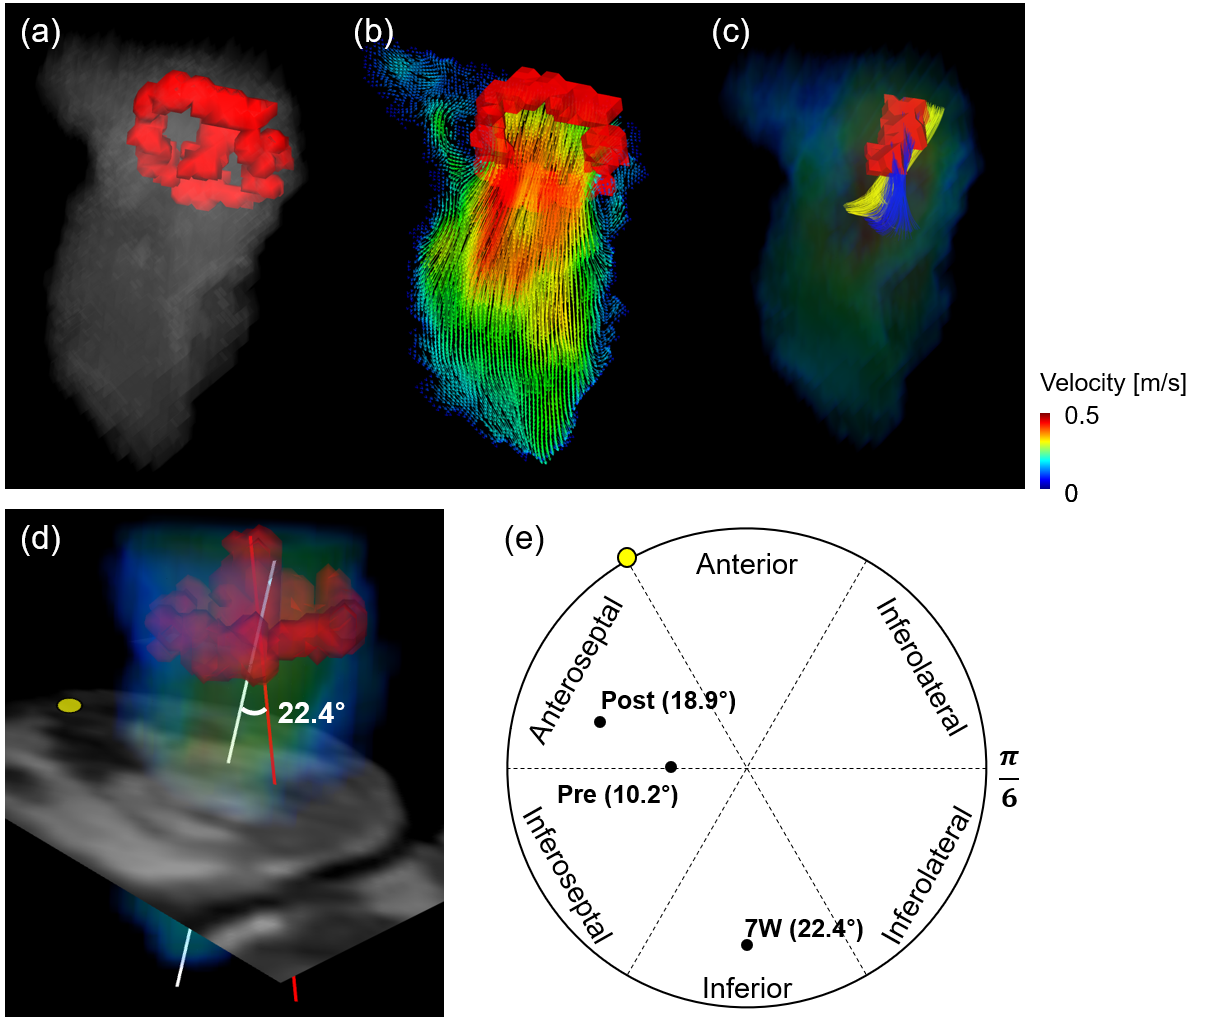
The representative intracardiac blood flow for 7W at peak diastole was qualitatively visualized. Two distinctive vortex cores of horizontal mitral valve (MV) vortex ring and vertical vortex core (VVC) were observed (Fig. 3a). MV vortex ring was formed by the recirculation of blood flow along a longitudinal direction at MV (Fig. 3b), while VVC was generated by the helical flow (Fig. 3c). The formation of helical flow was subsequently evaluated by measuring angle between VVC and anatomical center lines (Fig. 3d). The orientation of VVC was initially directed to intermediate anteroseptal and inferoseptal regions with 10.2° for pre (Fig. 3e). However, the orientation was shifted to anteroseptal region after AMI with tilted angle of 18.9°, it was significantly altered to inferior region with 22.4° for 7W case with chronic heart failure.
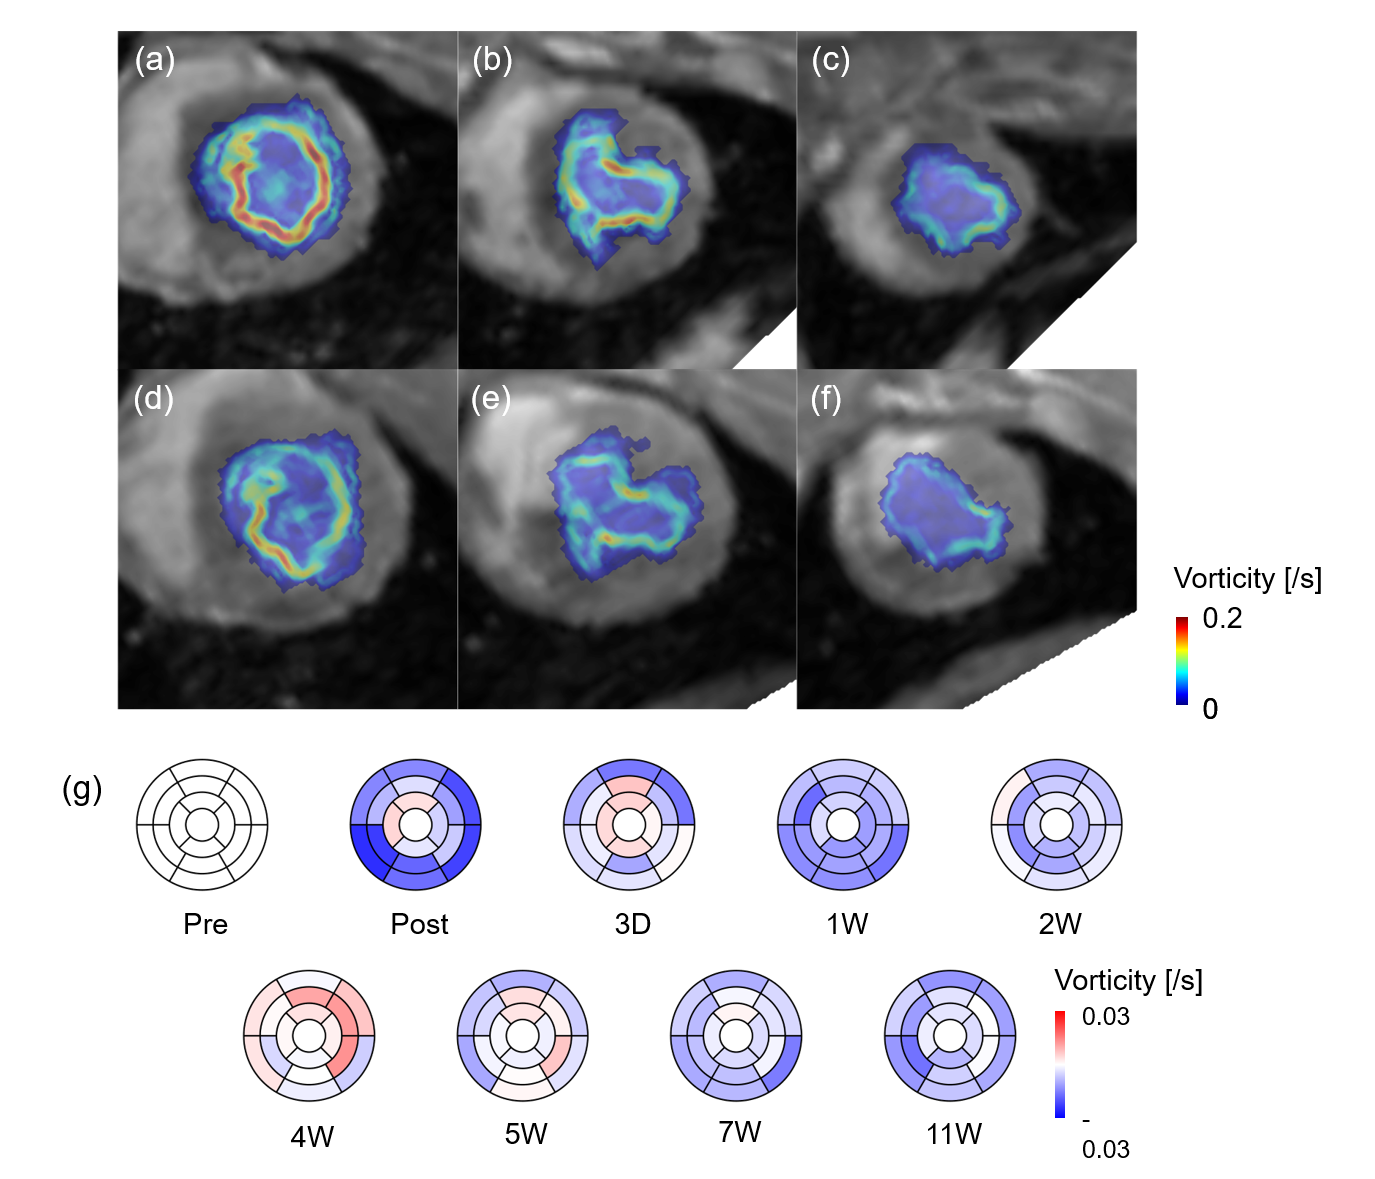
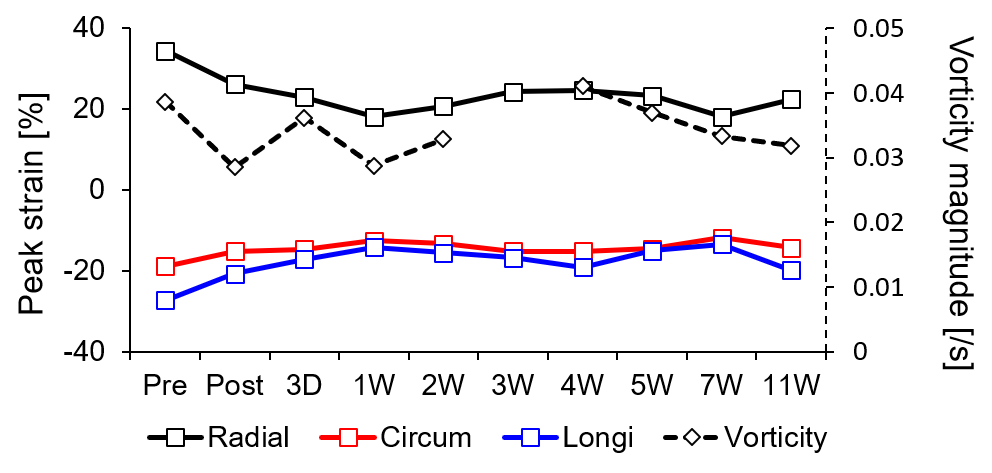
These irregular blood flow decreased overall vorticity magnitude for all planes for 7W compared with pre, while vorticity magnitude at infarct regions significantly decreased (Fig. 4a‒f). Bull’s eye maps clearly showed the decrease in vorticity especially infarct regions (Fig. 4g). However, the magnitude somehow increased at 4W case. Fig. 5 showed the progressive changes in global peak and vorticity magnitude, indicating that the increase in radial strain is strongly correlated with vorticity changes.
Discussion
The formation of vortex ring has been strongly correlated with pathophysiological feature LV thrombus (LVT) formation after AMI4. The presence of LVT in MI patients altered the orientation of vortex ring core especially at diastolic phase. In addition, overall vorticity magnitude decreased compared with control patients. Our results also support the change in the orientation of vortex cores after AMI. Especially, regional changes in the vorticity magnitude give a direct insight into the correlations with characteristics of LV tissue and infilling blood flow. This study would be useful for understanding the progression after MI and providing subclinical markers for accurate diagnosis.Conclusion
Global characteristics of MI was evaluated by conventional MR techniques. In addition, the formation of velocity field and vortex cores was simultaneously compared, suggesting that vortex cores were tilted by disturbed blood flow after MI. In addition, vorticity magnitude was significantly reduced especially at anteroseptal and inferoseptal regions. The clinical value of these parameters will be validated in a future work.Acknowledgements
This research was supported by the Basic Science Research Program through the National Research Foundation of Korea (NRF), funded by the Ministry of Education (NRF-2021R1C1C1003481).References
1. Dall'Armellina E, Piechnik S, Ferreira V, et al. Cardiovascular magnetic resonance by non contrast T1-mapping allows assessment of severity of injury in acute myocardial infarction. J. Cardio. Magnetic Resonance 2012;14(1):1-13.
2. Bohnen S, Radunski U, Lund G, et al. Performance of t1 and t2 mapping cardiovascular magnetic resonance to detect active myocarditis in patients with recent-onset heart failure. Circ. Cardiovasc. Imaging 2015;8(6):e003073.
3. Yang L, Kado Y, Nagata Y, et al. Strain imaging with a bull's-eye map for detecting significant coronary stenosis during dobutamine stress echocardiography. J. Am. Soc. Echocardiogr. 2017;30(2):159-167.
4. Demirkiran A, Hassell M, Garg P, et al. Left ventricular four-dimensional blood flow distribution, energetics, and vorticity in chronic myocardial infarction patients with/without left ventricular thrombus. Eur. J. Radiol. 2022;150:110233.
Figures