5237
Development of an MR-Compatible Motion Phantom to Evaluate Motion-Robust Quantitative MRI1Medical Physics, University of Wisconsin-Madison, Madison, WI, United States, 2Radiology, University of Wisconsin-Madison, Madison, WI, United States, 3Mechanical Engineering, University of Wisconsin-Madison, Madison, WI, United States, 4Biomedical Engineering, University of Wisconsin-Madison, Madison, WI, United States, 5Medicine, University of Wisconsin-Madison, Madison, WI, United States, 6Emergency Medicine, University of Wisconsin-Madison, Madison, WI, United States
Synopsis
Keywords: Phantoms, Motion Correction
Chemical-shift encoded (CSE) MRI can quantify PDFF and R2* as biomarkers for liver fat and iron deposition, respectively, but conventional methods (3D-CSE) are not motion-robust. Recent methods (2D-CSE-FAM) have been proposed which demonstrate motion-robustness; the evaluation of these methods urges the development of a MR-compatible motion phantom. In this work, we constructed such a phantom, validated it via video tracking, and used it to show motion artifacts and quantification biases in 3D-CSE, identify a potential source of bias in axial R2* 2D-CSE-FAM acquisitions, and confirm the motion-robustness of coronal 2D-CSE-FAM.
Introduction
Chemical-shift encoded (CSE) MRI can quantify proton-density fat fraction (PDFF) and R2* as biomarkers for liver fat and iron deposition, respectively. Previous CSE methods require breath holds, and lead to bias and poor precision in quantification when the patient cannot breath-hold. Recent motion-robust CSE methods1 have shown promise for free-breathing liver fat and iron quantification; however, systematic validation as enabled by motion phantoms remains an unmet need. This project addresses this need with an MR-compatible respiratory-motion-mimicking phantom, and performs a preliminary evaluation of conventional and motion-robust CSE methods in the presence of increasing motion.Methods - Phantom Development
To ensure MR compatibility, we constructed a motion phantom using plastic components and a hydraulic connection to a pump outside the scanner room. The motion phantom includes a high-precision syringe pump (Chemyx Inc, Stafford, TX), acrylic phantom platform, syringes, tubing, and 3D printed syringe holders and adapters. The syringe holder and adapters were constructed using a commercially available 3D printer (Ultimaker, Framingham, MA). 3D printed components were designed in SolidWorks (Dassault Systems, Waltham, MA) and fabricated using polylactic acid (PLA) which provided sufficient strength. The syringe at the pump was connected with a smaller syringe in the phantom using ¼-inch tygon tubing that allowed for the transfer of hydraulic force from one syringe to the other. The phantom platform was set on 4 rubberized wheels, to facilitate platform motion during operation. Tube length was approximately 20 feet, which connected the phantom inside the scanner room to the syringe pump outside. A schematic of the system is shown in Figure 1.Methods - Phantom Validation
Two motion profiles were created, “Motion+” and “Motion++”, representing plausible amplitudes of in-vivo liver motion2.The phantom platform’s ability to consistently produce the desired motion was validated using an optical tracking method. A colored sticker was placed on the platform, and a video was taken at 60 frames/second of the sticker using a mirrorless camera (Canon, Huntington, NY). The videos were analyzed in a Python/OpenCV framework by masking for the color of the sticker and tracking the centroid of the relevant pixels. This produced highly spatially- and time-resolved data of the platform’s motion.
Methods - Application to CSE-MRI
The phantom platform was placed inside a 3.0T MRI system (Signa Premier, GE Healthcare) with a commercially available phantom containing vials of 0%, 10%, 20%, 30%, and 40% nominal PDFF (Phantom Pack, Calimetrix, Madison, WI) inside. The phantom was scanned while static and moving according to the above mentioned motion profiles. For each level of motion, three different sequences were acquired: a conventional 3D-CSE axial scan (which typically requires breath-holding), and a recently proposed 2D-CSE with flip-angle modulation (FAM)1, which was obtained in both the axial and coronal orientations to evaluate the effect of through-plane versus in-plane motion. Additionally, coronal time-resolved spoiled-gradient-echo (SGRE) images were acquired to evaluate the phantom motion inside the scanner. Key parameters of each method are provided in Figure 1.The acquired MR data were reconstructed offline (MATLAB, MathWorks, Natick, MA) using previously validated PDFF and R2* mapping methods3,4. A circular region of interest (ROI; r=6.6mm) for calculating averages and standard deviations was drawn5 for axial slices near the center of each vial, and rectangular ROIs were drawn for vials in coronal slices.
Results - Phantom Validation
Results from the optical tracking demonstrate that the phantom’s motion remained constant in frequency, but decreased in amplitude by approximately 2 mm over 20 minutes of operation (see Figure 1). An illustrative comparison of the optical validation data and SGRE imaging is shown in Figure 2. Frequency and amplitude analysis for each motion profile is shown in Figure 3.Results - Application to CSE-MRI
Axial images and coronal reformats for 3D-CSE, and acquisitions in axial and coronal orientations for 2D-CSE-FAM, are shown in Figure 4 for PDFF quantification, and Figure 5 for R2*.For PDFF, we observe 3D-CSE has significant visual artifacts when motion is present compared to 2D-CSE-FAM, but both methods largely agree on quantified PDFF for all levels of motion and both axial and coronal planes.
For R2*, we observe 3D-CSE has substantial motion-induced bias relative to the static case, in both axial images and coronal reformats. 2D-CSE-FAM based R2* measurements have fewer visual artifacts, exhibit increasing bias in the axial plane under motion, and appear unbiased relative to the static case for coronal acquisitions.
Discussion and Future Directions
We demonstrated an MR-compatible, respiratory-mimicking motion platform, and used this platform to evaluate a recently proposed motion-robust PDFF and R2* mapping method1 (2D-CSE-FAM).These results confirm previous in-vivo results, where the short temporal footprint of 2D-CSE-FAM enables it to “freeze” respiratory motion and reduce visual artifacts. With 2D-CSE-FAM, PDFF and R2* measurements were highly robust to both tested levels of motion, except axial R2* slices in Motion++. This may be due to the slice capturing different portions of the vial as it moved, leading to susceptibility-induced R2* overestimation near the end of the vials. This explains FAM coronal slices’ improved quantification, because the major direction of motion is in-plane and measurements are consistently performed near the center of the vial.
We expect this phantom will hold value for evaluating other novel pulse sequences. Additionally, future work may include implementing closed-loop feedback for positioning, to realize highly-controlled, biologically-accurate motion waveforms.
Acknowledgements
In Figure 1, artwork for the MRI scanner and syringes were modified from public domain sources at https://publicdomainvectors.org/en/free-clipart/MRI-scanner/88980.html and https://publicdomainvectors.org/en/free-clipart/Syringe-icon-vector-illustration/26703.html respectively.
The authors acknowledge support from NIH grants R01 EB030497 and R01 EB031886.
The authors also acknowledge Jean Brittain, who provided technical advice regarding the Calimetrix Phantom Pack. Dr. Reeder and Dr. Hernando are co-founders of Calimetrix, LLC.
GE HealthCare provides research support to the University of Wisconsin.
Dr. Reeder is the Fred Lee Sr. Endowed Chair of Radiology.
References
- Zhao R, Zhang Y, Wang X, et al. Motion-robust, high-SNR liver fat quantification using a 2D sequential acquisition with a variable flip angle approach. Magn Reson Med. 2020;84(4):2004-2017. doi:10.1002/mrm.28263
- Langen KM, Jones DTL. Organ motion and its management. Int J Radiat Oncol. 2001;50(1):265-278. doi:10.1016/S0360-3016(01)01453-5
- Hernando D, Sharma SD, Aliyari Ghasabeh M, et al. Multisite, multivendor validation of the accuracy and reproducibility of proton-density fat-fraction quantification at 1.5T and 3T using a fat-water phantom. Magn Reson Med. 2017;77(4):1516-1524. doi:10.1002/mrm.26228
- Hu HH, Börnert P, Hernando D, et al. ISMRM workshop on fat–water separation: Insights, applications and progress in MRI. Magn Reson Med. 2012;68(2):378-388. doi:10.1002/mrm.24369
- Shoelson B. createCirclesMask.m. Published online December 31, 2014. Accessed November 7, 2022. https://www.mathworks.com/matlabcentral/fileexchange/47905-createcirclesmask-m
Figures
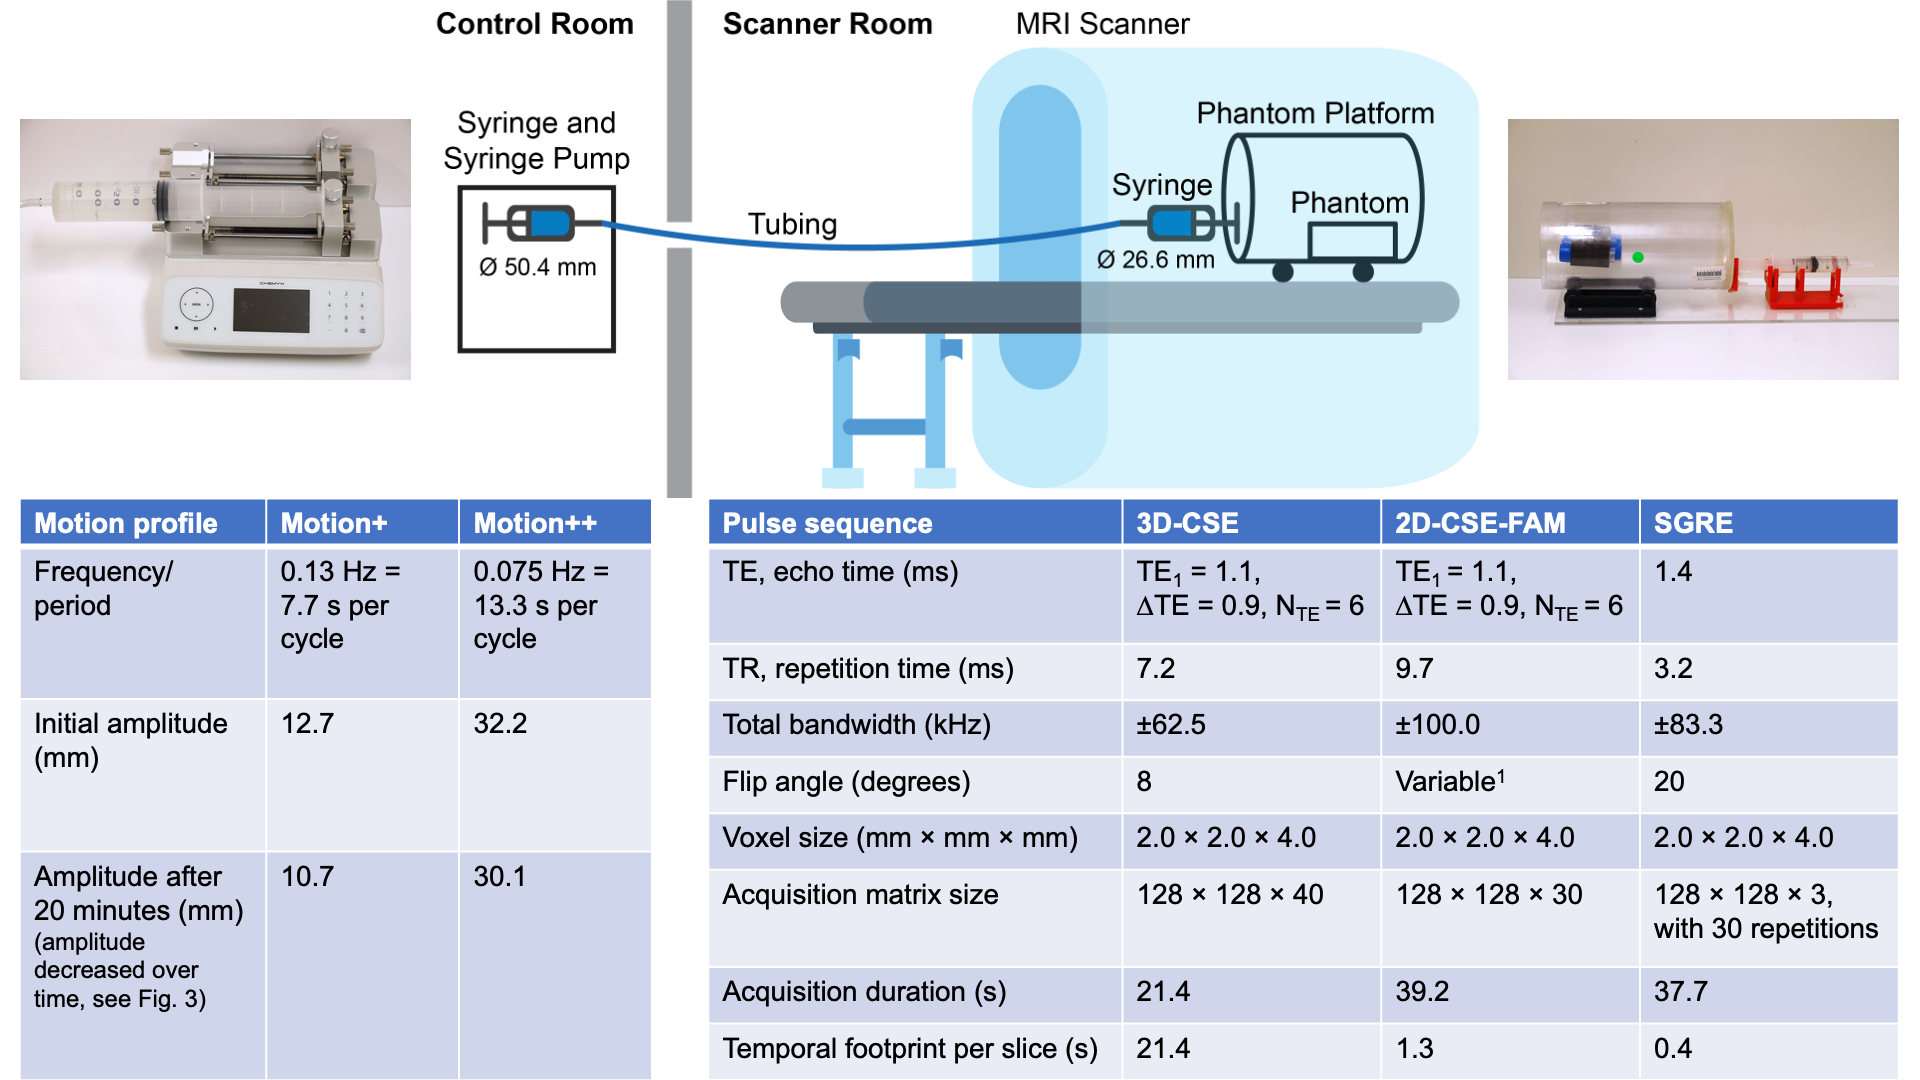
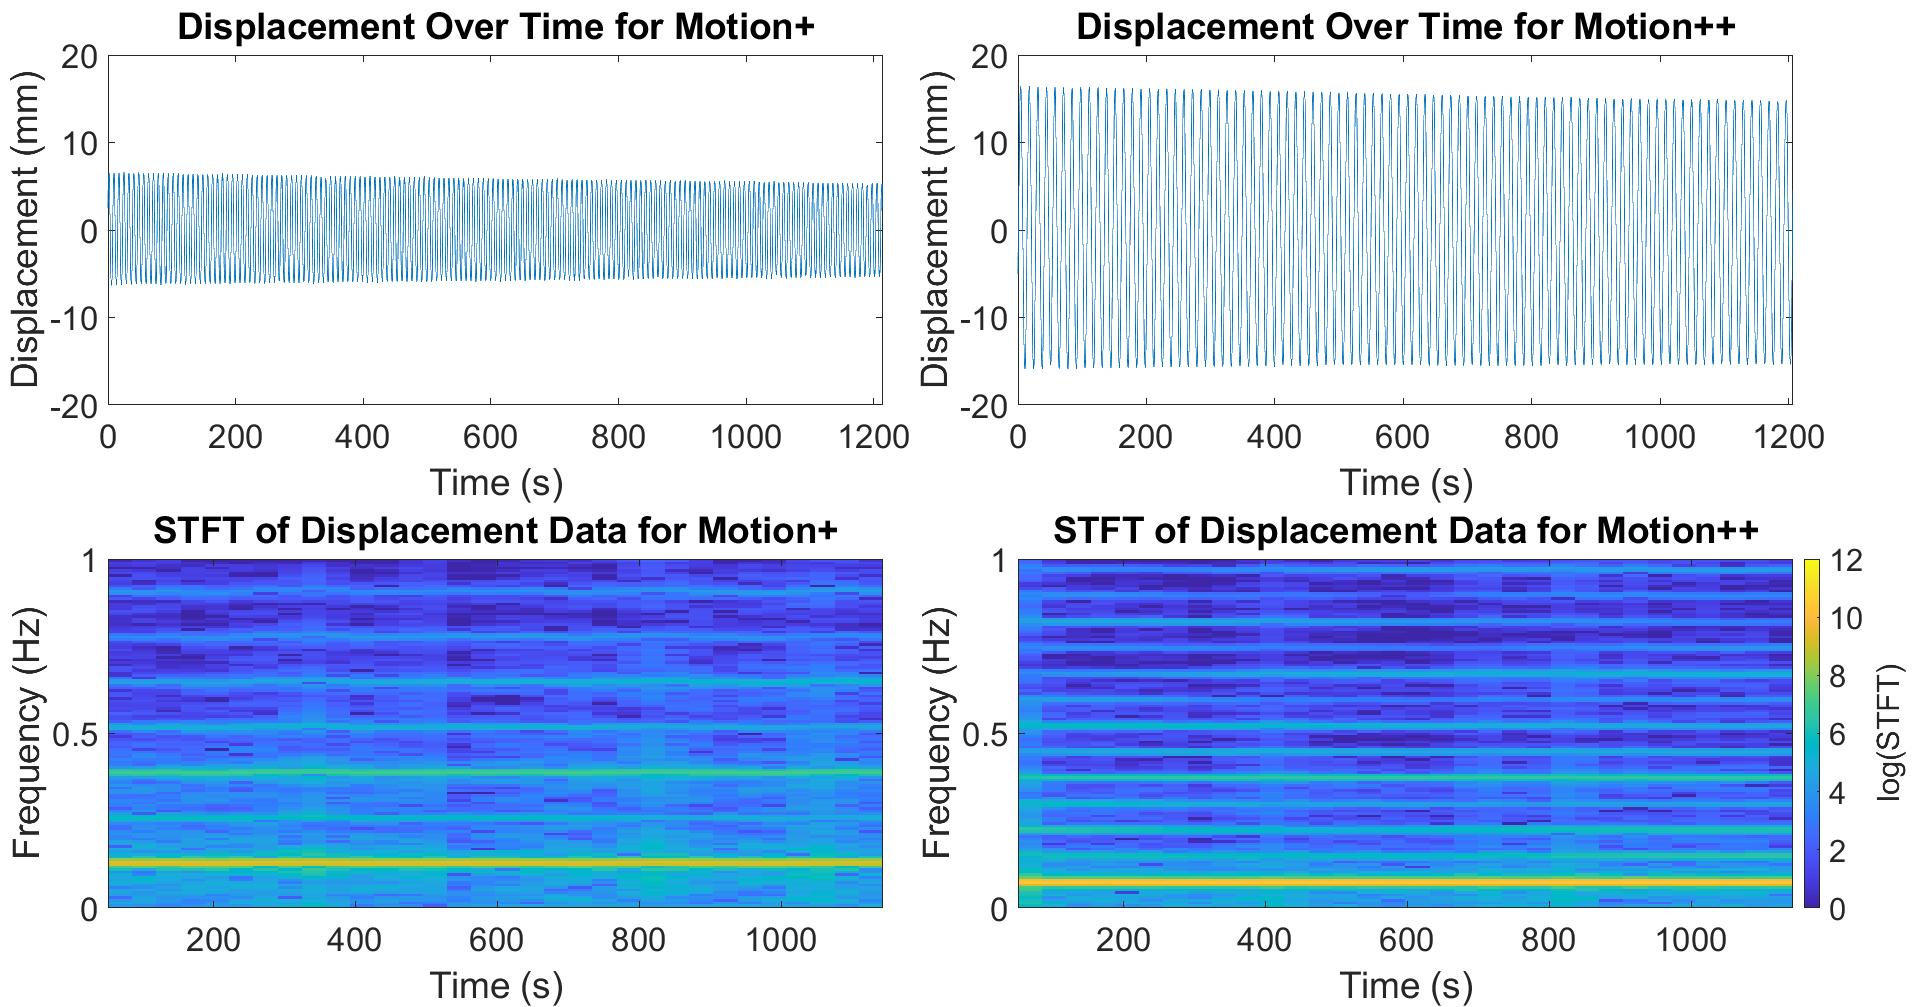
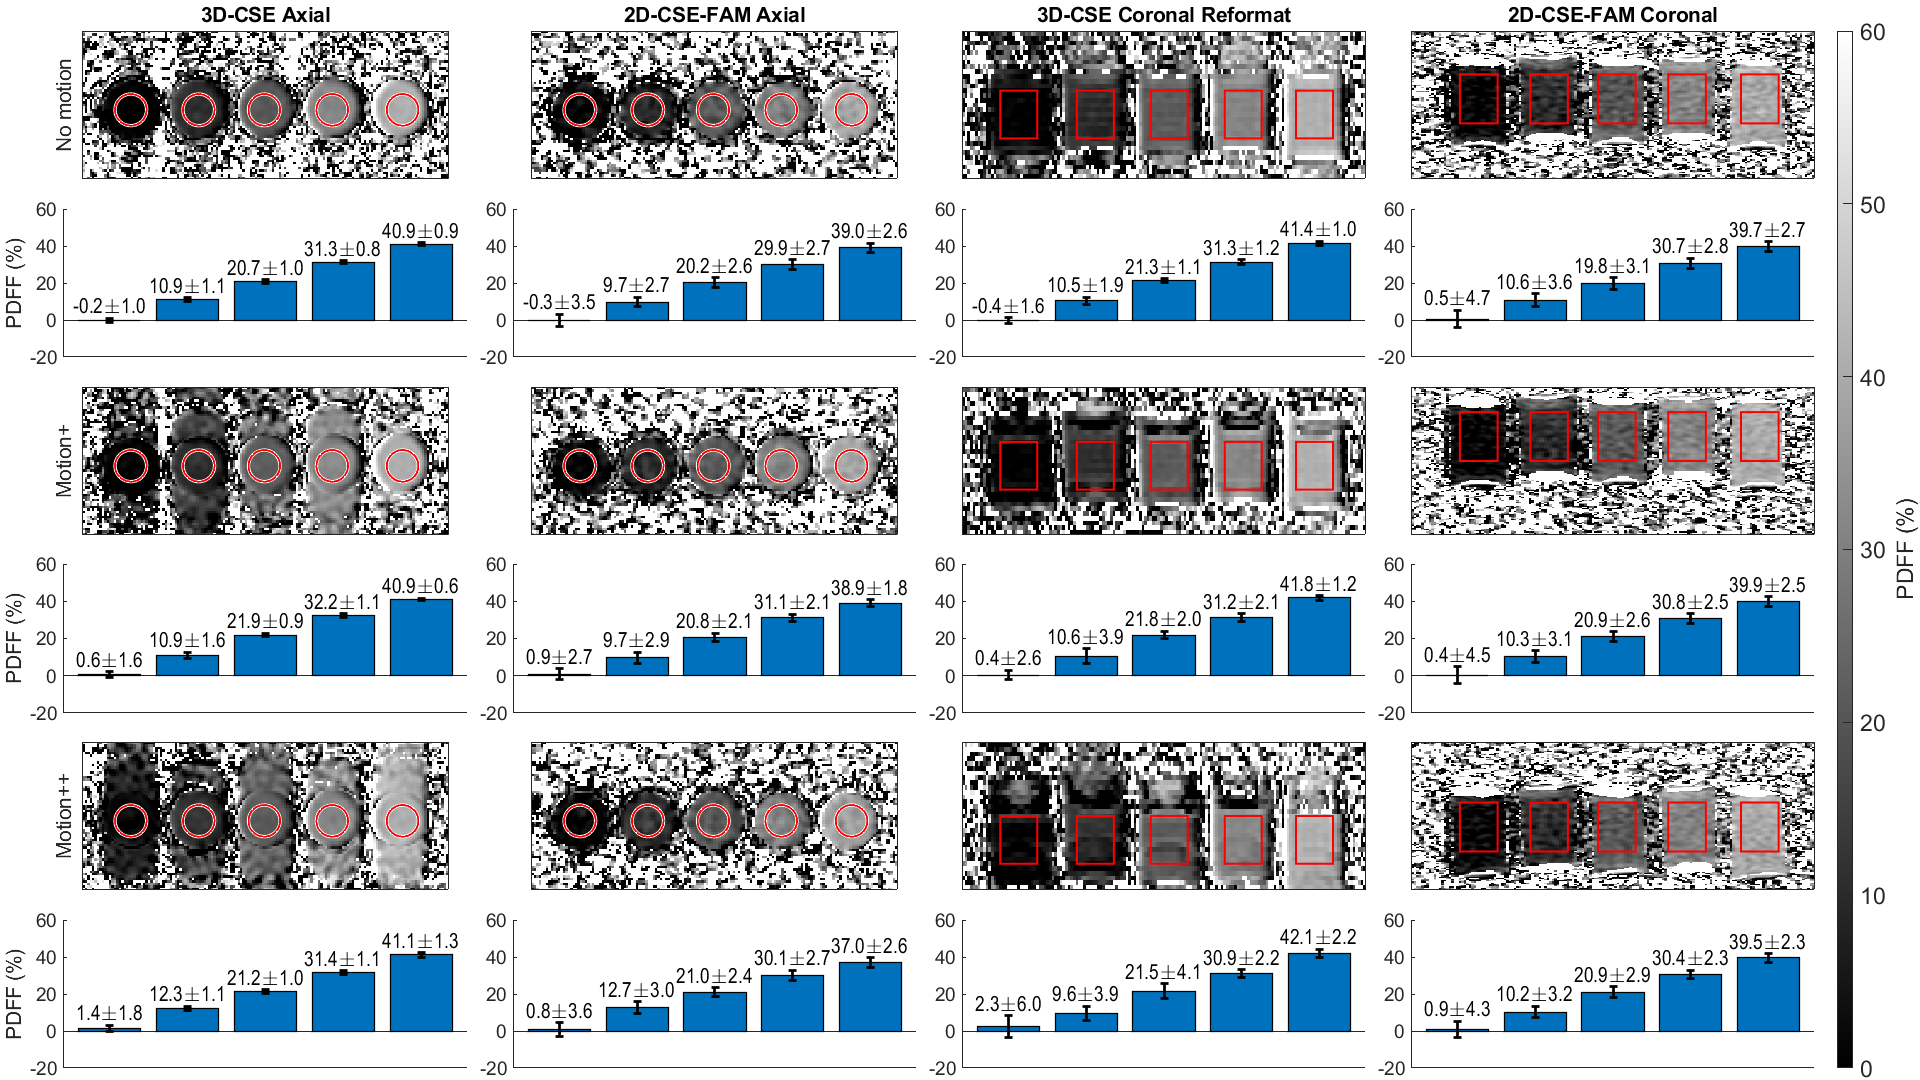
Figure 4: When measuring PDFF, 2D-CSE-FAM imaging shows higher noise, but fewer artifacts in the presence of increasing motion compared to conventional 3D-CSE. Both methods are in good agreement with the nominal PDFF of the phantom.
Reconstructed images and ROIs from our phantom scan are shown. Averages and standard deviations for PDFF in each ROI are shown in the bar graphs below. Coronal images are not to scale (nonsquare pixels.) 3D-CSE coronal data is a reformat of the axial 3D-CSE scan.
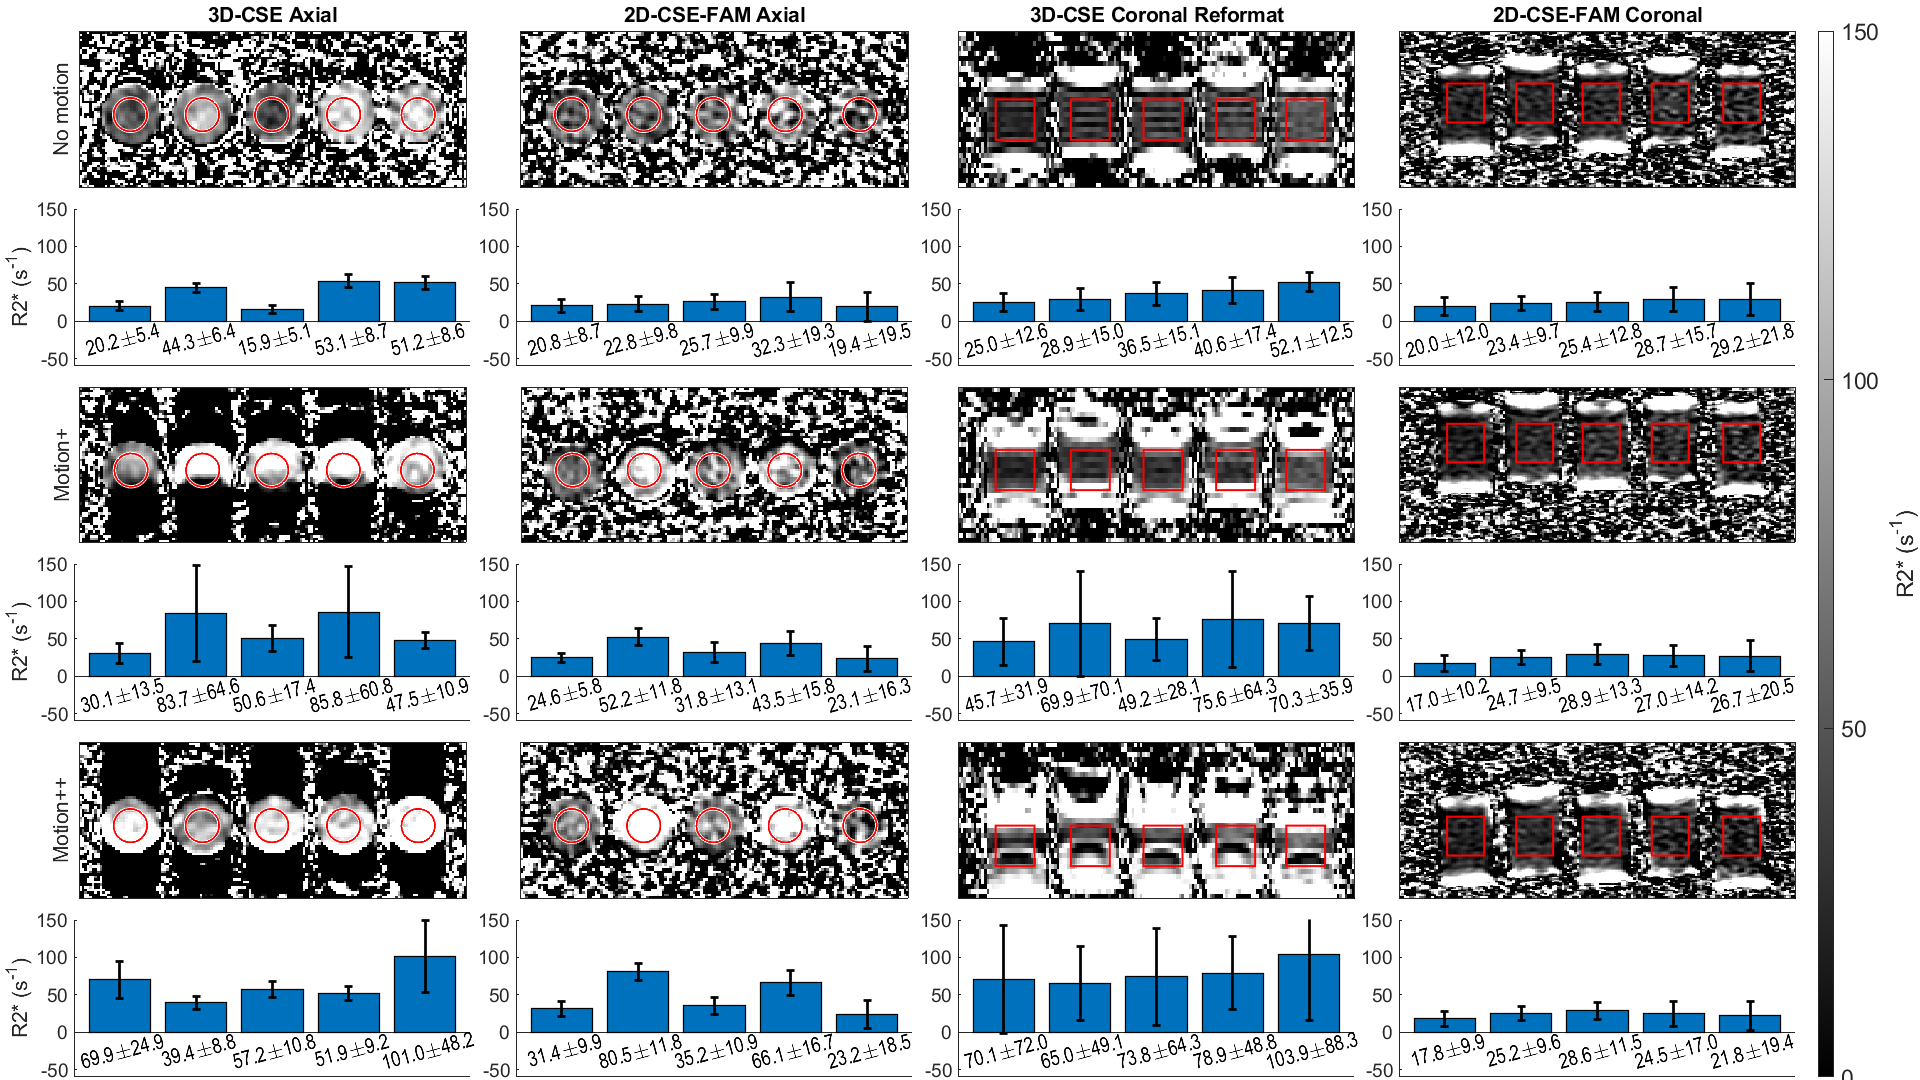
Figure 5: With R2*, 2D-CSE-FAM imaging shows higher noise, fewer artifacts, and higher quantitative reproducibility in the presence of increasing motion. However, bias is present in the axial plane for FAM under motion; this is improved in the coronal plane.
Reconstructed images and ROIs from our phantom scan are shown. Averages and standard deviations for R2* in each ROI are shown in the bar graphs below. Coronal images are not to scale (nonsquare pixels.) 3D-CSE coronal data is a reformat of the axial 3D-CSE scan.