5234
Hydroxyethylcellulose as a tissue mimicking phantom gel: Characterizing the temperature response at 0.5T
Diego F Martinez1, Curtis N. Wiens2, Chad T. Harris2, Will B. Handler1, and Blaine A. Chronik1,3
1The xMR Labs, Physics and Astronomy, Western University, London, ON, Canada, 2Research and Development, Synaptive Medical, Toronto, ON, Canada, 3Medical BioPhysics, Western University, London, ON, Canada
1The xMR Labs, Physics and Astronomy, Western University, London, ON, Canada, 2Research and Development, Synaptive Medical, Toronto, ON, Canada, 3Medical BioPhysics, Western University, London, ON, Canada
Synopsis
Keywords: Phantoms, Thermometry
Temperature Mapping at 0.5T offers an accessible method for non-invasively tracking thermal procedures, relying on tissue temperature response of properties such as Proton Resonant Frequency, Apparent Diffusion Coefficient, or T1. To evaluate performance of temperature mapping using these properties, Hydroxyethyl Cellulose – a tissue mimicking gel – was formulated using the ISO 10974:2018 standard and doped with CuSO4 to match representative tissue T1 values. Temperature response of each of these parameters was: PRF parameter α= (-8.74 ± 0.12) x 10-3 ppm/°C, T1 parameter (12.02 ± 0.07) ms/°C, and ADC parameter (5.34 ± 0.063) x 10-5 mm2/s/°C, all in acceptable range.Introduction
Non-invasive temperature mapping using MRI is critical for monitoring interventional thermal procedures [1]. In these methods a tissue property with temperature dependence such as proton resonance frequency (PRF), apparent diffusion coefficient (ADC), or T1 is measured [1]. This tissue property is then converted into temperature using precomputed calibrations curves. Quantitative evaluation of the performance of temperature mapping with different pulse sequences, acquisition parameter sets, and magnetic field strength are necessary to ensure sufficient precision for a given target application. Hydroxyethyl Cellulose (HEC) gel is used in the ISO 10974:2018 standard for evaluating heating of active implantable medical devices due to its simulated tissue formulation which allows matching of high permittivity lossy tissues such as muscle [2]. This property is also highly desirable in a thermometry phantom. In this study, the temperature dependence of ADC, T1, and PRF of a HEC gel, formulated to match the T1 of brain tissue, was measured at 0.5T.Methods
Phantom Gel ProductionSamples of HEC gel were produced in accordance with Annex L of [4], namely the solution with 96.85% water, 3% HEC [Sigma-Aldrich; St. Louis, Mo], and 0.15% NaCl, giving a relative dielectric permittivity of 78, conductivity of 0.47 S/m, density of 1001 kg/m. In order to reduce T1, the samples were doped using Copper (II) Sulfate [Sigma-Aldrich; St. Louis, Mo] to molar concentrations between 0.5 mM to 3 mM. The doping agent concentration producing a T1 value closest to typical brain tissues was then selected for further experiments.
Property Characterization
All properties were measured using a custom 2 channel solenoid RF coil placed at isocentre of a 0.5T head only MR scanner [Synaptive Medical, Toronto, Canada]. For each property, a vial of HEC was heated, then placed in the solenoid RF setup. The property of interest was then measured as the vial was allowed to cool to room temperature. Temperature of the sample was measured with a NOMAD-Touch [Qualitrol; Fairport, NY] fibre optic system (±1 °C; ±0.1 °C Resolution, -20 to 80 °C range, calibrated using a monitored hot water bath).
PRF Characterization
For the central frequency temperature response, the 2nd channel of the solenoid coil was used as a reference of doped water (T1=629 ms), to regress B0 instabilities. The PRF response was measured as the difference in central frequency between the two channels (cooling gel – reference vial) with a 6s temporal resolution (TR = 6000 ms; readout points = 256; BW = 25 kHz; flip angle = 90°).
T1 Characterization
T1 was measured using an inversion recovery FID method (20 TI values log-spaced between 10 and 3000 ms; readout points = 256; BW = 50kHz; flip angle = 90°; TR=3.25 s) with a total time per measurement of 65 seconds. For each measurement, the inversion recovery curve was non-linearly fit to identify the T1 and M0 values. To account for the longer measurement interval, the temperature was recorded at the beginning and end of each measurement and averaged together to give an average temperature over the measurement. The difference in these temperatures was used to estimate a temperature uncertainty.
ADC Characterization
ADC was measured with an EPI based 3-axis diffusion weighted imaging sequence (10 slices, matrix size = 100x50, 1.6x1.6x2mm resolution, TE = 74.7ms, TR = 4000ms, flip angle = 90°). ADC values for each time point were averaged over a central 25x6.25x8mm region of the slice stack.
Results
The effect that CuSO4 has on the HEC gel at room temperature is shown in Figure 1, with a concentration of 2mM (T1 = 635 ms) chosen for all further gel property characterization. The central frequency shift vs temperature is shown in Figure 2, with α = (-8.74 ± 0.12) x 10-3 ppm/°C. In Figure 3, the T1 relation to temperature is shown, with a slope of 12.02 ± 0.07 ms/°C in the range below 45°C. Finally Figure 4 shows the relation between ADC and temperature, with a slope of (5.34 ± 0.063) x 10-5 mm2/s/°C found over the temperature range.Discussion
This study has encompassed the characterization of a gel with preferable parameters for thermal mapping using MRI.The PRF alpha coefficient is in agreement with reported values between –0.0111 and –0.00674 ppm/°C depending on tissue [4].
Our measured values of T1 temperature dependence are in line with the reported 2-3%/°C change reported in tissue across field strengths [1] and suggests viability of T1 based temperature mapping can be accurately evaluated using this phantom gel. Some evidence of a second regime of behavior can be seen at high temperature, with non-linearity beginning above 45°C, similar to other findings on T1 thermometry [3].
Likewise, the ADC coefficient sits in line with the expected shift of 2.0-2.5%/°C [1] and showed excellent linearity over the temperatures measured.
Characterization of HEC gel was conducted for use in evaluation of thermal tracking methods using MRI. The measured PRF parameter α= (-8.74 ± 0.12) x 10-3 ppm/°C, T1 parameter 12.02 ± 0.07 ms/°C, and ADC parameter (5.34 ± 0.063) x 10-5 mm2/s/°C, all fall within the expected range and successfully mimic tissue.
Acknowledgements
No acknowledgement found.References
[1] Odéen H, Parker DL. (2019). Magnetic resonance thermometry and its biological applications - Physical principles and practical considerations. Prog Nucl Magn Reson Spectrosc. 2019;110:34-61.
[2] International Organization for Standardization. (2018). Assessment of the safety of magnetic resonance imaging for patients with an active implantable medical device (ISO/TS 10974:2018)
[3] Rieke V, Pauly KB. (2008). MR Thermometry. J Magn Reson Imaging 2008; 27(2): 376–390.
[4] McDannold N. (2005). Quantitative MRI-based temperature mapping based on the proton resonant frequency shift: Review of validation studies. International Journal of Hyperthermia, 21:6, 533-546.
Figures
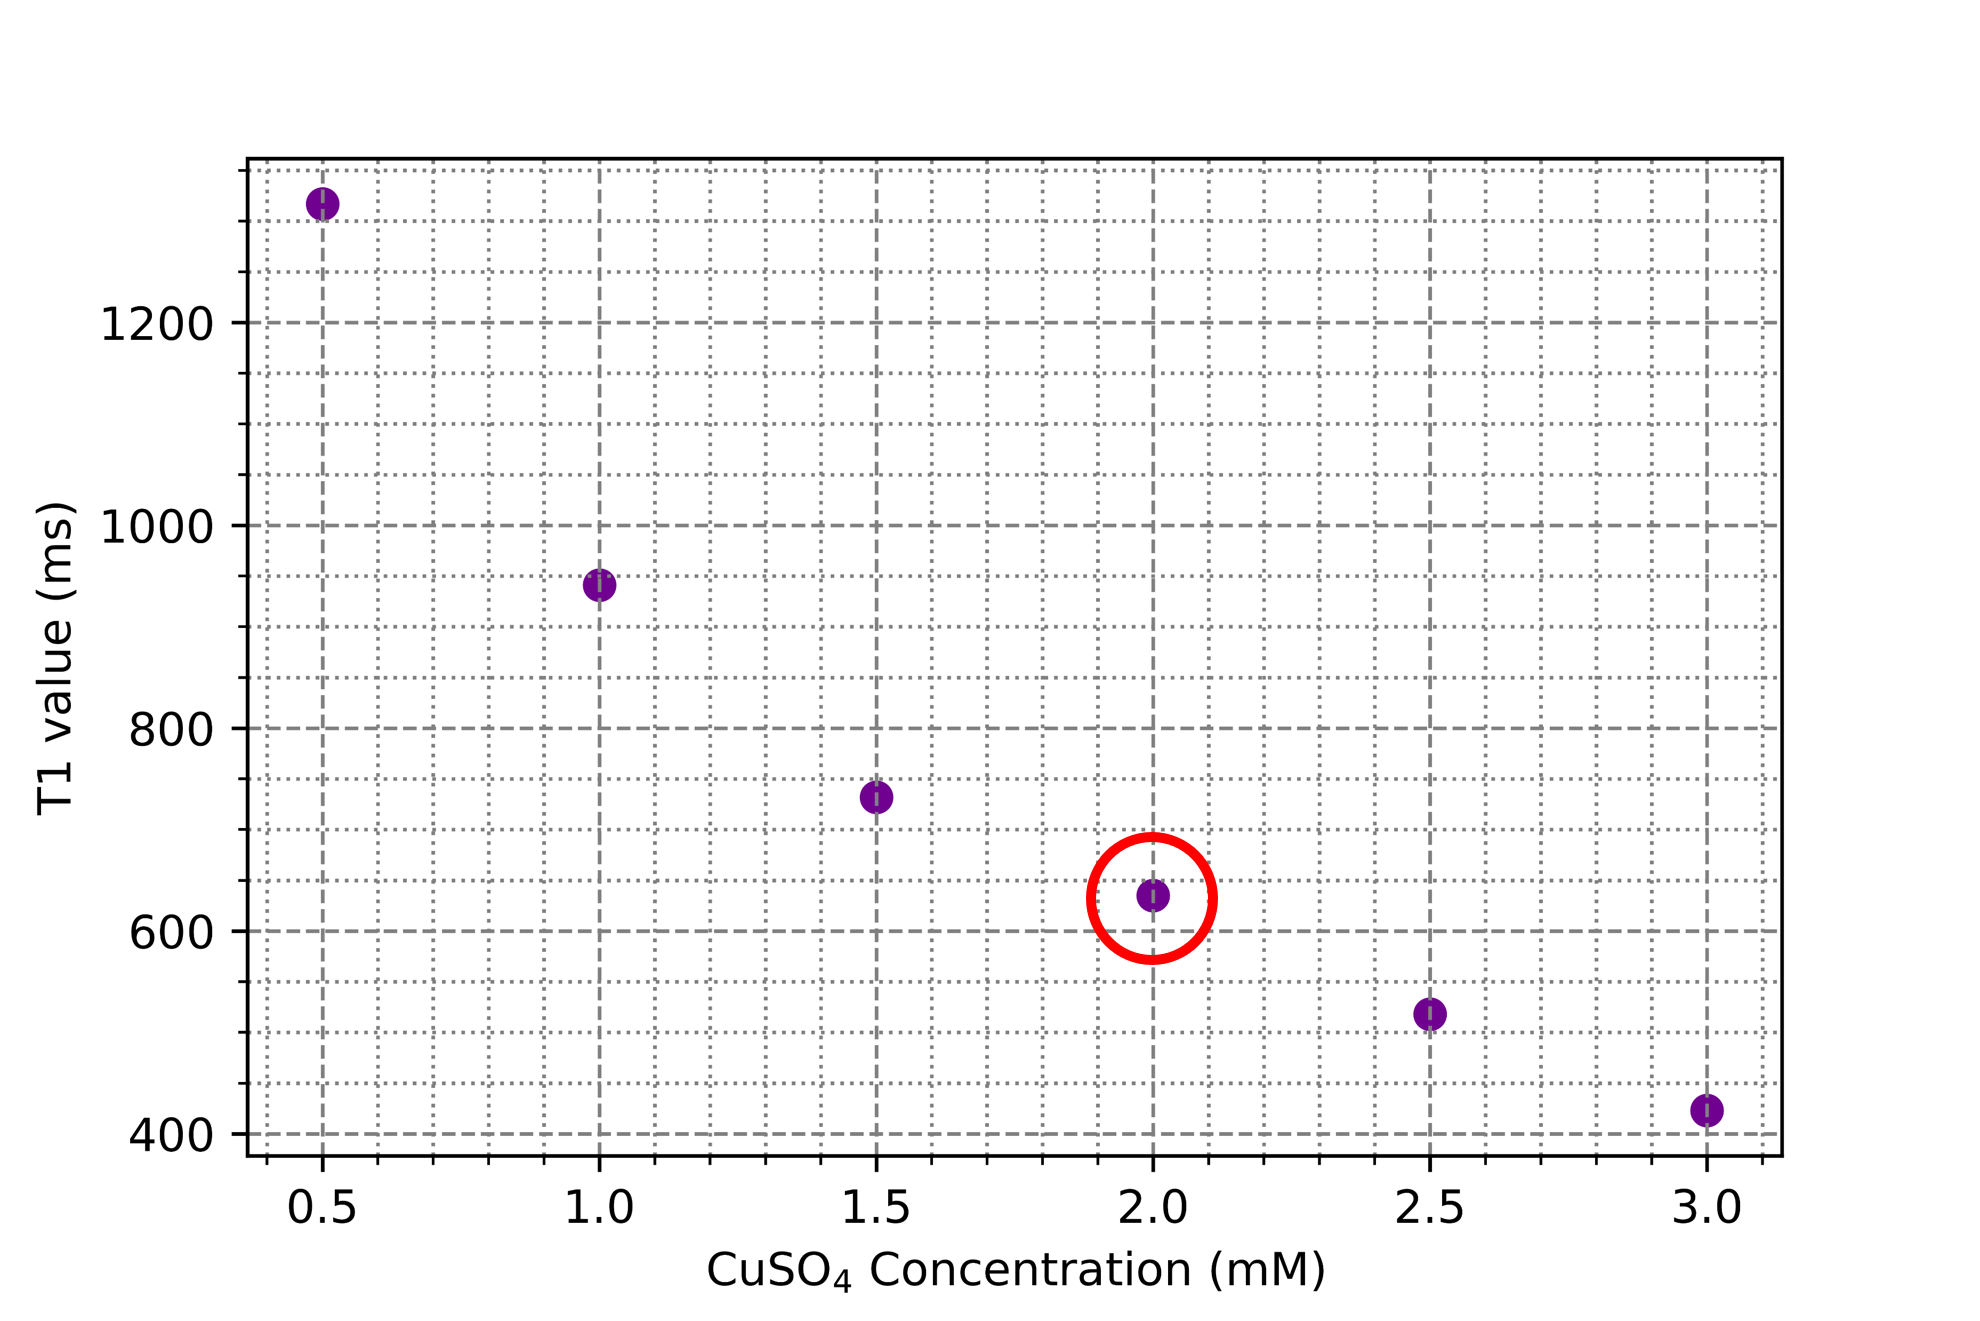
Figure 1: Relaxivity parameter T1 measured using an inversion recovery FID sequence to determine the appropriate doping concentration of Copper(II) Sulfate in HEC Gel. 2mM concentration (red circle) was ultimately chosen for gel formulation.
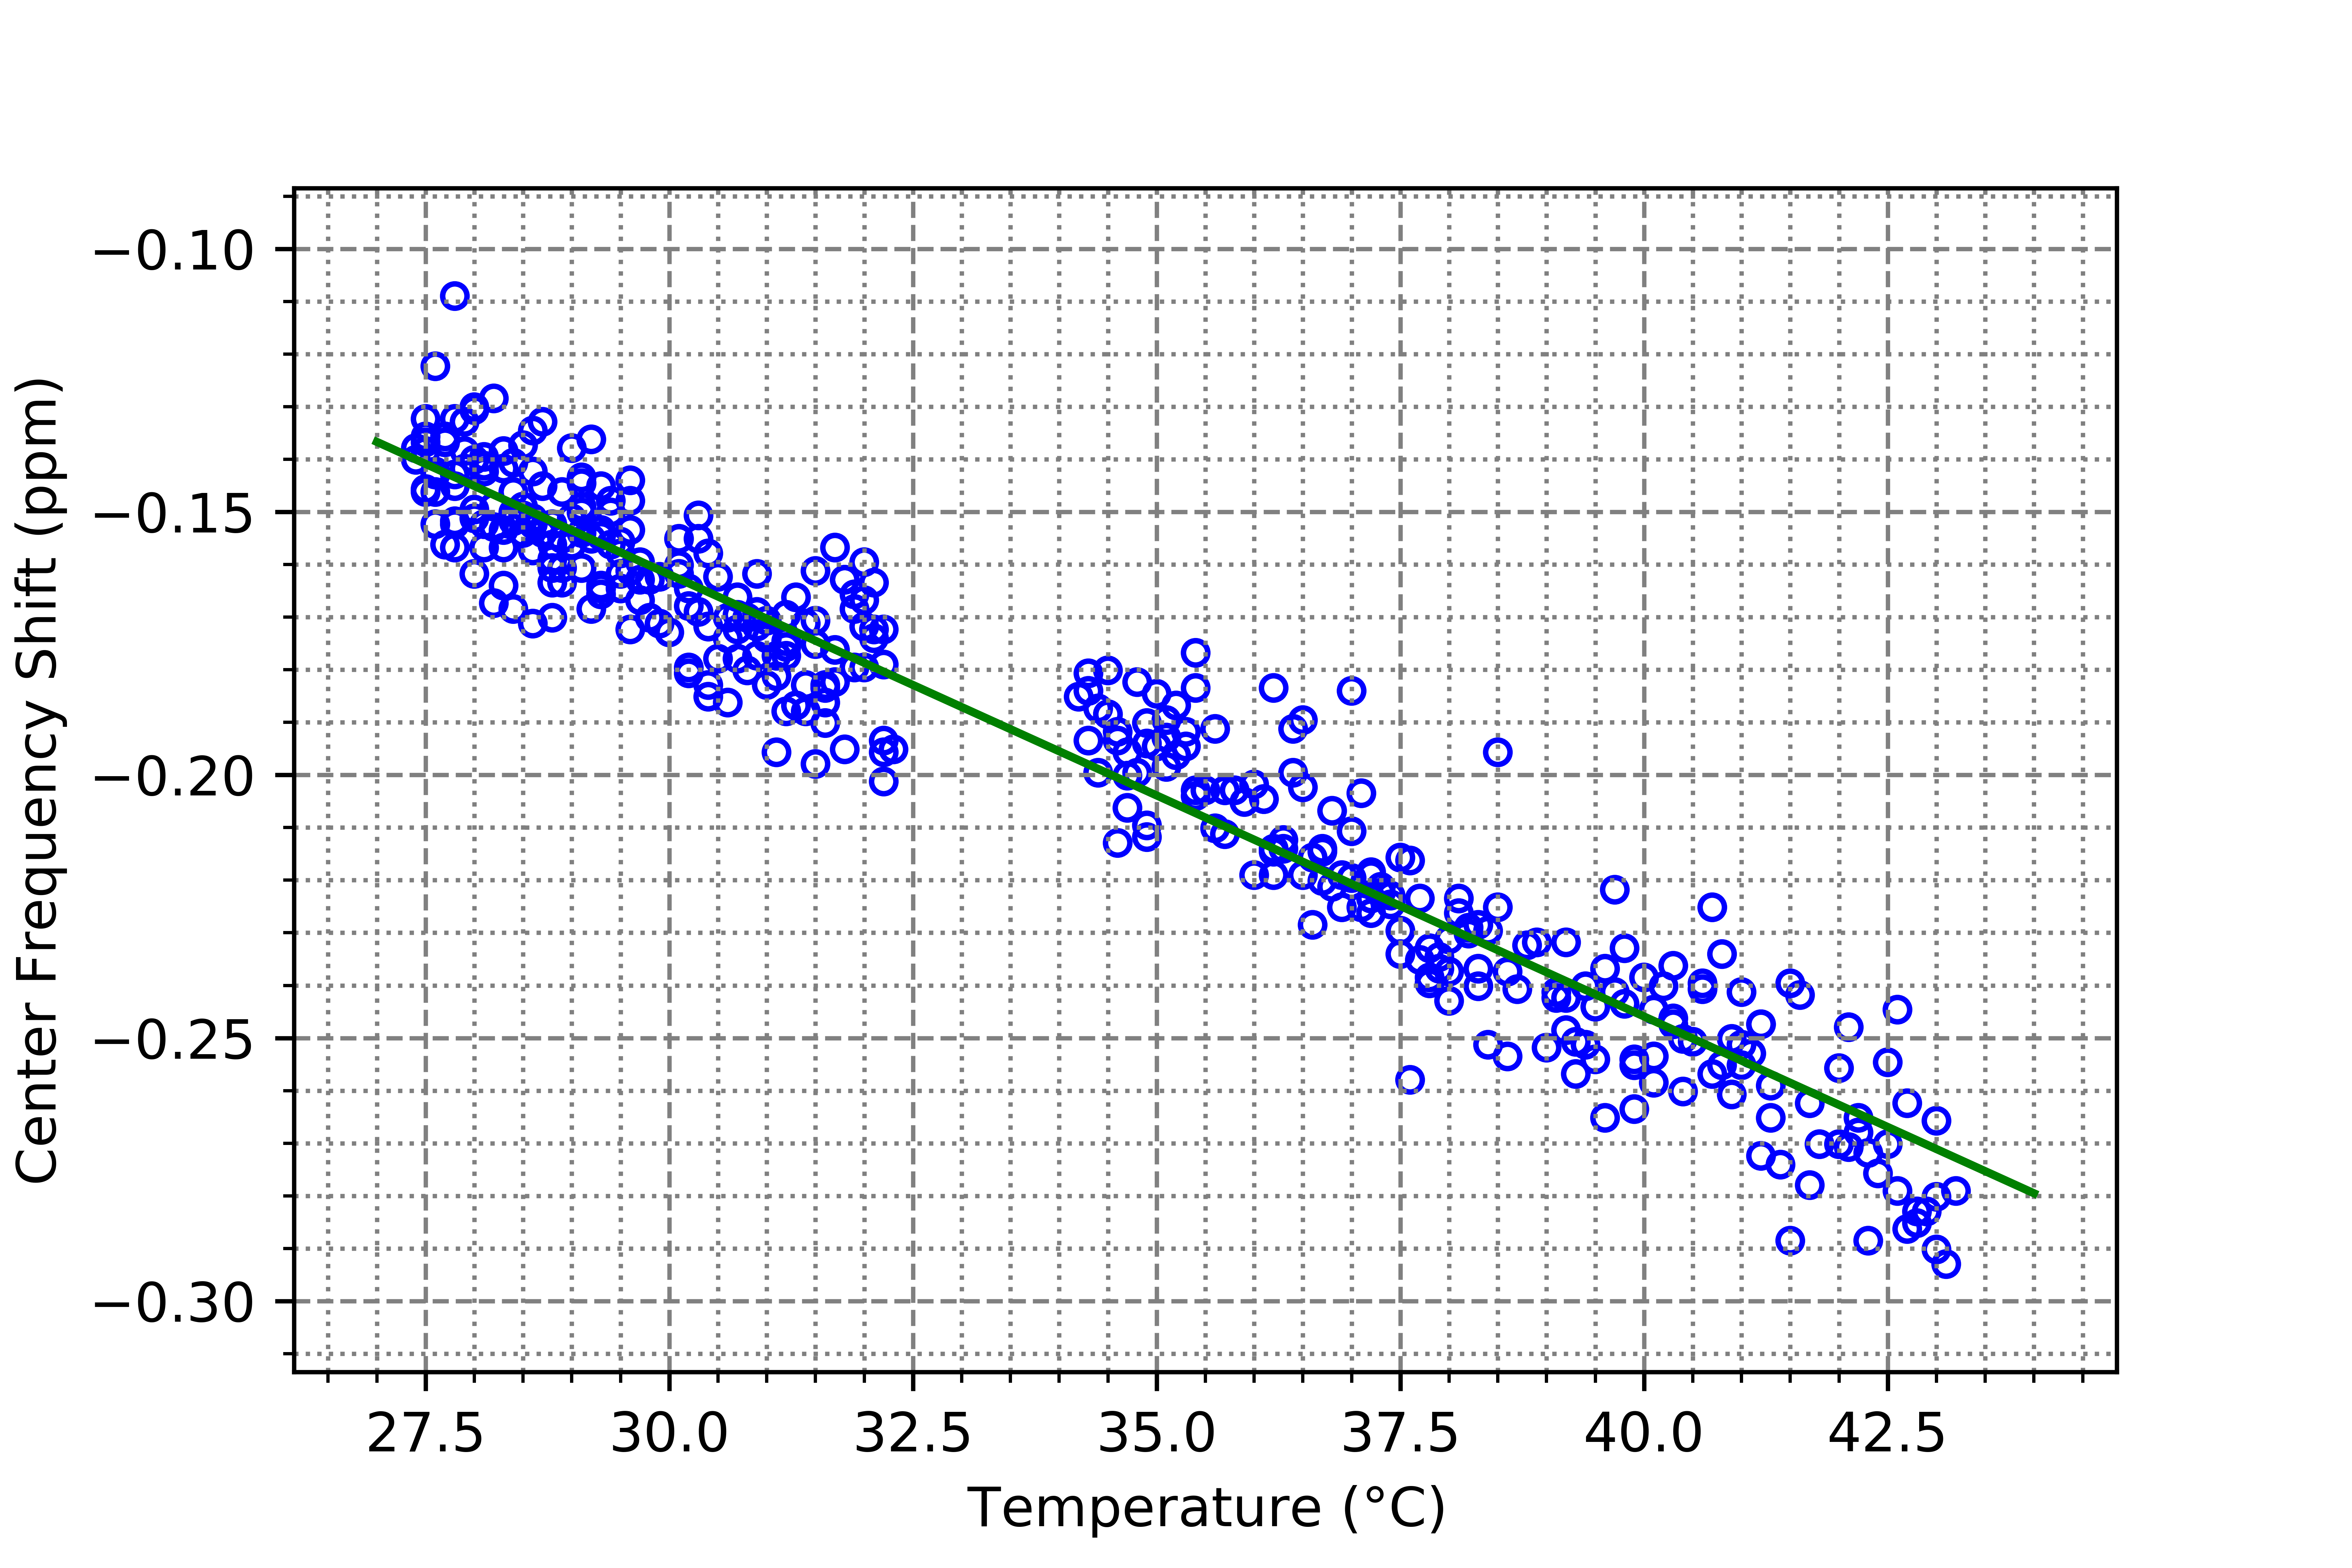
Figure 2: Change in the Central Frequency vs Temperature for a vial of HEC gel monitored via optical temperature probe, with change in frequency relative to a reference sample kept at constant temperature. From a linear fit, an alpha parameter of (-8.74 ± 0.12) x 10-3 ppm/°C was obtained.
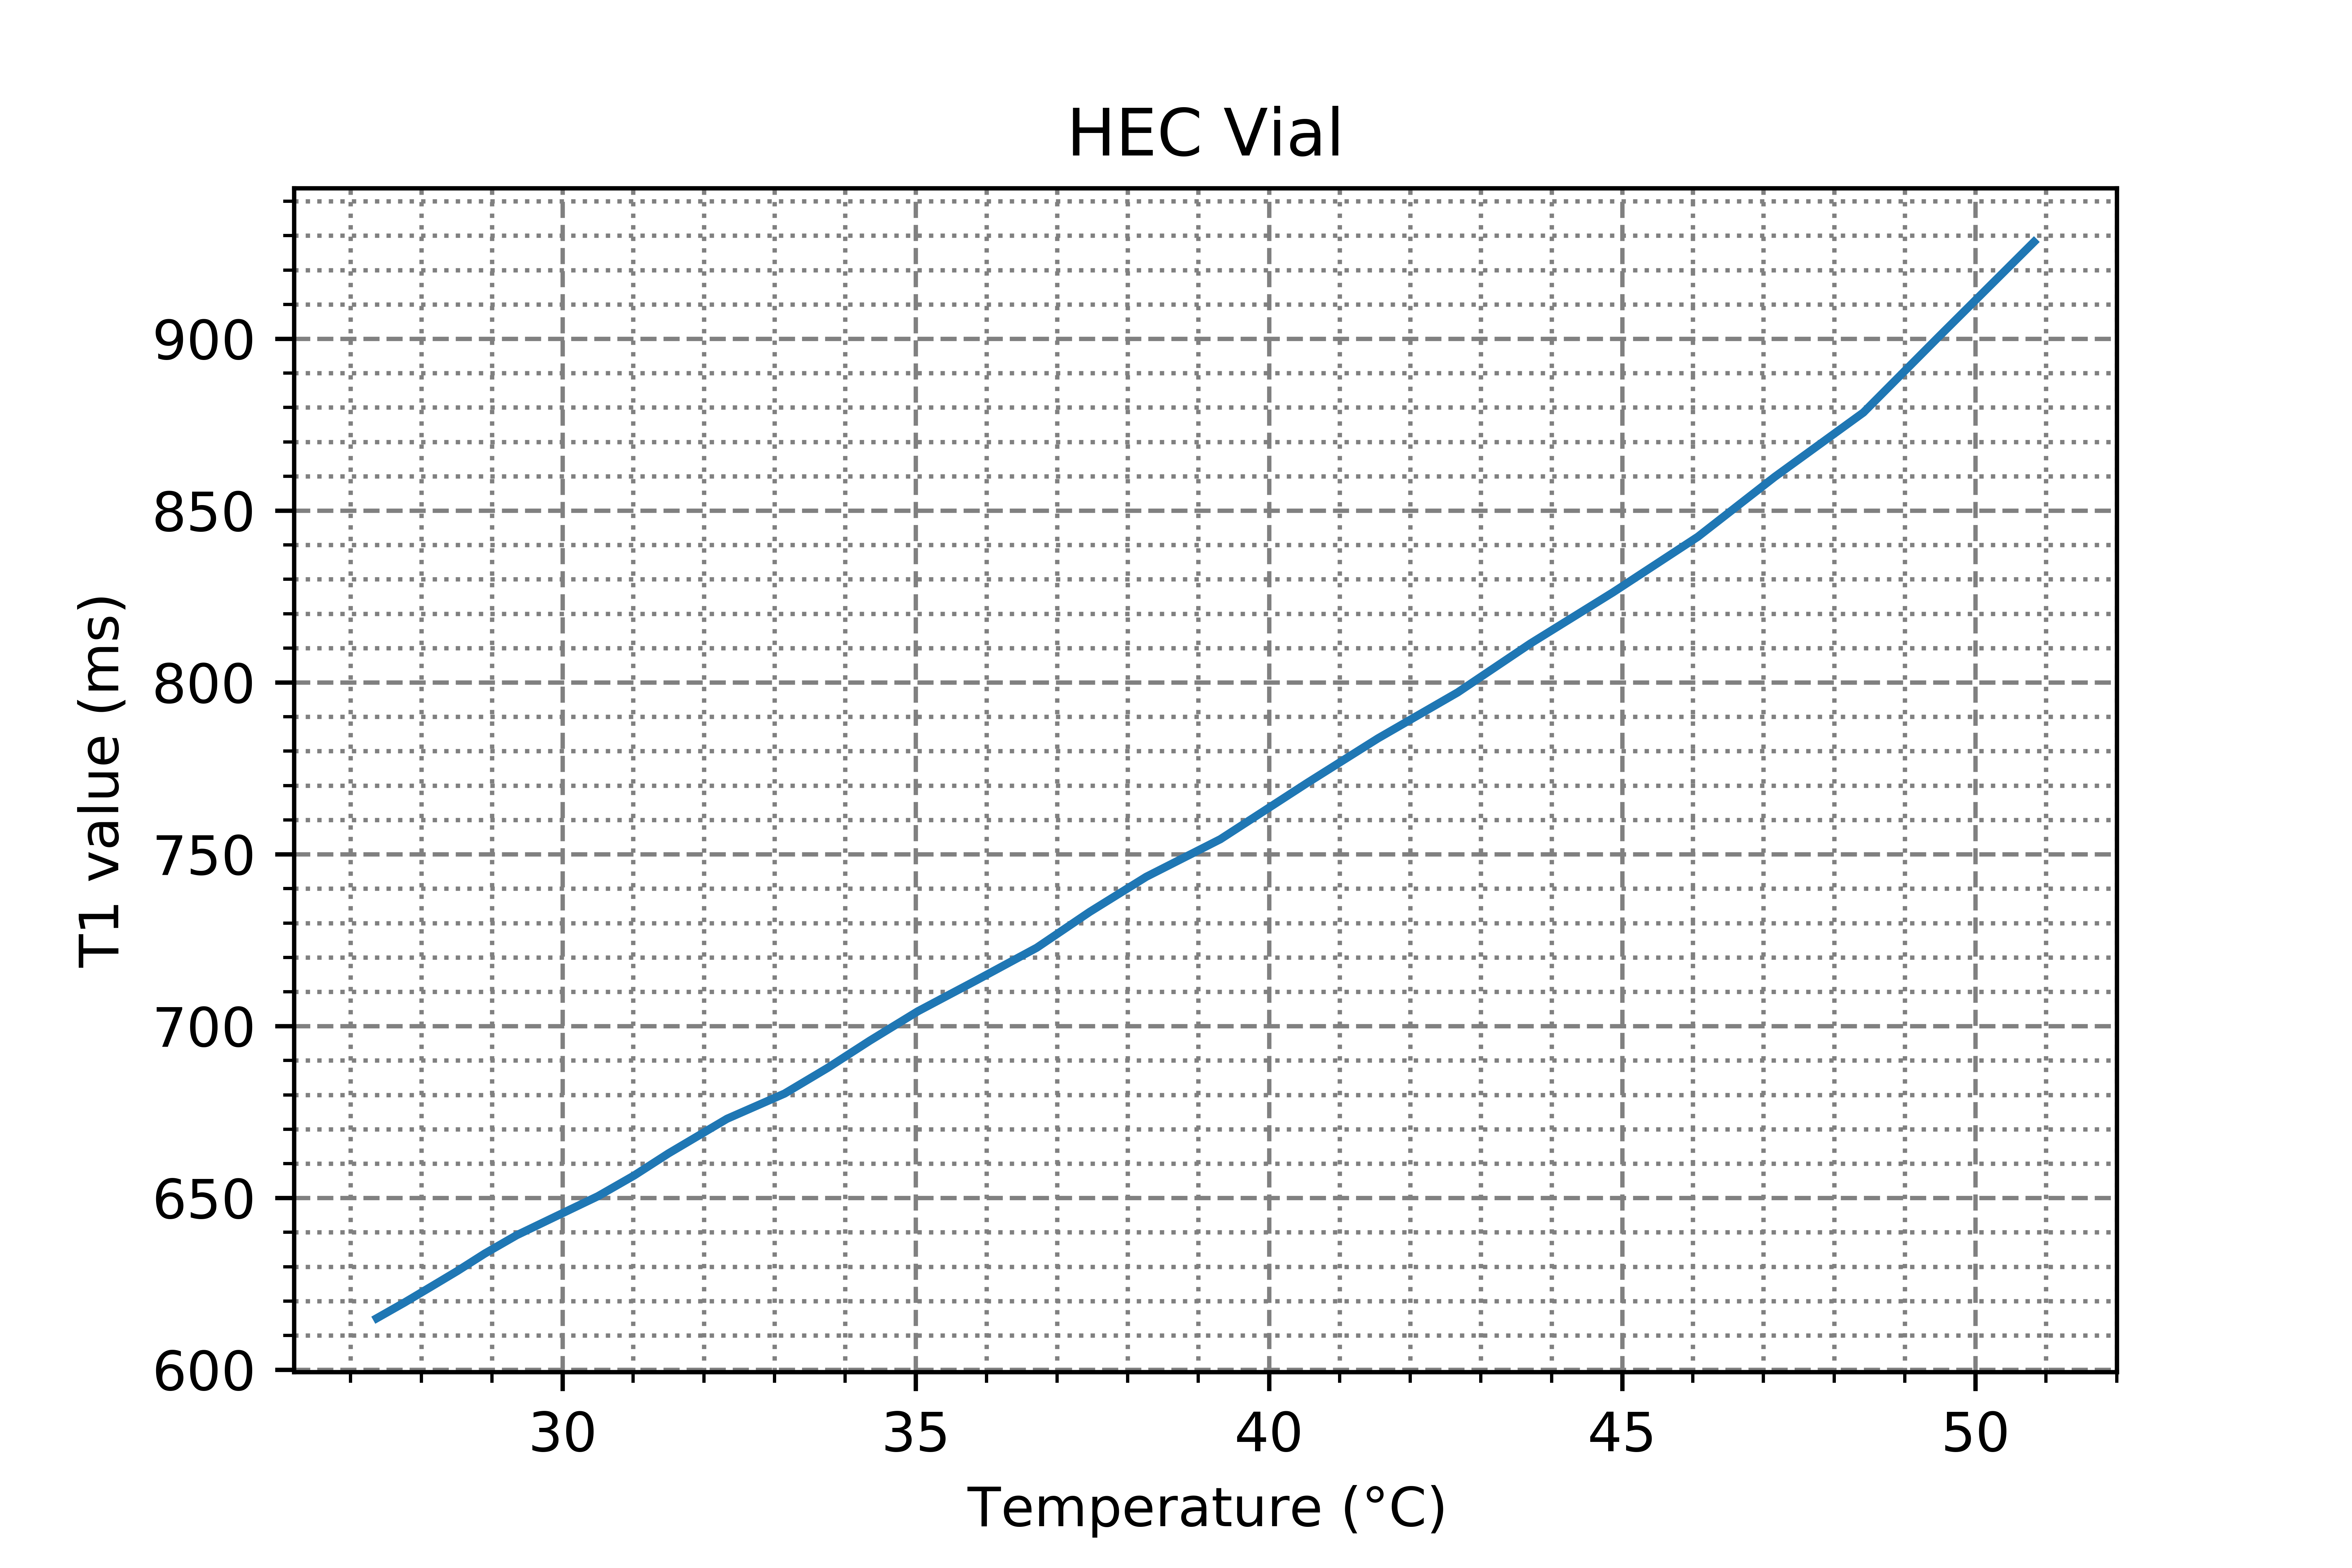
Figure 3: Change in measured T1 relaxation time vs Temperature for a vial of HEC gel monitored using an optical thermometer, with T1s measured using an inversion recovery sequence (TI=10-3000ms, 20 samples logarithmically spaced, TR=3250ms), with a linear fit resulting in T1 temperature parameter m1= 12.02± 0.07 ms/°C over the linear region.
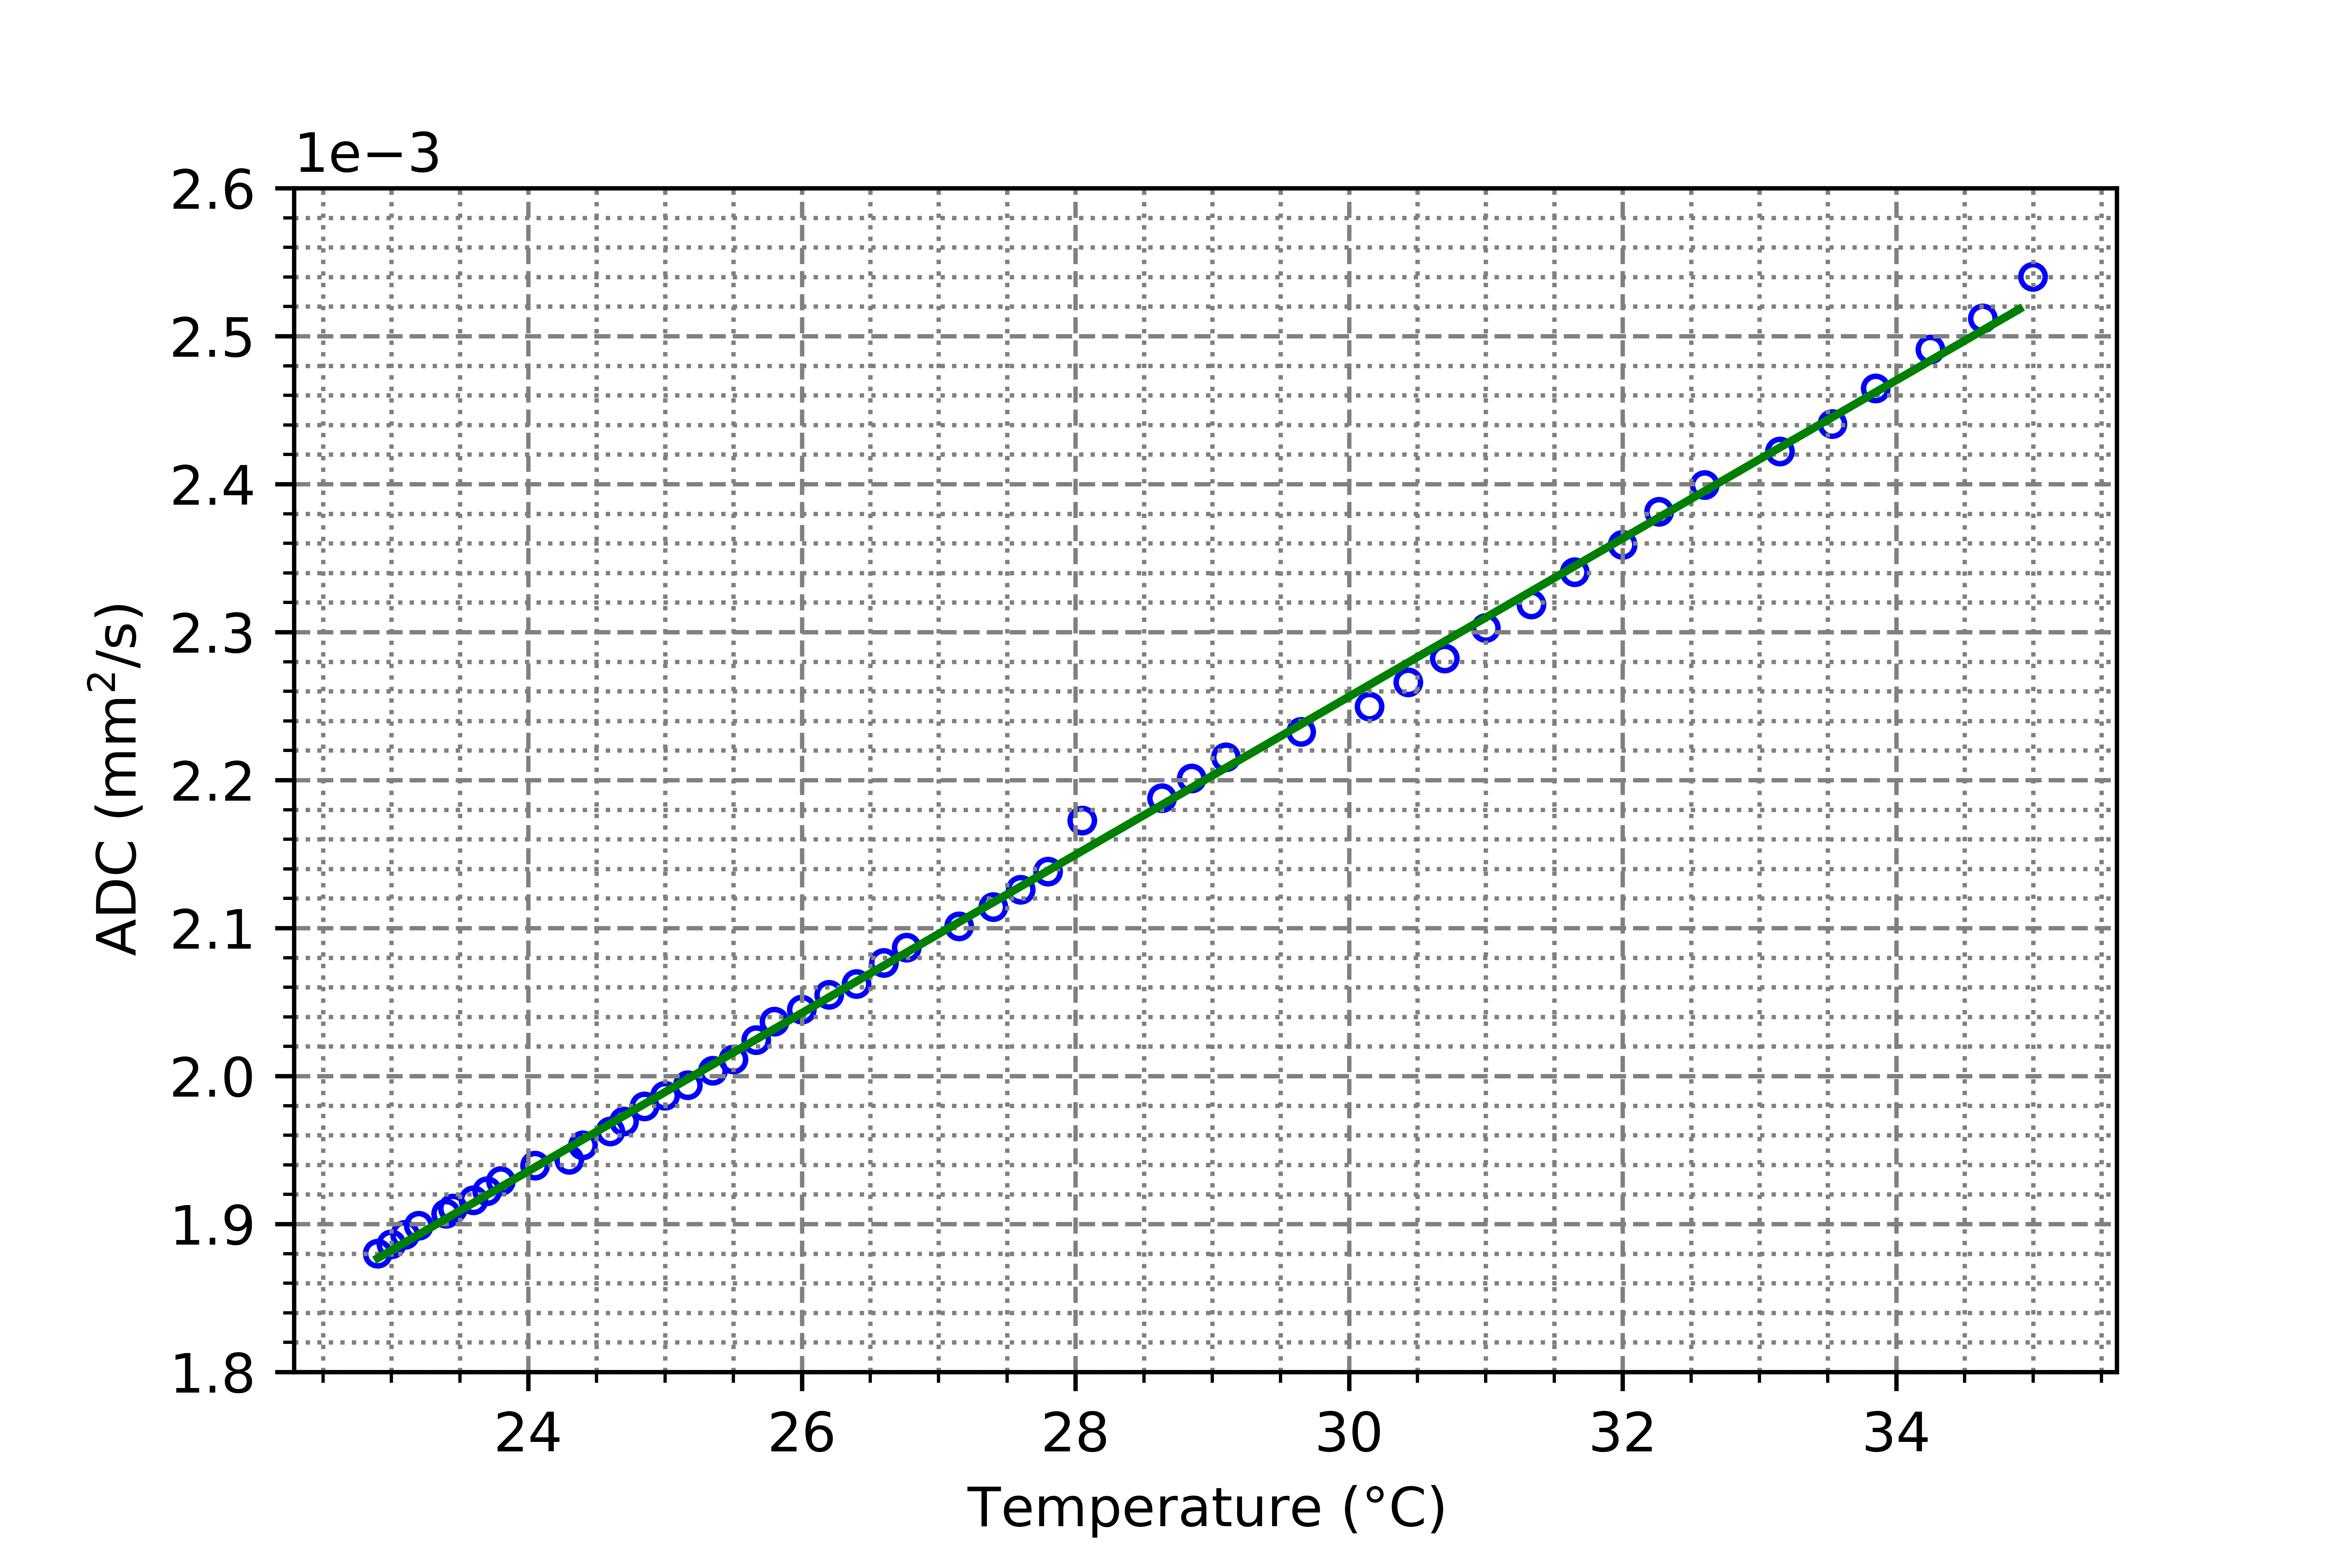
Figure 4: Change in the Apparent Diffusion Coefficient vs Temperature for a vial of HEC gel, linear fit with slope (5.34 ± 0.063) x 10-5 mm2/s/°C.
DOI: https://doi.org/10.58530/2023/5234