5229
Imaging-Based Subject-Specific SAR Maps using B1-mapping and Electrical Properties Tomography in a heterogenous Brain Phantom1Advanced Materials Metrology and Life Science, Istituto Nazionale di Ricerca Metrologica, Torino, Italy, 2CREATIS Laboratory, University of Lyon, Lyon, France, 3Department of Radiology, University Hospital Saint-Etienne, Saint-Etienne, France
Synopsis
Keywords: Safety, Safety, Specific Absorption Rate, SAR
In this work a heterogeneous realistic brain phantom, with electric and magnetic properties in the range of healthy gray-matter and white-matter, was constructed. The phantom was scanned at 3 T where T1 maps, T2 maps, magnitude, and phase information of the B1 field were acquired. The electrical conductivity was derived using a convection reaction EPT approach and the E field was obtained by solving Ampere’s law from the B1 field. From this information, imaging-based subject-specific SAR maps were acquired and compared to simulation-based SAR maps. The analysis time (acquisition and SAR calculation) was under 6 minutes.Introduction
The specific absorption rate (SAR) is used to monitor the amount of power the patient absorbs during MRI examinations. The spatial distribution of local SAR in heterogeneous models, with known tissue electrical properties, is often calculated with numerical simulations following realistic RF exposure scenarios. However, numerical simulations are often computationally expensive and require knowledge of the tissues’ electrical properties (electrical conductivity, and electrical permittivity). Hence, simulation-based subject-specific SAR analysis during MRI exams is not straightforward.Nonetheless, the E field can be indirectly estimated using B1-mapping methods and the electrical conductivity (σ) can be measured using MR-based electrical properties tomography (EPT) techniques. Little is known if the information obtained is sufficient to estimate SAR under realistic scenarios and with tolerable scan times. The aim of this study is to i) design a control setup of a heterogeneous realistic brain phantom and ii) study the feasibility of imaging-based subject-specific EPT-based SAR maps under acceptable scan times.
Methods
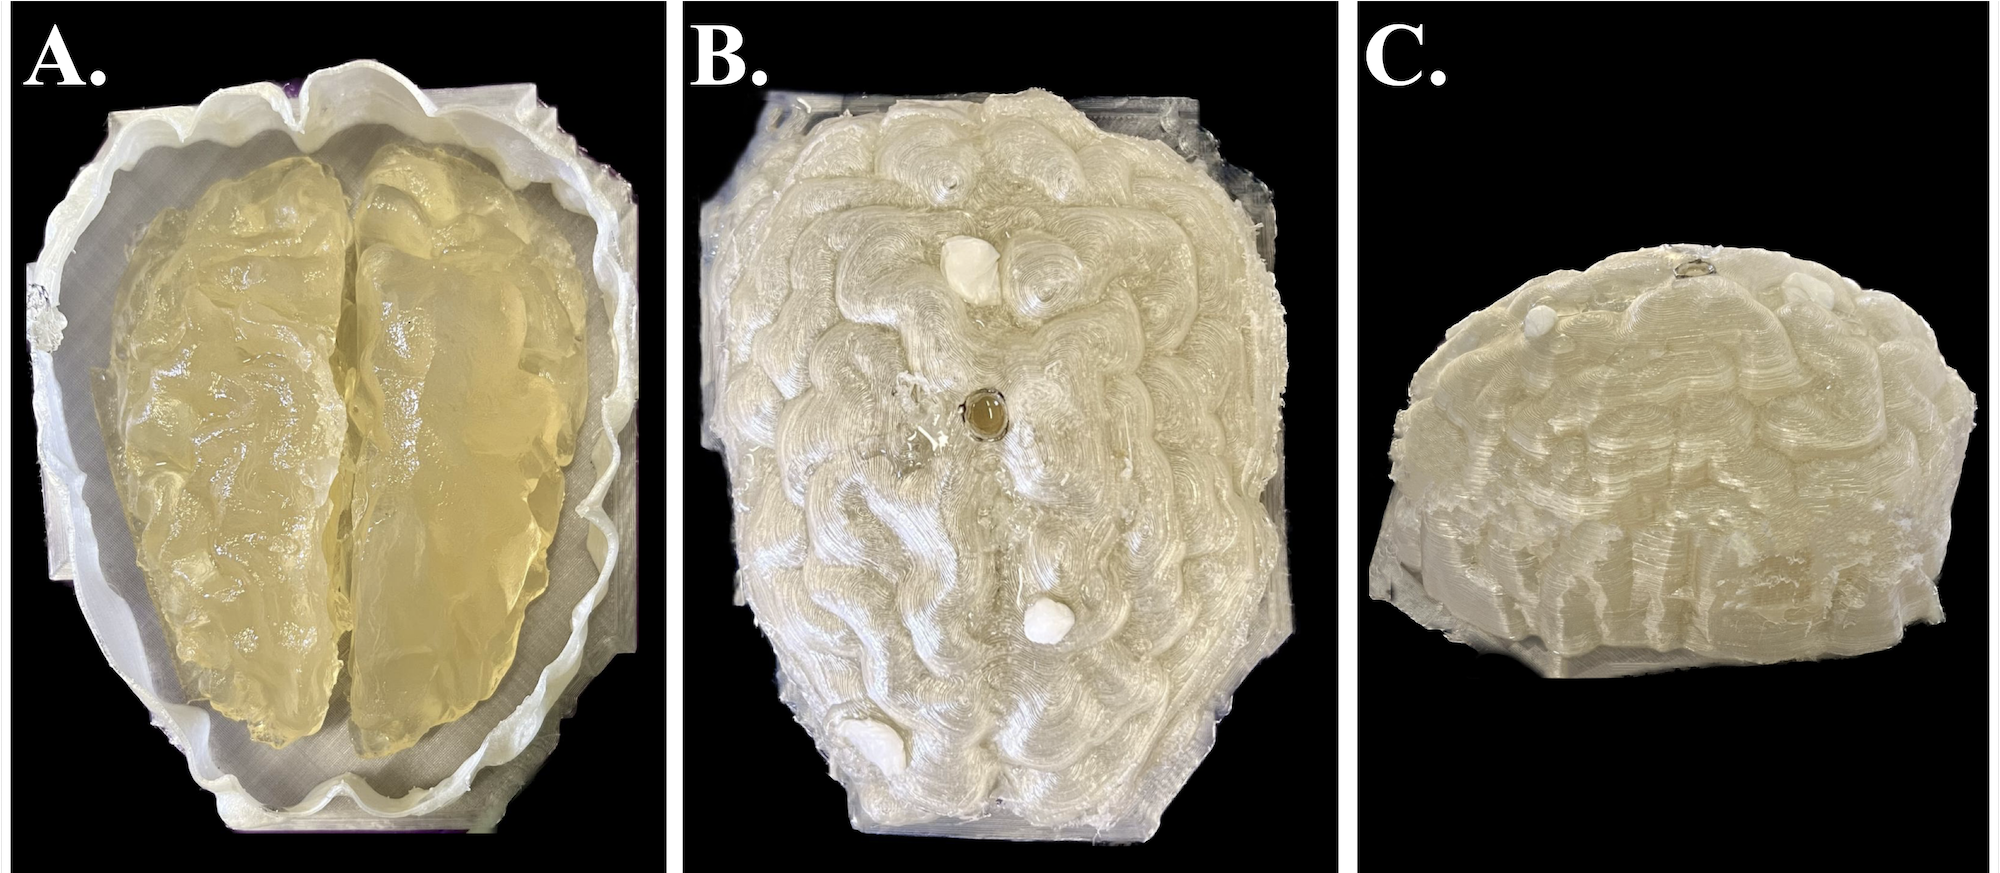
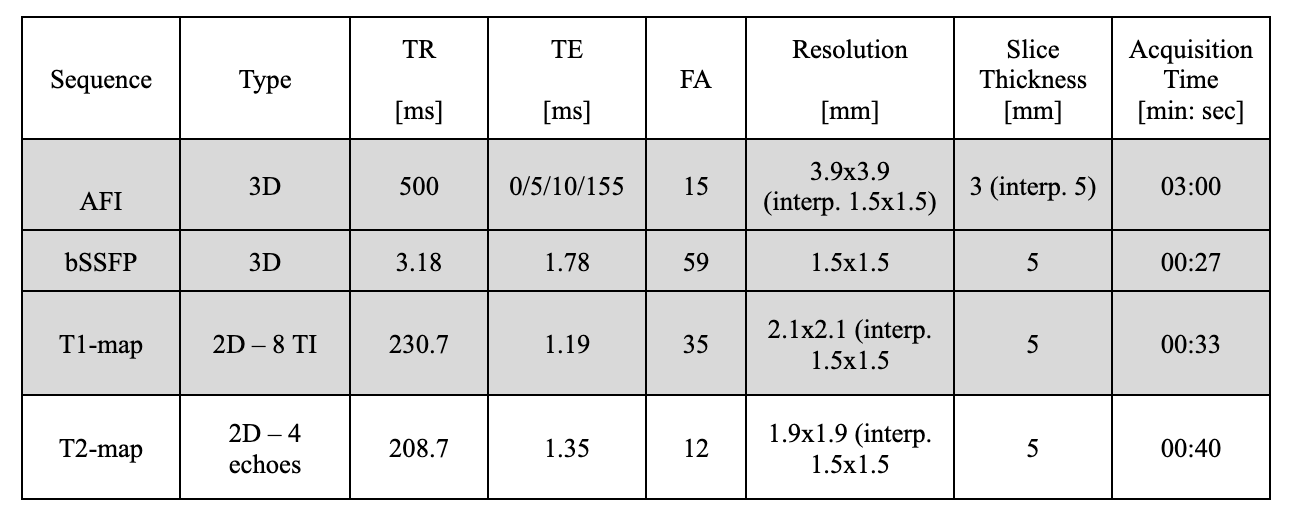
i. Phantom Construction – The upper-half brain portion of the gray matter (GM) and white matter (WM) from the female-71 model of the XCAT library were used for the phantom construction. A mold for the WM and a cast for the GM were separately 3D printed and filled with a gel that mimicked the electrical and relaxation properties of WM and GM, respectively (Fig. 1)1. Both the GM and WM gel compartments were in direct contact with each other.ii. Image Acquisition – Data acquisition was performed through a 3 T Prisma scanner (Siemens Healthineers, Erlangen, Germany) with the birdcage body coil as Tx and a 64-channel head coil as Rx. B1+ magnitude was obtained using an Actual Flip Angle sequence (AFI), and B1+ phase was obtained with the 3D-bSSFP sequence (Transceive phase assumption)2. T1 and T2 mapping sequences were performed for characterizing and segmenting each phantom compartment. Sequence parameters are summarized in Table 1.
iii. Offline Analysis – All the sequences have been interpolated into the reference system of the bSSFP data. Multi-channel phase data from the 3D bSSFP sequence were combined into a single channel by taking the maximum energy channel of a virtual coil decomposition3 and used for obtaining the electrical conductivity using a phase-based convection reaction EPT method4 (Spherical Savitzky-Golay filter radius = 2.5 voxels, artificial diffusion coefficient = 0.02 rad). The median EPT estimated σ values for the two compartments were compared against the values obtained with an open-ended coaxial probe (SPEAG, Switzerland) at room temperature. To minimize noise effects in the analysis, the EPT-based median σ values were masked using the tissue segmentation obtained from the T1 maps.
The intrinsic electric field was obtained by solving Ampere's law to the normalized B1+ magnitude. Normalized SAR maps were acquired assuming a homogenous tissue density (1000 kg/m3) and electric relative permittivities (ε) set as εGM= 73; εWM= 525. Prior to the SAR estimation, the obtained electric field was filtered using a median filter (kernel=5). Imaging-based SAR maps were compared against simulation-based SAR maps performed with the WM and GM compartments at 128 MHz using a circularly polarized high-pass birdcage body coil (Sim4Life, Zurich Med Tech, 16 legs, diameter: 713 mm, height: 450 mm).
Results
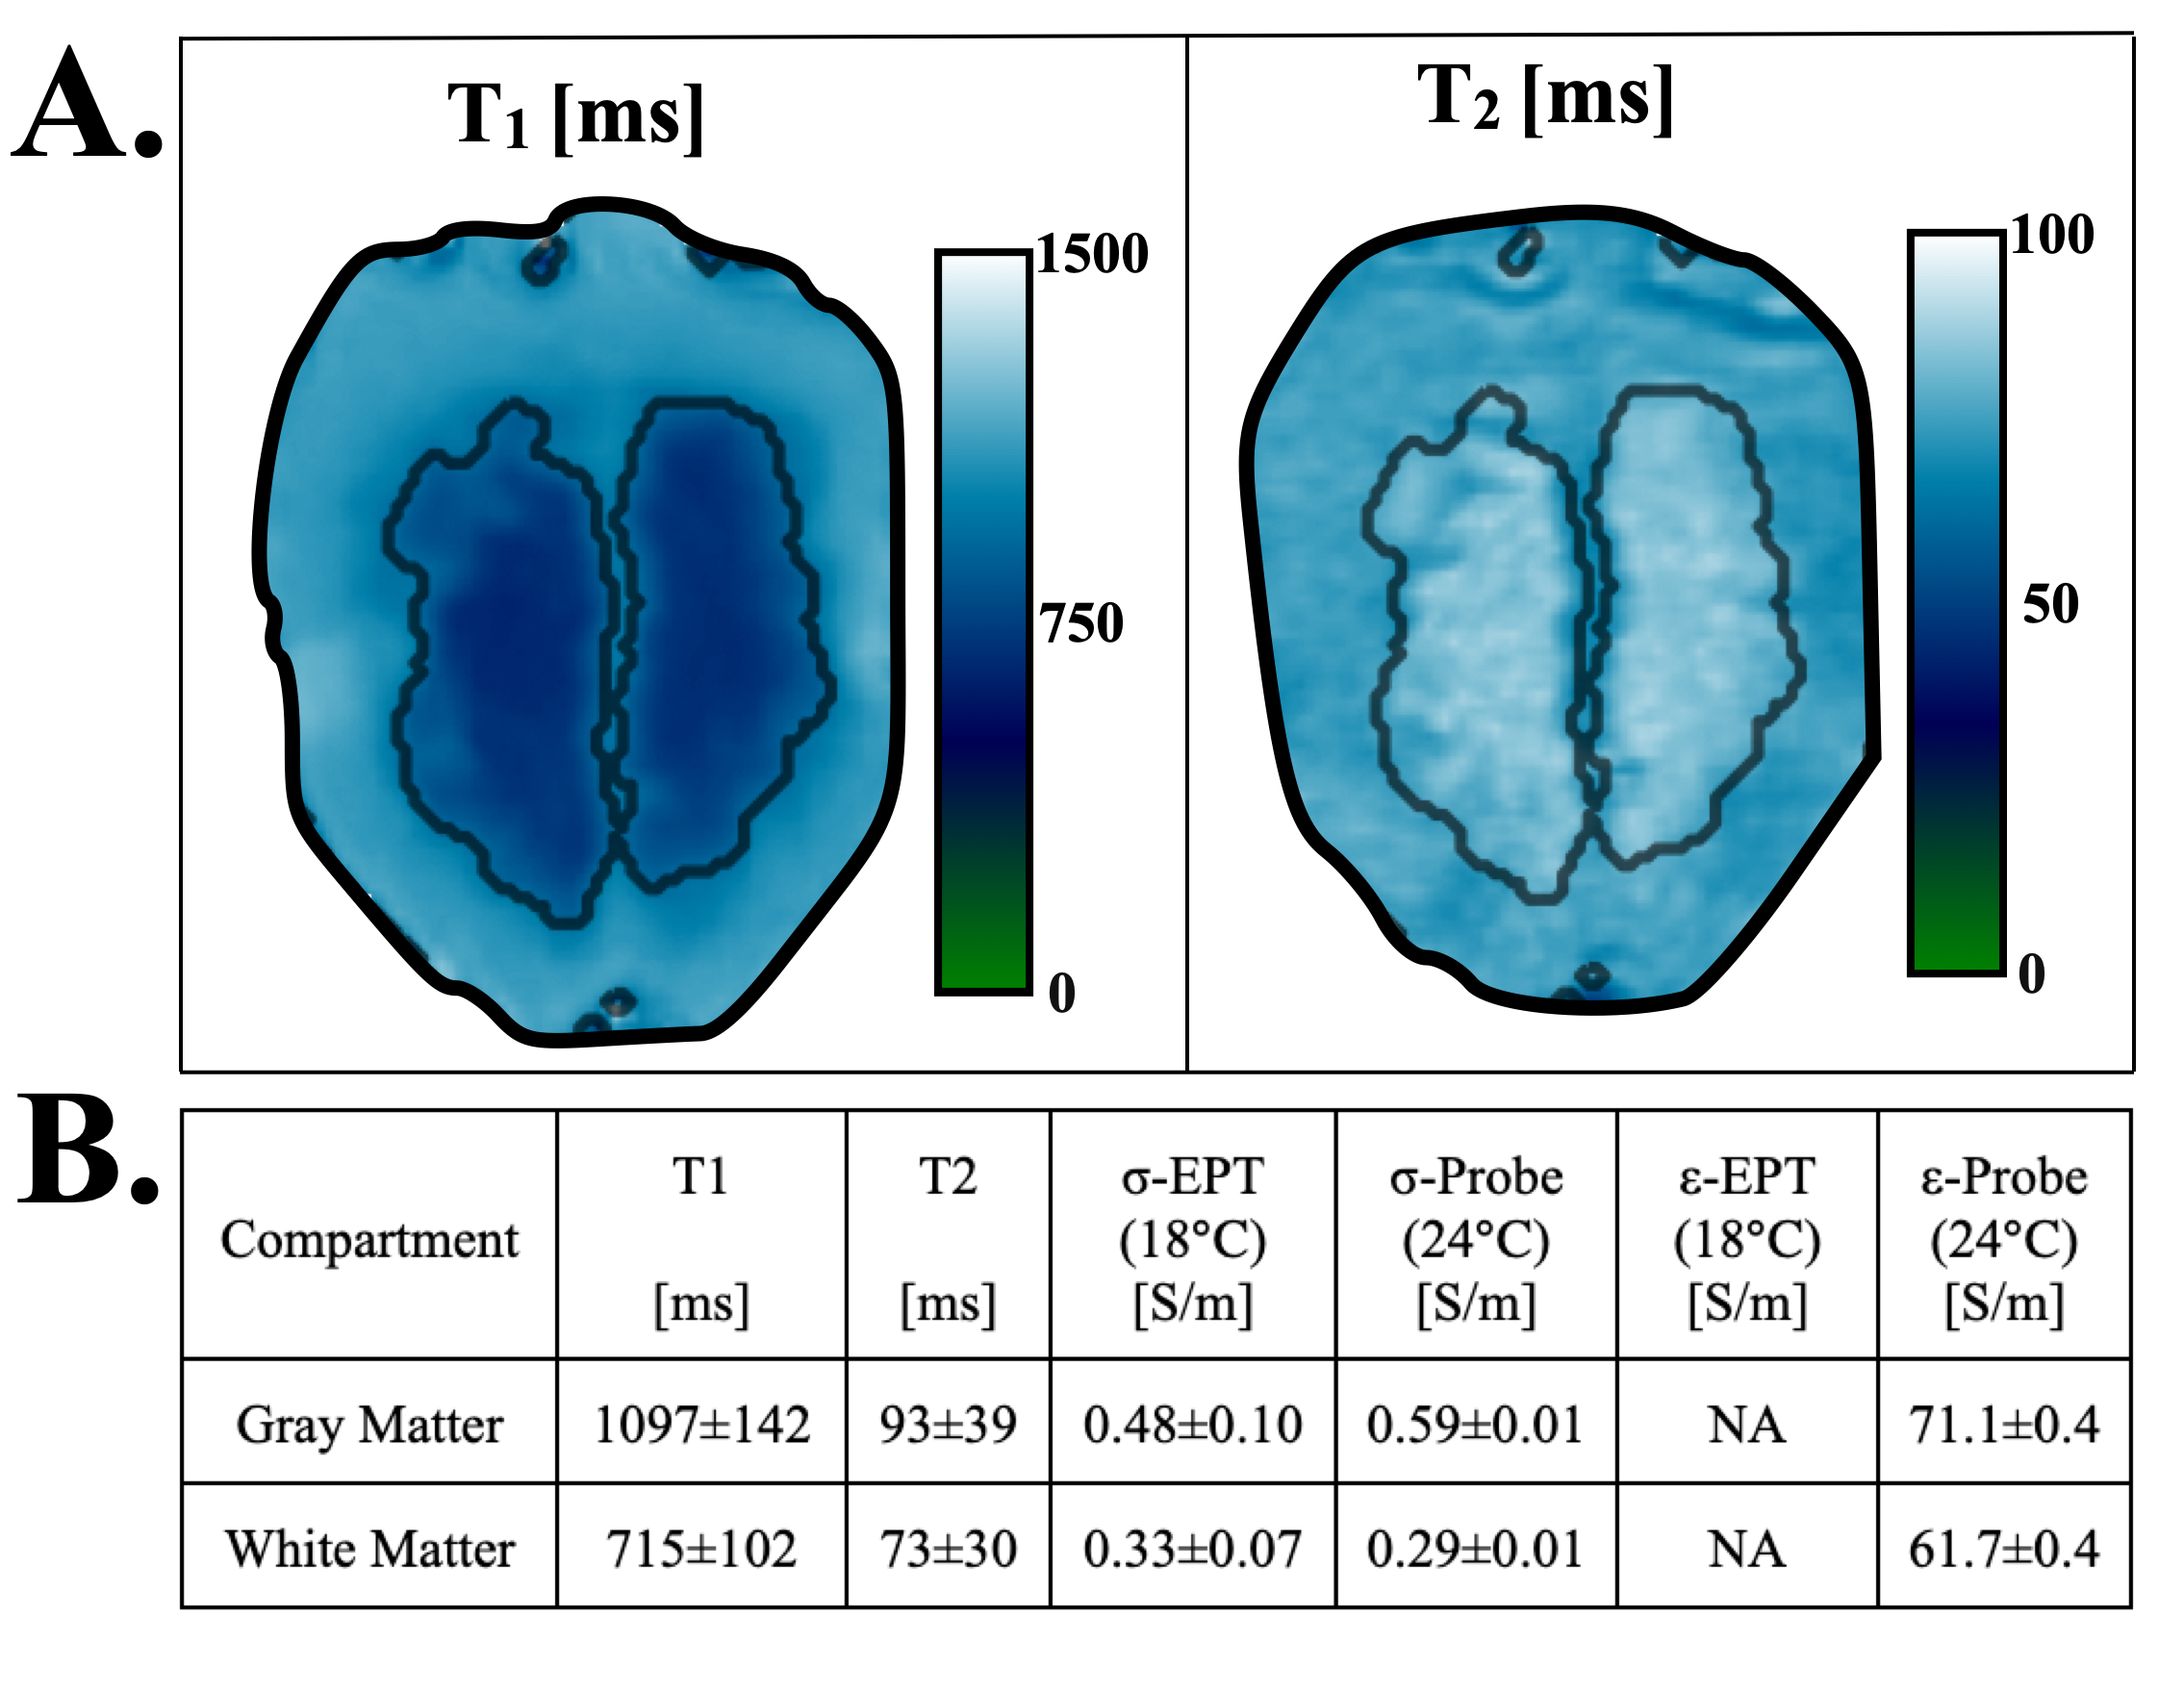
The data acquisition time was 04:00 min and the SAR estimation time was 01:12 min (1.2 GHz quad-core, 8 GB RAM).Phantom T1 and T2 maps are shown in Fig. 2-A. The maps highlight a clear distinction between the WM and GM compartments. Mean T1, T2, σ, and ε values are summarized in Fig. 2-B. The EPT-based σ differed by 0.1 S/m from the probe-based σ. Overall, σ, ε, T1, and T2 values were in the range of healthy GM and WM values5-7.
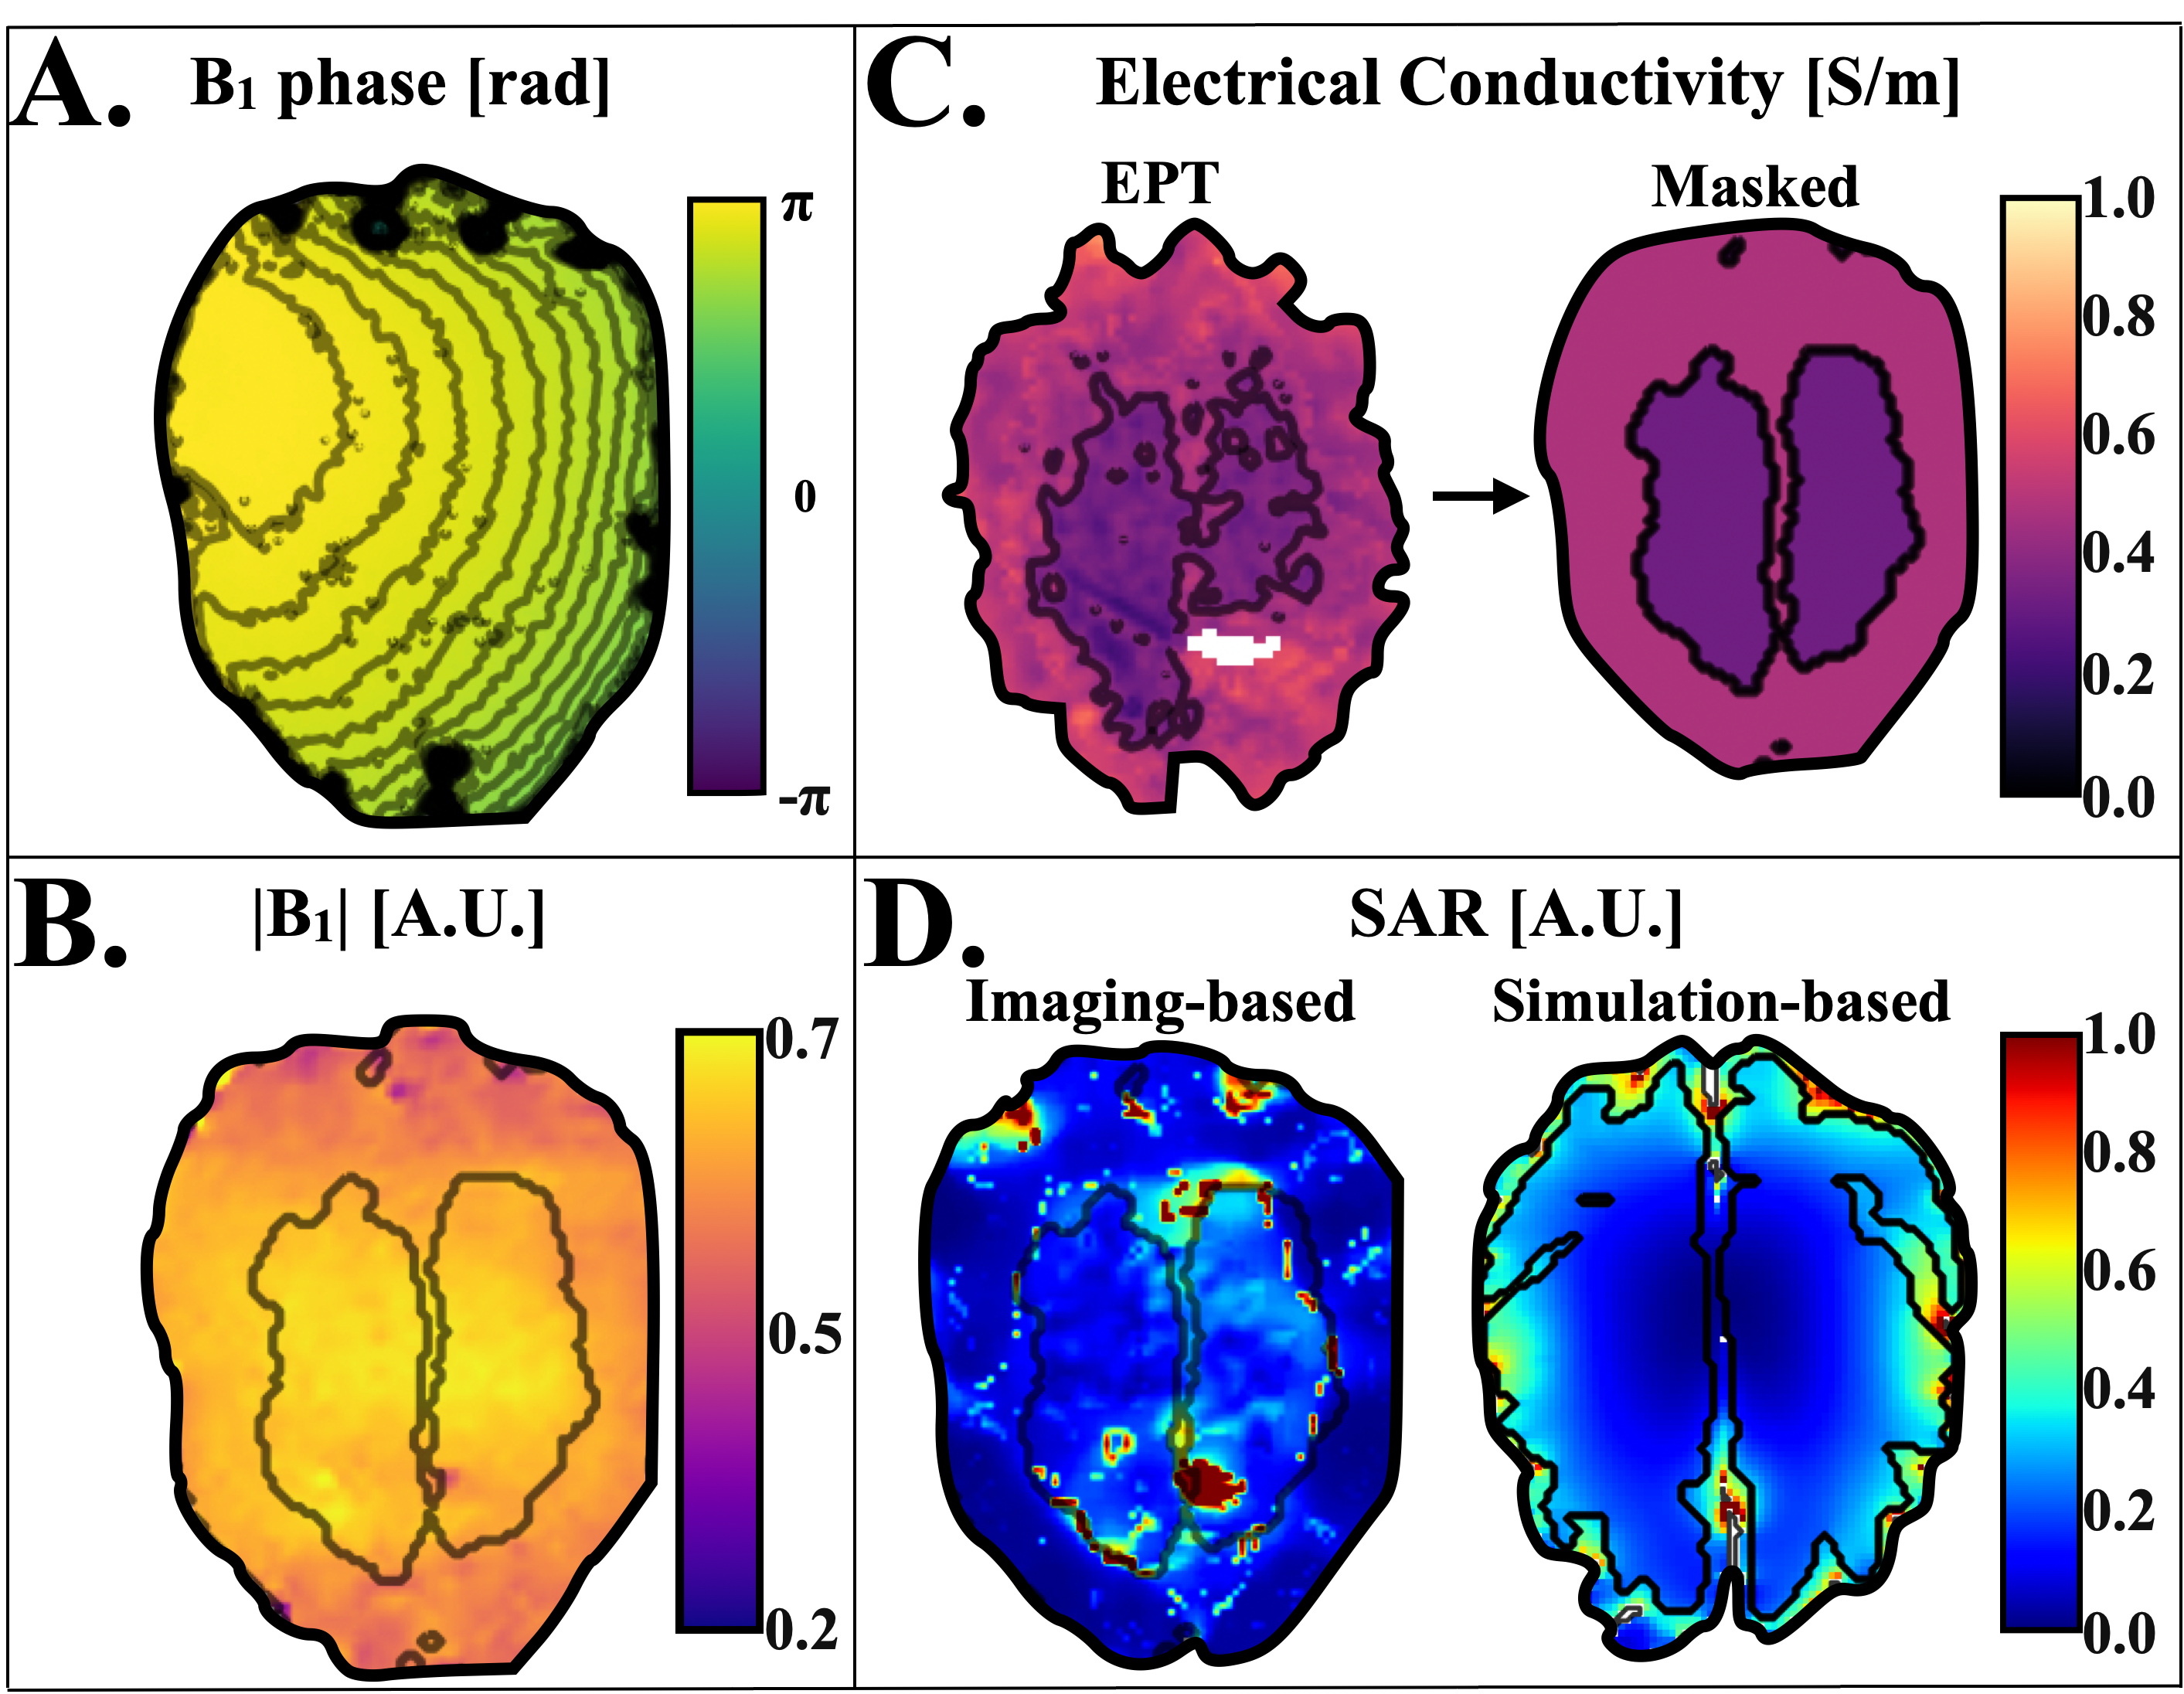
Figure 3 shows the B1+ phase (Fig 3-A), the B1+ magnitude (Fig 3-B), the electrical properties before and after masking (Fig 3-C), and the estimated imaging-based and simulation-based SAR maps derived from the whole B1-field (Fig 3-D). The results suggest the feasibility to perform EPT and SAR analyses with the realistic phantom. The imaging-based SAR maps follow the same distribution as the simulation-based SAR maps. Although susceptibility artifacts affected the reconstructions, it was possible to obtain imaging-based subject-specific SAR maps during MRI exams under 06:00 min.
Conclusions
The proposed phantom allows a controlled estimation of GM and WM electrical and relaxation properties during MRI examinations. Using the phantom, imaging-based SAR maps were obtained in less than 6 minutes. Further work will include numerical simulations of the heterogeneous brain phantom to validate the imaging-based SAR maps. In addition, the sequence acquisition protocol will be optimized to improve image quality and scan time.Acknowledgements
The results here presented have been developed in the framework of the 18HLT05 QUIERO project. This project has received funding from the EMPIR programme co-financed by the Participating States and from the European Union’s Horizon 2020 research and innovation programme.References
1. Troia A, Zanovello U, Zilberti L, Cencini M, Tosetti M, Kilian D, Capozza M, Kilian W, Gezer T. En route to multiphasic anthropomorphic MR phantoms: A new mold-based approach applying gel-based preparation to real MR-datasets geometries, ISMRM & SMRT Virtual Conference, 15-20 May 2021.
2. Katscher U, van den Berg CAT. Electric properties tomography: Biochemical, physical and technical background, evaluation and clinical applications. NMR Biomed. 2017;30(8).
3. Robinson SD, Bredies K, Khabipova D, Dymerska B, Marques JP, Schweser F. An illustrated comparison of processing methods for MR phase imaging and QSM: combining array coil signals and phase unwrapping. NMR in Biomedicine. 2017 Apr;30(4):e3601.
4. A. Arduino. “EPTlib: An Open-Source Extensible Collection of Electric Properties Tomography Techniques”. Appl. Sci. DOI: 10.3390/app11073237.
5. Hasgall PA, Di Gennaro F, Baumgartner C, Neufeld E, Lloyd B, Gosselin MC, Payne D, Klingenböck A, Kuster N, “IT’IS Database for thermal and electromagnetic parameters of biological tissues”. itis.swiss/database.
6. Dieringer MA, Deimling M, Santoro D, Wuerfel J, Madai VI, Sobesky J, von Knobelsdorff-Brenkenhoff F, Schulz-Menger J, Niendorf T. Rapid parametric mapping of the longitudinal relaxation time T1 using two-dimensional variable flip angle magnetic resonance imaging at 1.5 Tesla, 3 Tesla, and 7 Tesla. PLoS One. 2014 Mar 12;9(3):e91318.
7. Wansapura JP, Holland SK, Dunn RS, Ball WS Jr. NMR relaxation times in the human brain at 3.0 tesla. J Magn Reson Imaging. 1999;9(4):531-538.
Figures