5226
Assessing Scanner Changes after Major Repairs using Traceable Phantoms from the NIST/NIBIB Lending Library1NIST, Boulder, CO, United States, 2Intermountain Neuroimaging Consortium, University of Colorado, Boulder, CO, United States
Synopsis
Keywords: System Imperfections: Measurement & Correction, Quantitative Imaging
We demonstrate the utility of periodic use of standard phantoms to assess changes in MRI scanner performance after unexpected major repairs. We present characterization of a 3T scanner before and after an unexpected gradient failure and replacement using a traceable system phantom and an isotropic diffusion phantom from the NIST/NIBIB Medical Phantom Lending Library. No major changes were observed in gradient calibration, geometric distortion, imaging uniformity, and resolution. Post-repair improvements were noted in SNR, relaxation time, water diffusivity measurements, although both pre and post-repair data were acceptable.
Introduction
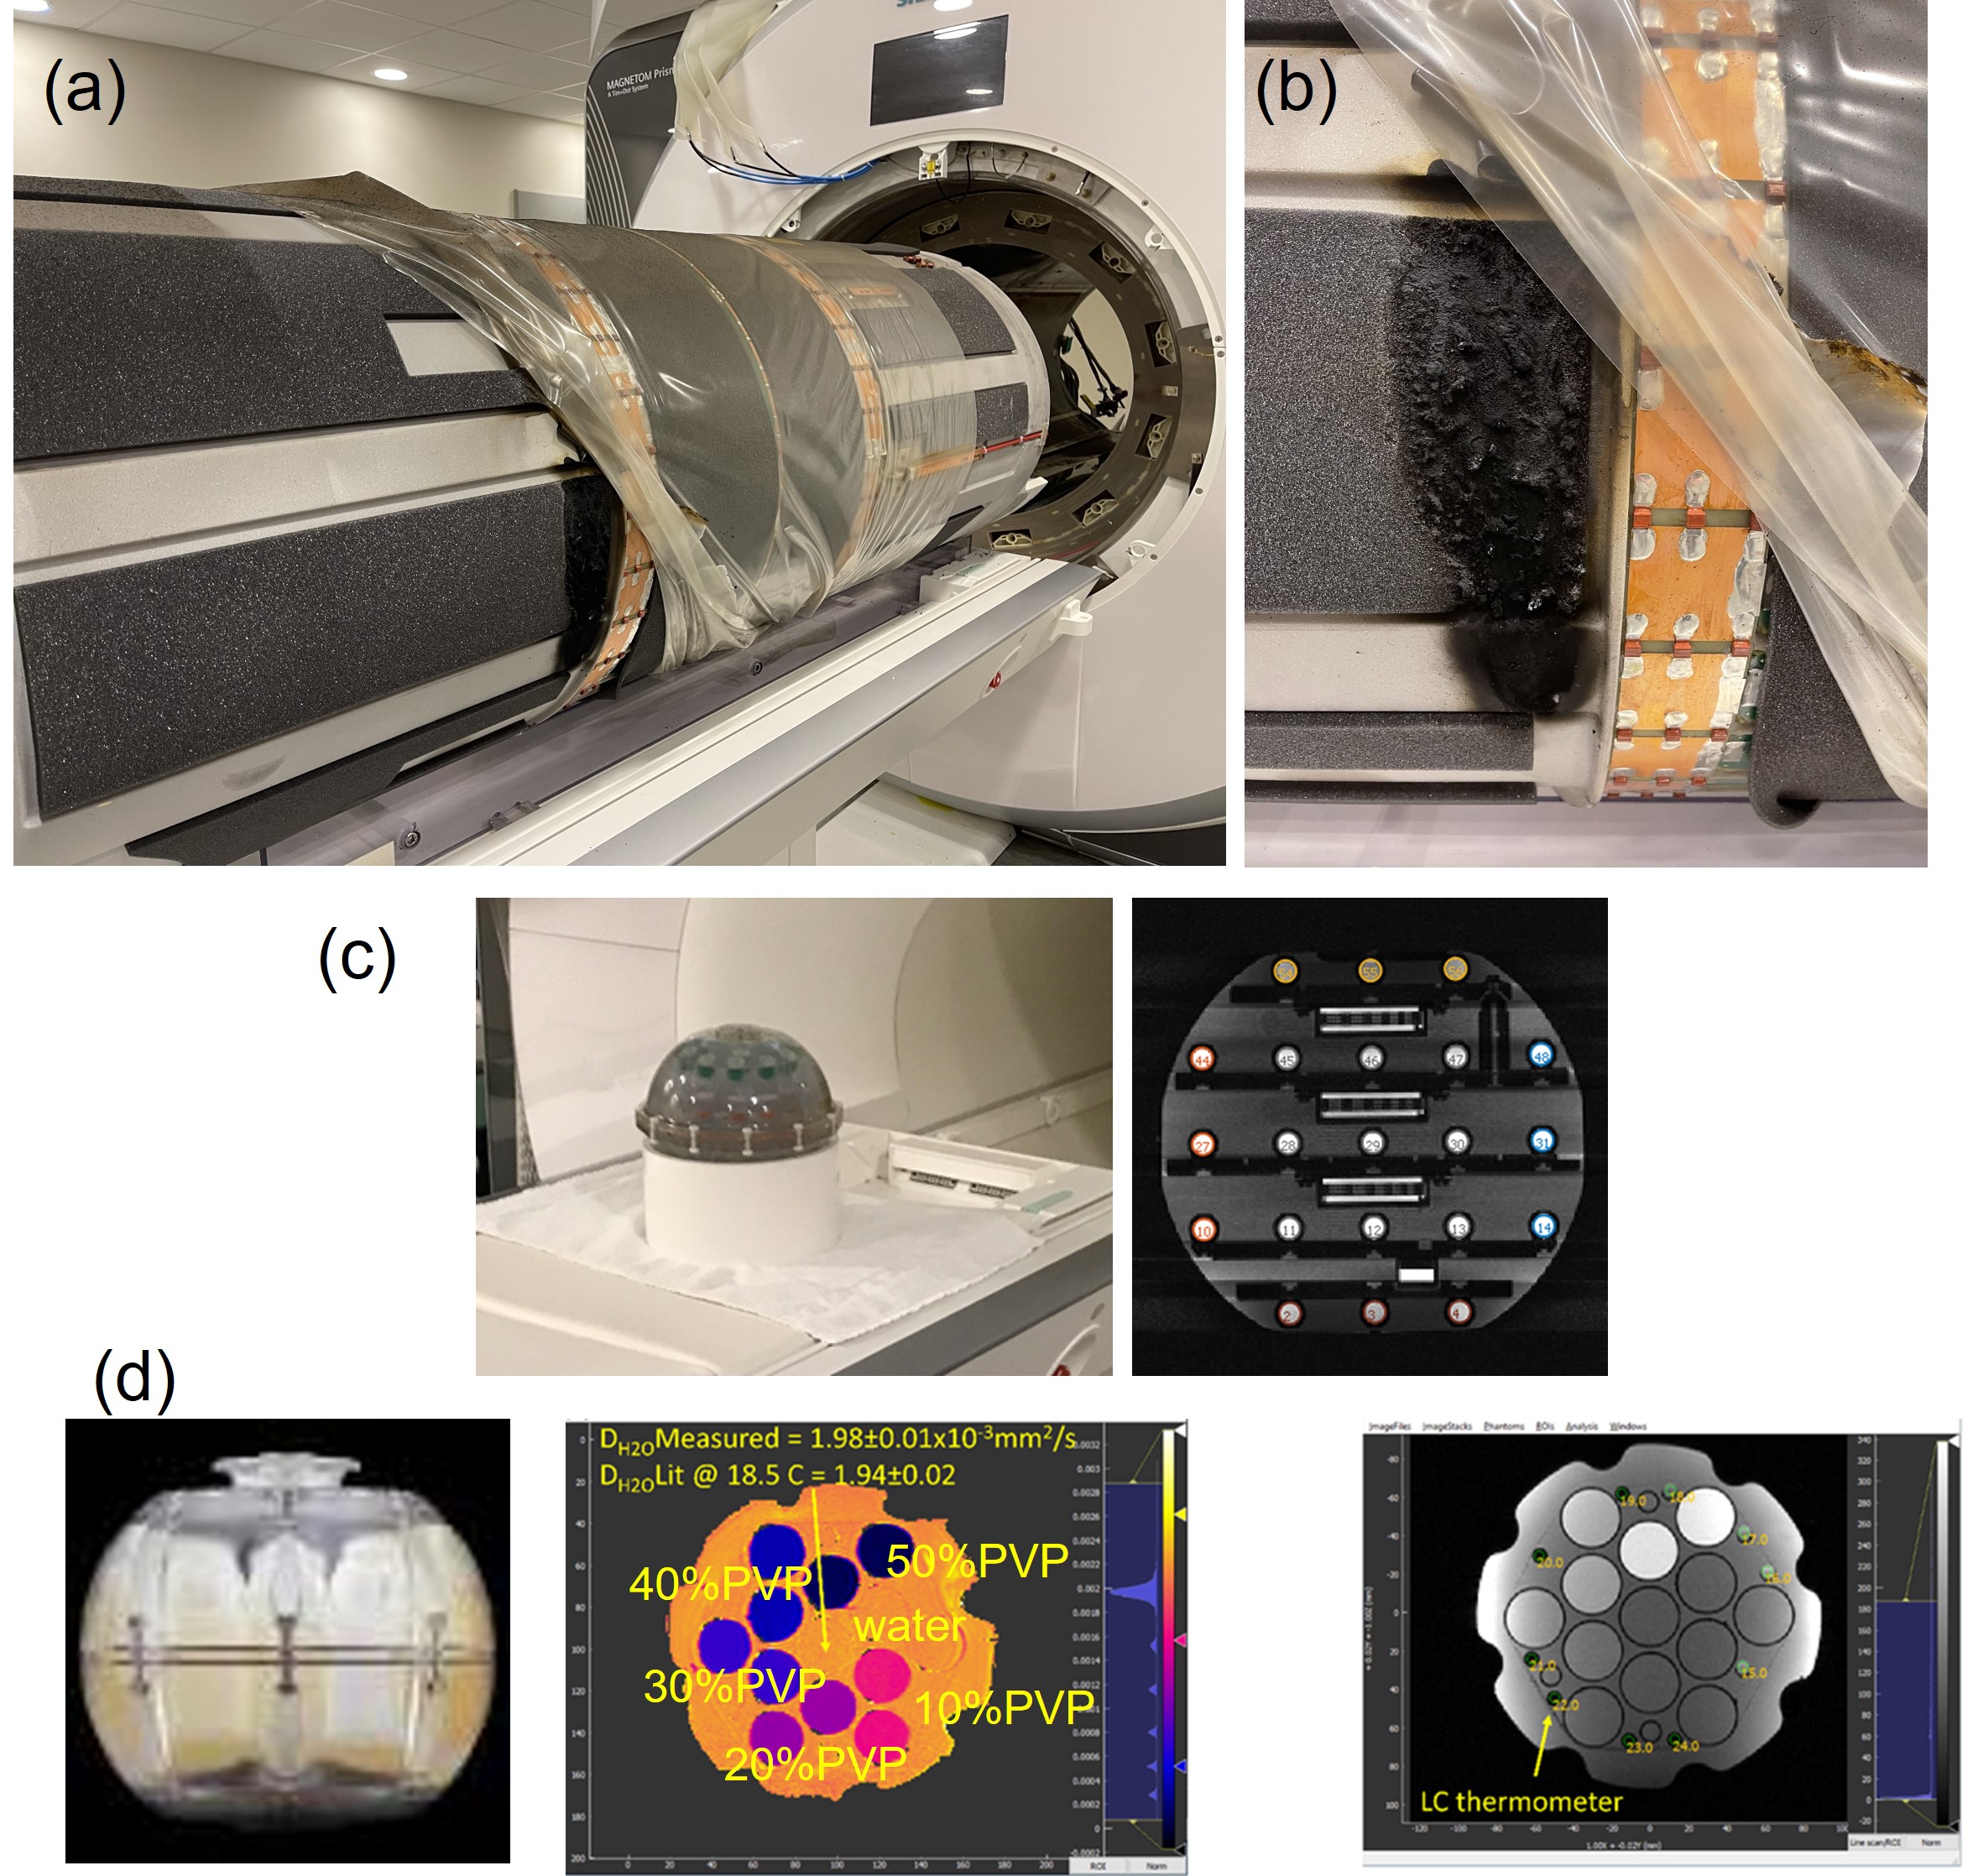
MRI scanners are relied on to produce consistent longitudinal data for clinical and research applications. Unexpected scanner failures and changes can jeopardize the integrity of research and clinical studies. Methods to document changes in scanner performance, either improvement or degradation, with open and independent validation are important for the continued reliability of image-based data. The NIST/NIBIB lending library1 provides a convenient source of phantoms that can be used to periodically assess and document scanner performance. The phantoms address a wide variety of measurements and range from objects that have traceable properties to those that are just a common reference object. Here, we look at changes due to an unexpected gradient failure, (Fig.1a,b), which required the magnet to be ramped down, new gradients and RF coils installed, and the scanner re-shimmed with new calibrations such as eddy-current-corrections. The site had routinely imaged the ISMRM system phantom2, the NIH/RSNA diffusion phantom3, as well as an fBIRN phantom4 required for ongoing studies. The analysis was similar to that done at the same site when a major upgrade was scheduled5, though in the present case the study was ad-hoc due to the unanticipated failure and used a more extensive analysis of the system phantom. The site has several on-going long-term studies including a component of the 10-year Adolescent Brain Cognitive Development (ABCD) Study, the largest study of brain development and child health in the US, now in year 5.Methods
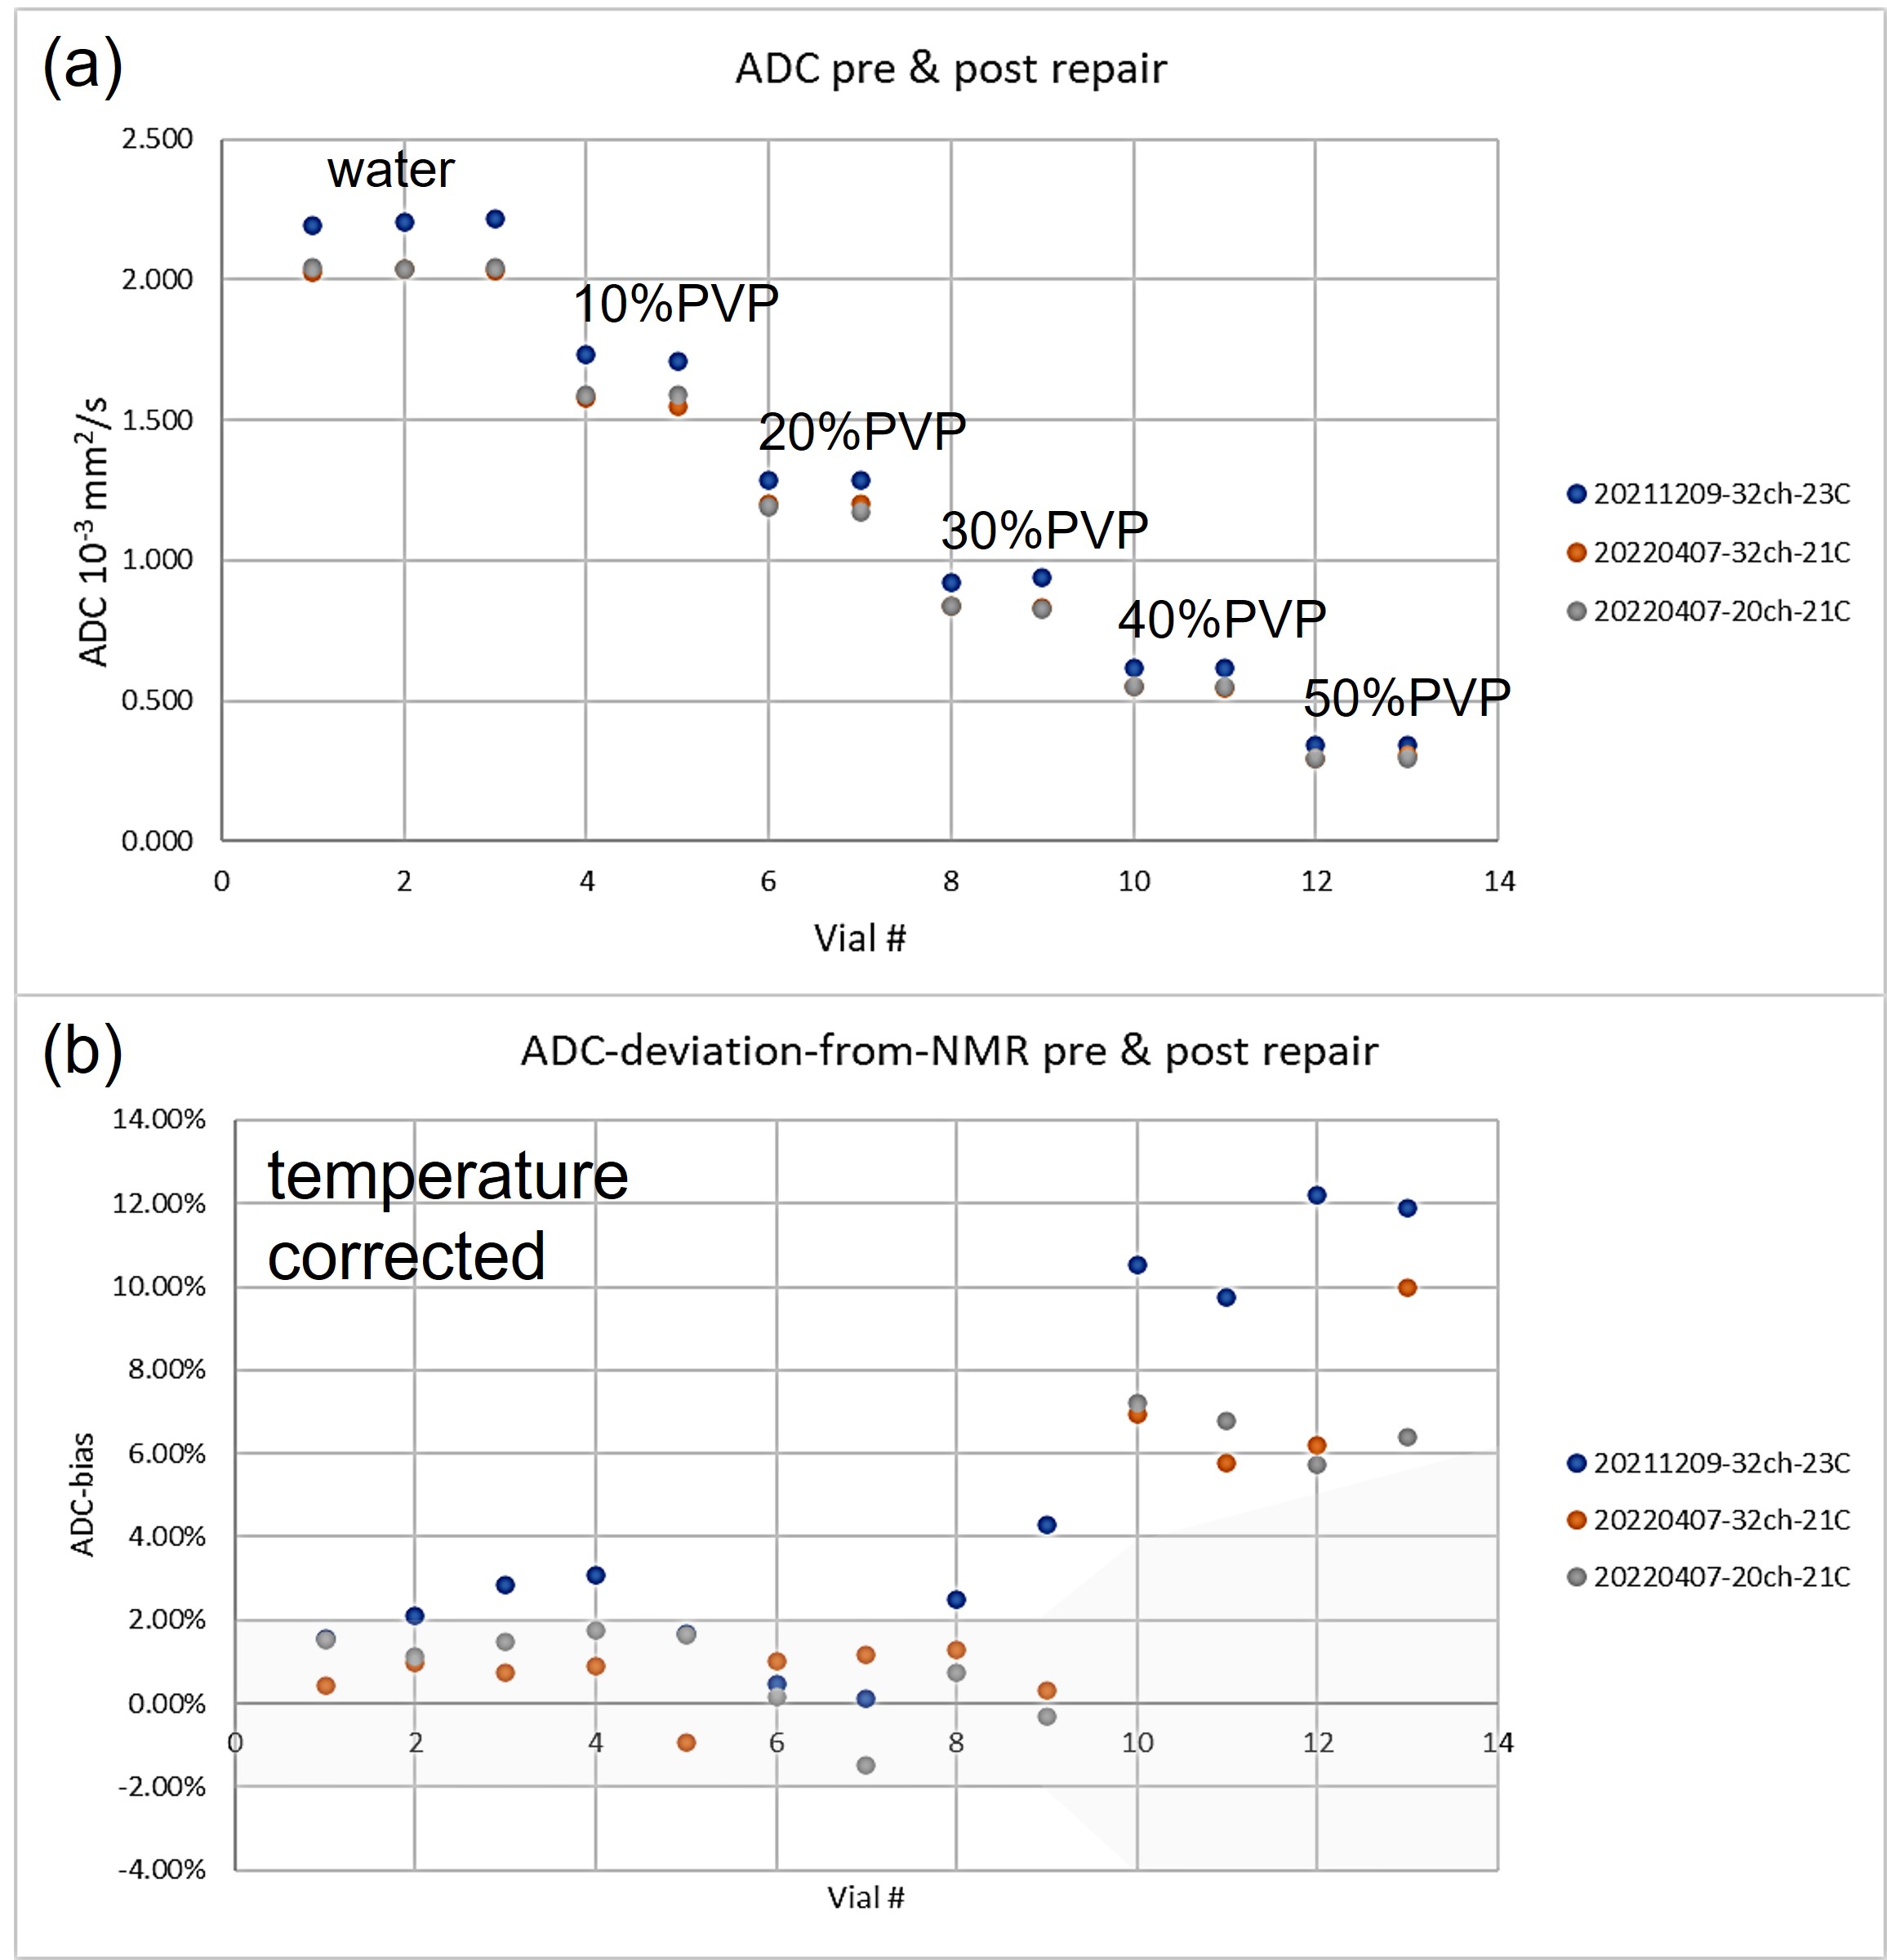
The system phantom was scanned using the body coil (Fig.1c). The 56-element fiducial array was used to assess image uniformity and geometric distortion, while the 14-element NiCl2 doped-water array was used for relaxation time measurements. The diffusion phantom, which consists of 13 vials with 6 different polyvinyl pyrrolidone (PVP) concentrations (Fig.1d), was imaged using both 20-channel and 32-channel head coils to measure the apparent diffusion coefficient (ADC) of water in the polymer solutions. These measurands were chosen since they are the most likely to highlight significant changes in the gradients, body coil, and associated calibrations. Both phantoms included MRI-readable thermometers, which were essential since phantom temperatures varied by 3°C. An fBIRN phantom, a simple spherical gel structure, was imaged with a 32-channel head coil and the data sent to a common processing site for the ABDC study6, with a “pass/fail” grade returned. The imaging and analysis protocols2,3 were the same for pre and post-repair. The image uniformity and geometric distortion data are taken from isotropic 3d gradient echo scan with 1mm voxels reconstructed with and without gradient nonlinearity corrections. The T1 and T2 scans were obtained from inversion-recovery and multi-spin-echo sequences, respectively. The diffusion scans used 4 b-value (0,500,1000,2000s/mm2) trace-weighted 2d EPI scans. The total scan time was 2h and image analysis time was approximately 4h using the lending library’s opensource Python code or Windows executable7. The total scan and data processing time were insignificant compared to the repair time and added little burden to the repair process.Results and Discussion
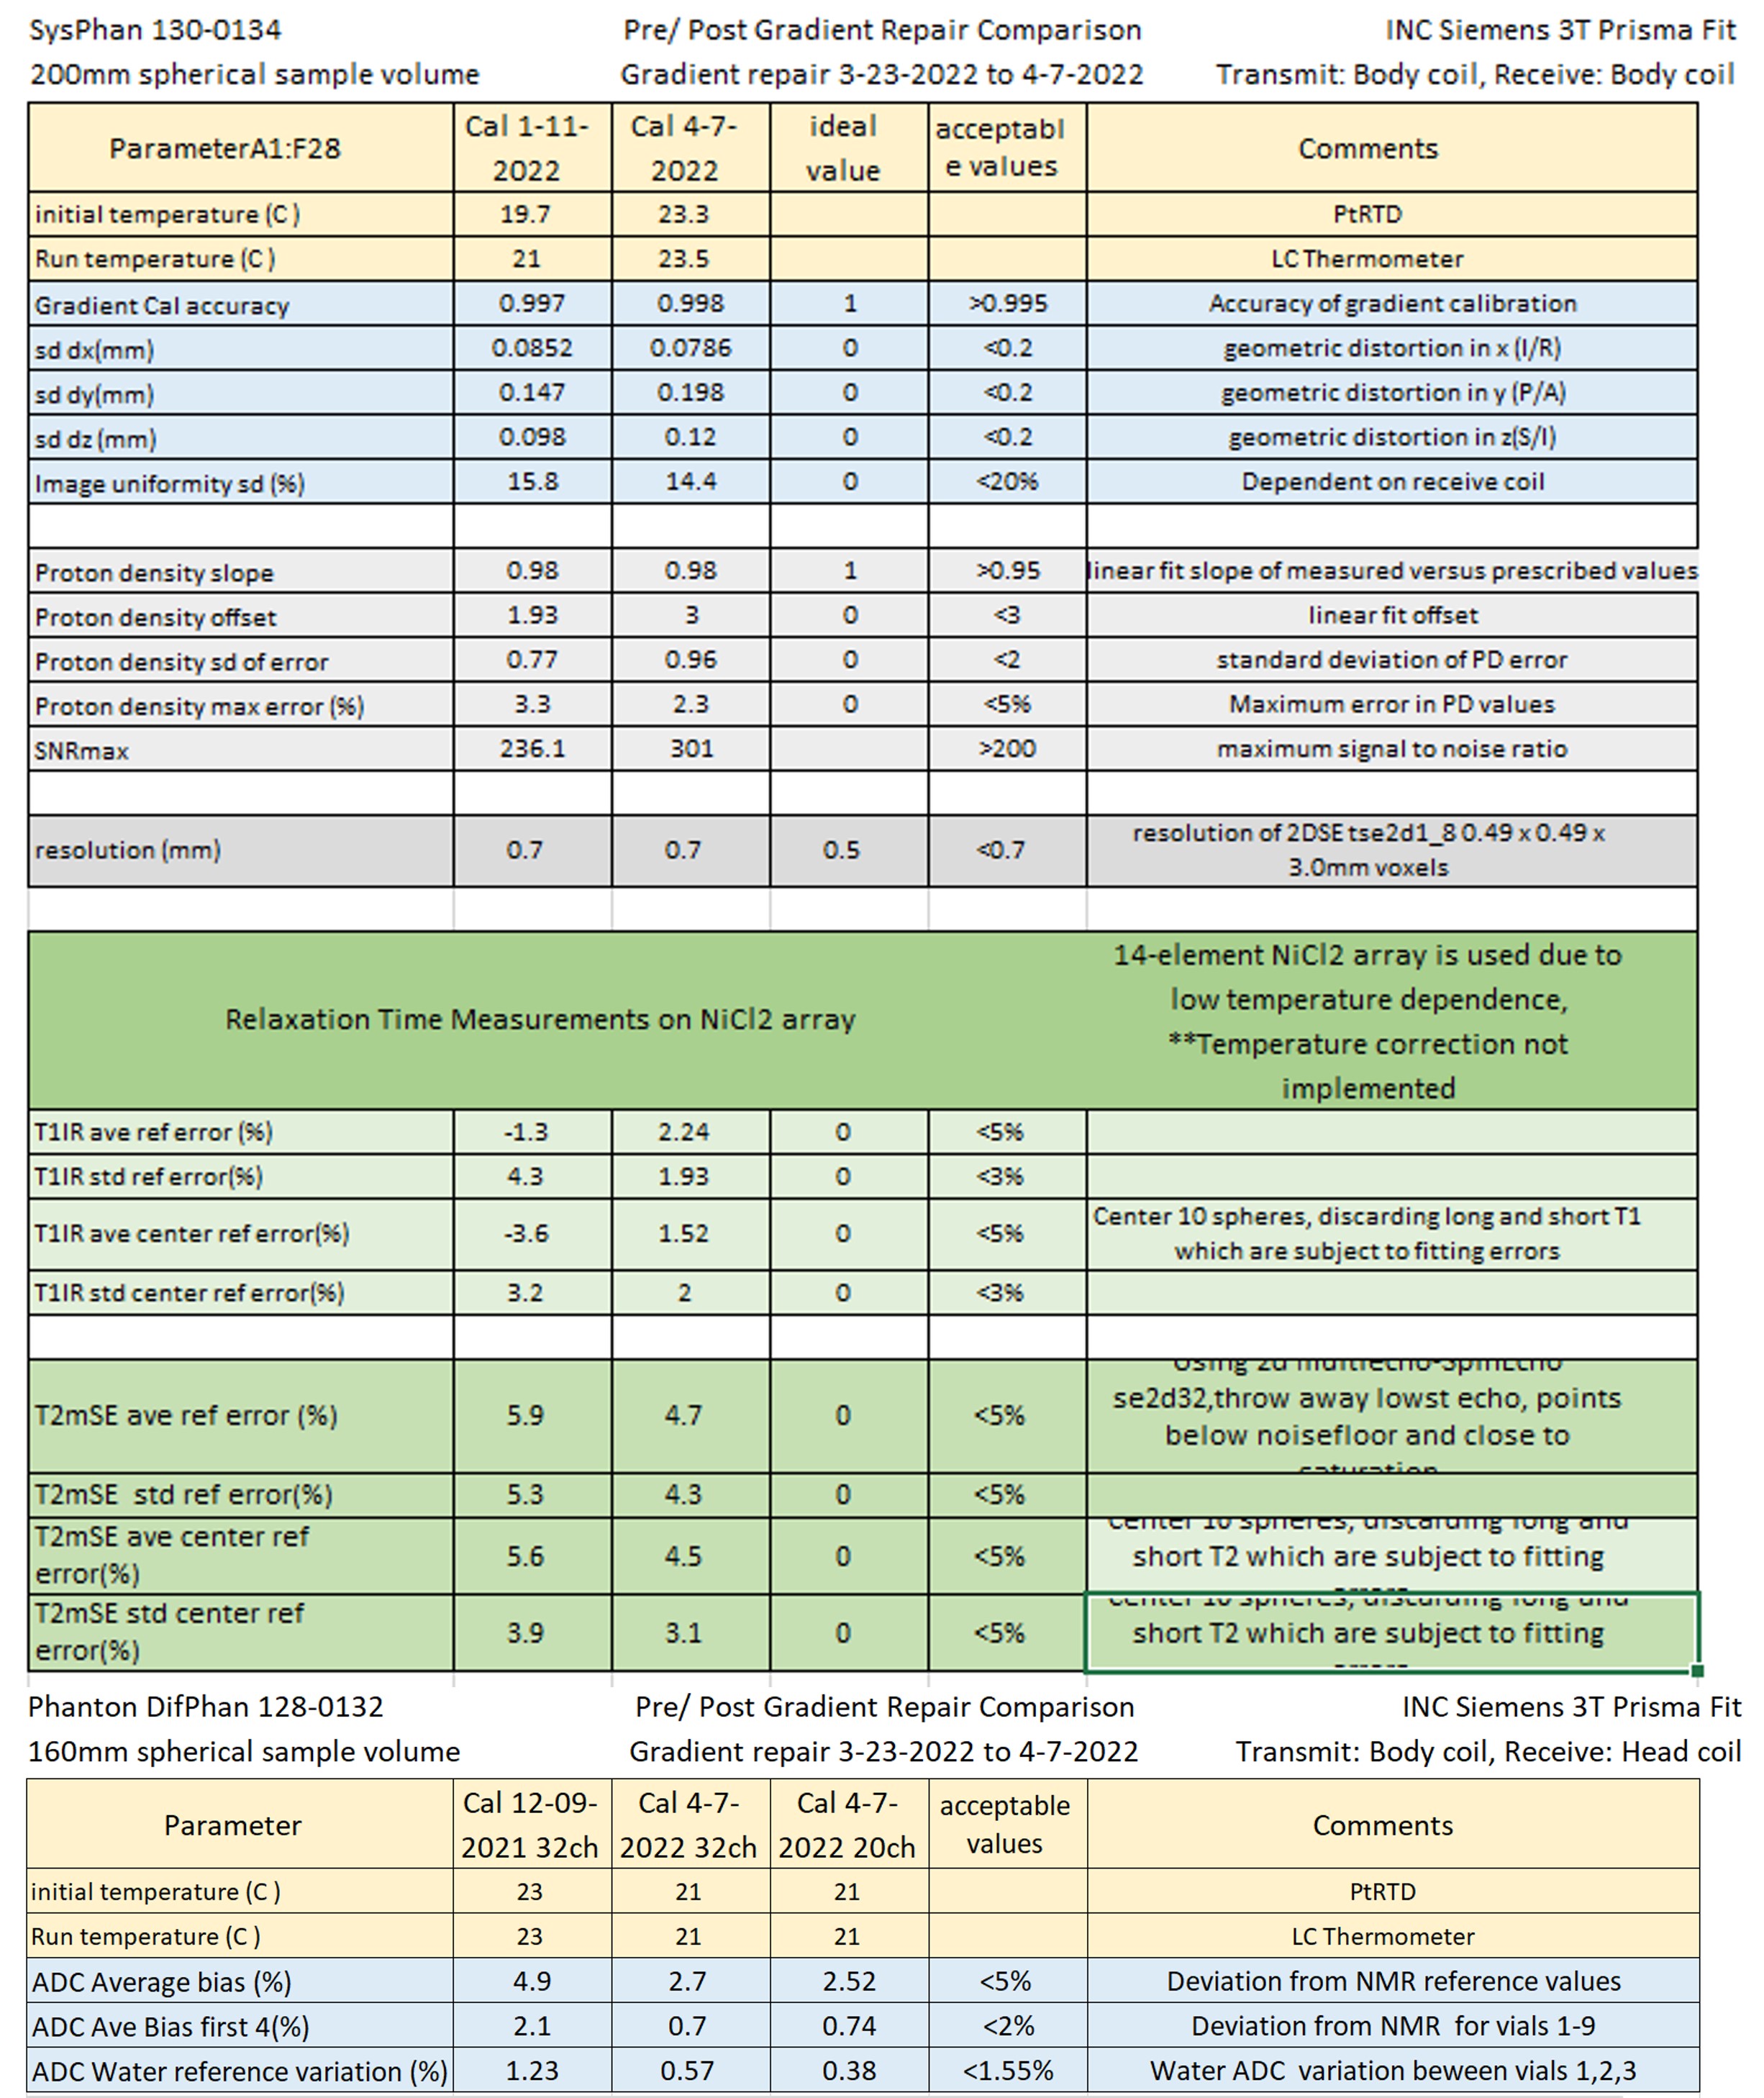
The image uniformity data, taken from the fiducial array, pre and post-repair are shown in Fig.2a,b. There is a uniform loss of signal going from the center to the periphery with very good agreement pre and post-repair throughout the phantom. Fig2.c-f shows left/right geometric distortion data, with and without corrections for nonlinear gradients. The geometric distortion with gradient corrections, before and after repair are very similar and small, with a slight improvement after the repairs. The accuracy of the fiducial sphere positions is specified at < 0.1mm. The overall gradient calibration factor was 0.997 pre-repair, and 0.998 post-repair. Fig.3 shows relaxation time measurements, plotted as a deviation from the NMR calibrated values with temperature corrections applied. For the central spheres, the standard deviation of T1 from the calibration values were 3.2% pre-repair, 2.0% post-repair. The corresponding standard deviation of T2 from the calibration values was 3.9% pre-repair, and 3.1% post-repair. Fig.4 shows the measured ADC values and temperature-corrected deviation from the calibration values from the 13 diffusion phantom vials. ADC deviation from the calibrated values was 4.9% pre-repair and 2.7% for the 32-channel head, while for the highest diffusivity samples, which have less uncertainty, the ADC deviation was 2.1% pre-repair and 0.7% post-repair for the 32-channel coil. The data from the fBIRN phantom were analyzed by the ABCD quality assurance protocol and metrics were similar post and pre-repair, both passing . A summary table of all results is shown in Fig.5.Conclusions
The phantom data showed little change in scanner performance after gradient failure and replacement. The data assisted in the decision to reinitiate study scans by providing additional verification that scanner performance had not significantly changed. The use of the phantoms and data processing is straight forward and not time consuming. As such, routine phantom imaging can provide an indication of scanner health that is critical in the event of scanner failures and repairs. There is a great deal of work remaining to understand and improve measurement repeatability to allow for better scanner monitoring. It is possible that the gradient failure may have been presaged by small changes in gradient performance that could have been detected before failure with an appropriate phantom and protocol.Acknowledgements
We acknowledge funding support from NIBIB R21-686-0010.References
1. NIST. NIST-NIBIB Medical Phantom Lending Library. Available from: https://www.nist.gov/programs-projects/nistnibib-medical-imaging-phantom-lending-library.
2. Stupic KF, Ainslie M, Boss MA, Charles C, Dienstfrey AM, Evelhoch JL, Finn P, Gimbutas Z, Gunter JL, Hill DLG, Jack CR, Jackson EF, Karaulanov T, Keenan KE, Liu G, Martin MN, Prasad PV, Rentz NS, Yuan C, Russek SE. A standard system phantom for magnetic resonance imaging. Magnetic Resonance in Medicine. 2021;n/a(n/a). doi: https://doi.org/10.1002/mrm.28779.
3. CaliberMRI. Available from: https://qmri.com/wp-content/uploads/2021/06/Diffusion-Phantom-Manual_Rev-G_web.pdf.
4. Friedman L, Glover GH. Report on a multicenter fMRI quality assurance protocol. Journal of magnetic resonance imaging : JMRI. 2006;23(6):827-39. Epub 2006/05/02. doi: 10.1002/jmri.20583. PubMed PMID: 16649196.
5. Keenan KE, Gimbutas Z, Dienstfrey A, Stupic KF. Assessing effects of scanner upgrades for clinical studies. Journal of Magnetic Resonance Imaging. 2019;0(0). doi: 10.1002/jmri.26785.
6. ABCD. Available from: https://github.com/ABCD-STUDY/FIONA-QC-PHANTOM.
7. NIST. Available from: https://github.com/MRIStandards/PhantomViewer.
Figures
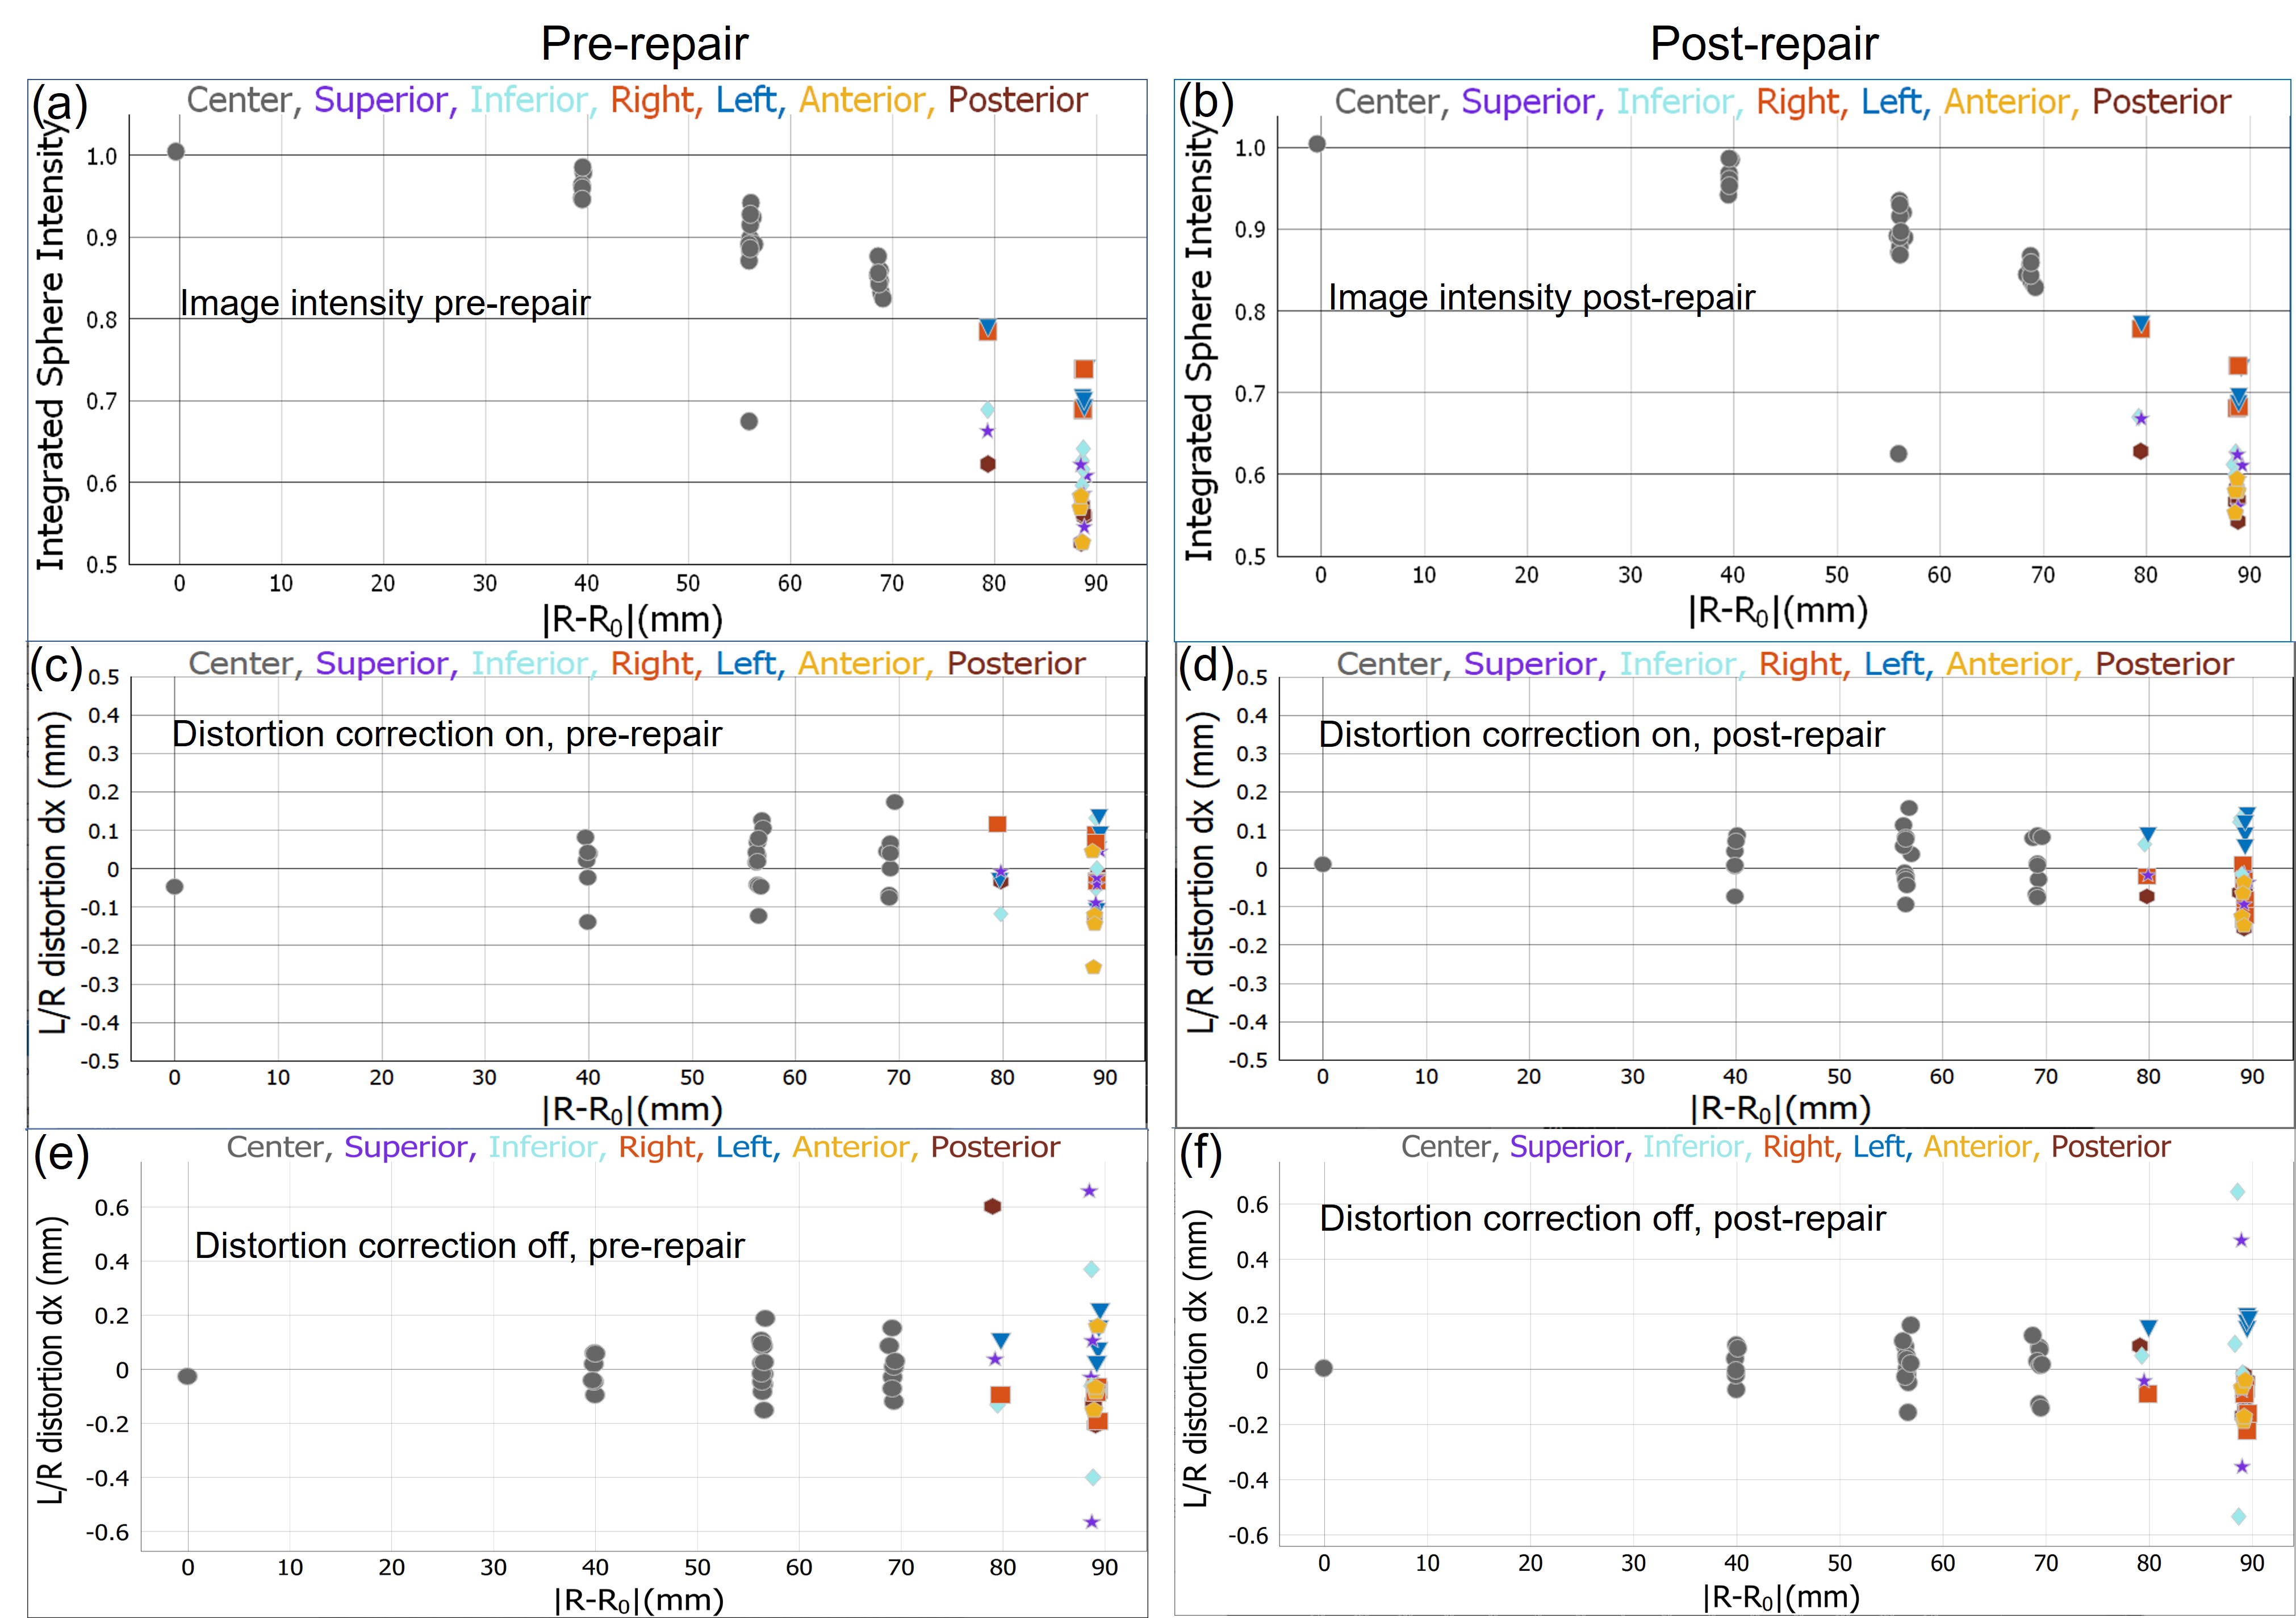
(a),(b) Normalized image intensity of the 56 fiducial spheres as a function of position from phantom center, pre and post-repair. Grey data points are the internal 27 spheres, whereas the colored data points indicate position of the 29 fiducial spheres on different phantom faces. An outlier at 57mm, is from a leaking fiducial sphere that has subsequently been replaced. (c), (d) Left/ right distortion defined as the difference in the apparent sphere center from the actual sphere center, with corrections on pre and post-repair. (e), (f) Left/ right distortion with corrections off.
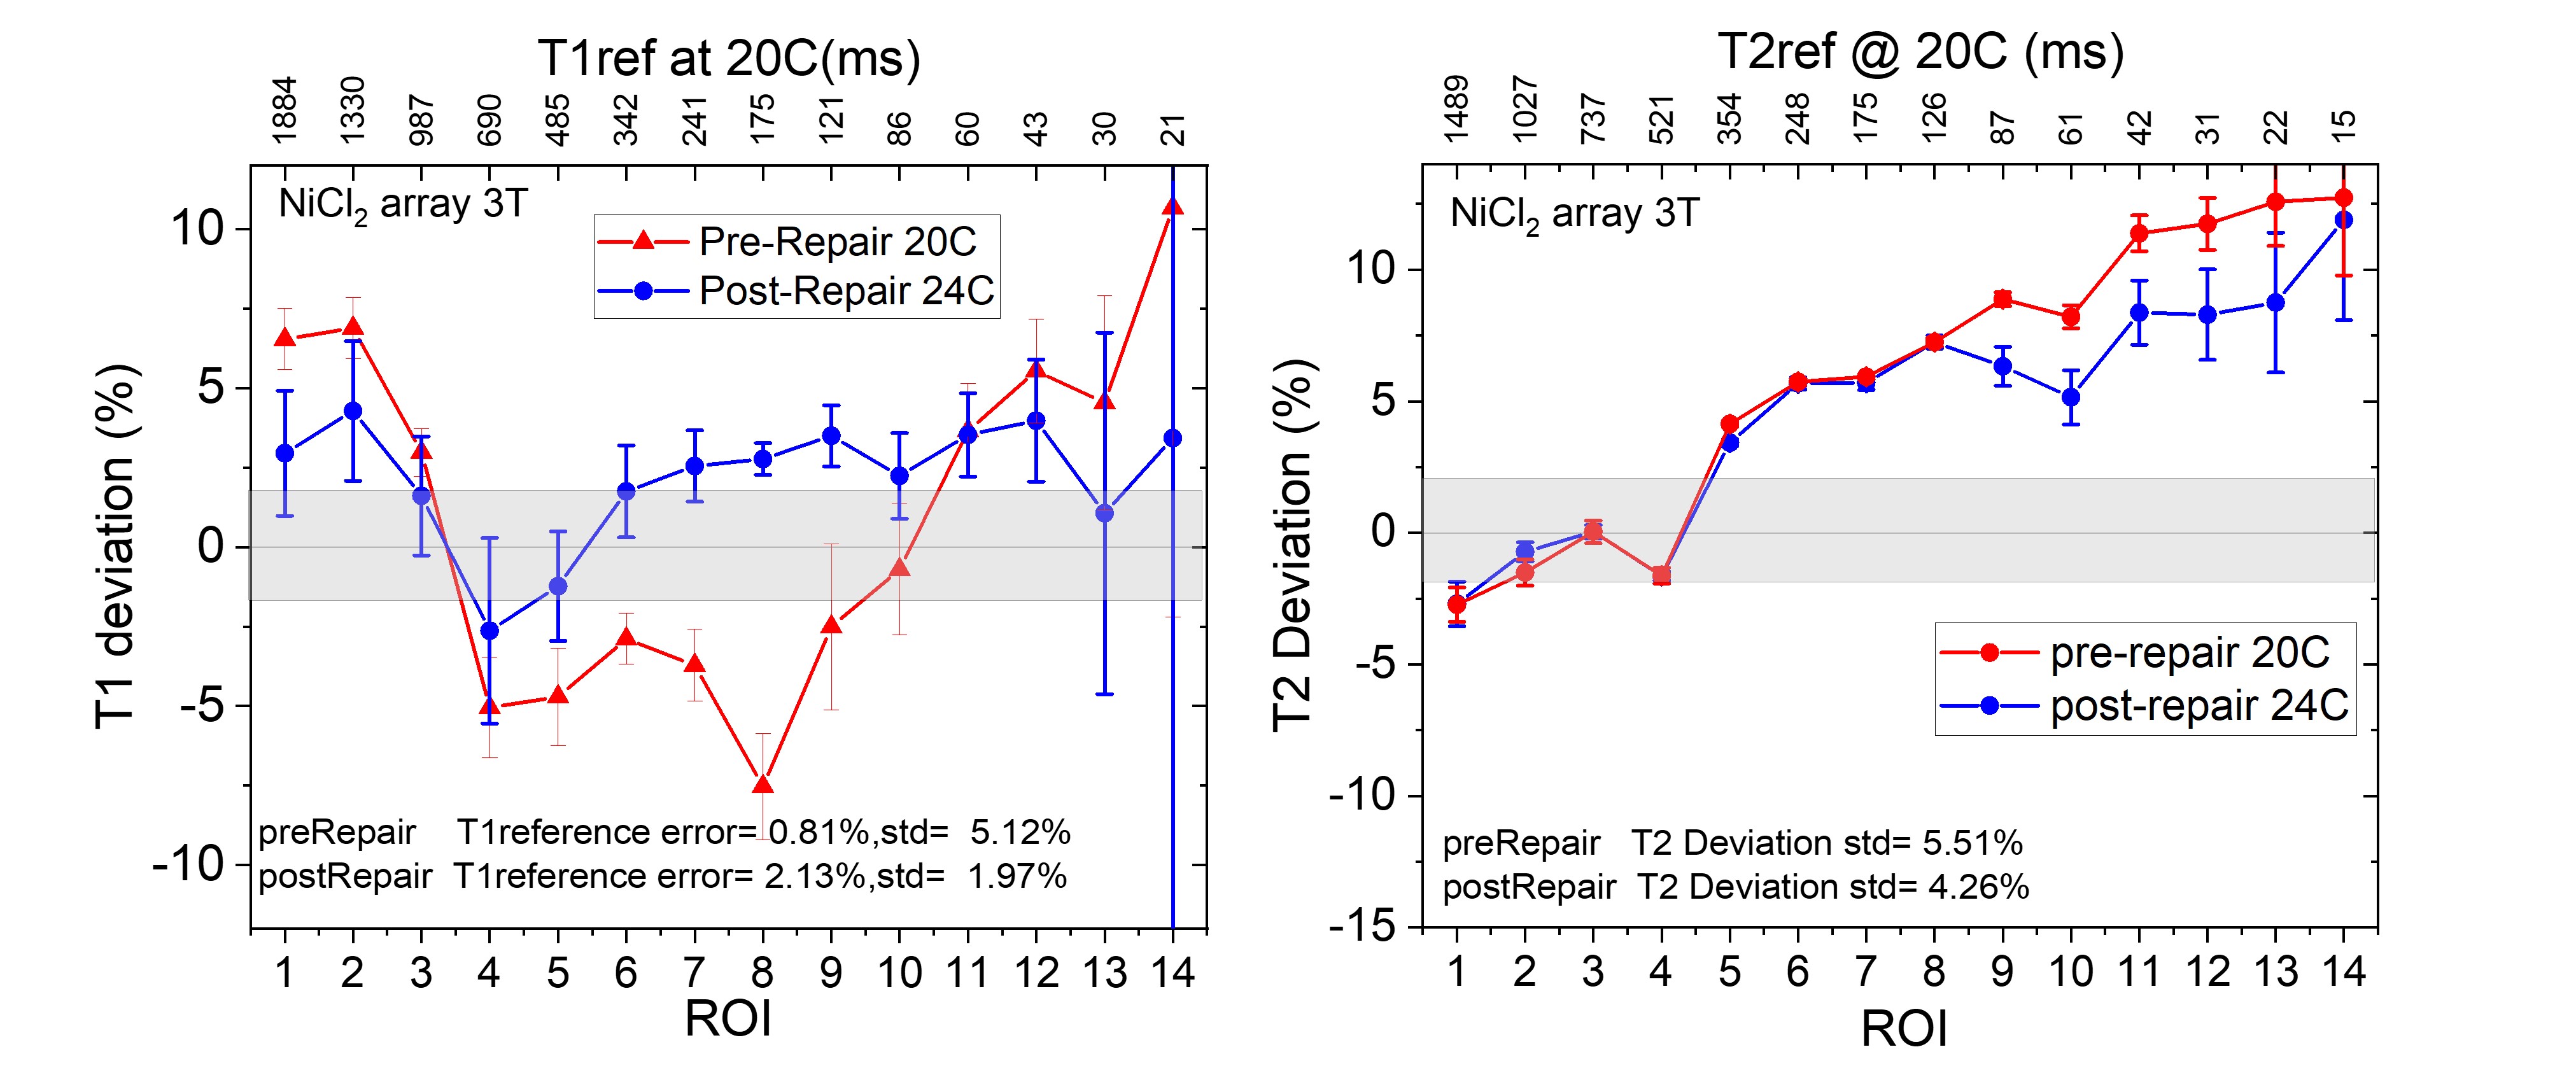
Measured T1 and T2 deviations of the 14-element NiCl2 contrast array from calibrated values, for pre and post repair imaging. The deviations are referenced to calibration values at 20C for the pre-repair data and 24C for the post-repair data. The grey regions are the calibration 3σ uncertainties and the error bars on the data are the standard errors in the fits. Errors in relaxation time measurements are very sensitive to image and analysis protocols as well as scanner imperfections and vary considerably with data selection and fitting model.