5224
A Pre-Prepared, Low-Cost, Mass-Produced Phantom Regulated by the Food Standards Agency for Assessing Imaging Characteristics within MRI
Aaron Axford1, Jordan McGing1, Catarina Rua2, Mark Symms3, Damian J Tyler1,4, and James T Grist1,4,5,6,7
1Oxford Centre for Clinical Magnetic Resonance Research, University of Oxford, Oxford, United Kingdom, 2Invicro LLC, London, United Kingdom, 3GE Healthcare, London, United Kingdom, 4Department of Physiology, Anatomy, and Genetics, University of Oxford, Oxford, United Kingdom, 5Department of Radiology, Oxford University Hospitals, Oxford, United Kingdom, 6Institute of Cancer and Genomic Sciences, University of Birmingham, Birmingham, United Kingdom, 7University of Bologna, Bologna, Italy
1Oxford Centre for Clinical Magnetic Resonance Research, University of Oxford, Oxford, United Kingdom, 2Invicro LLC, London, United Kingdom, 3GE Healthcare, London, United Kingdom, 4Department of Physiology, Anatomy, and Genetics, University of Oxford, Oxford, United Kingdom, 5Department of Radiology, Oxford University Hospitals, Oxford, United Kingdom, 6Institute of Cancer and Genomic Sciences, University of Birmingham, Birmingham, United Kingdom, 7University of Bologna, Bologna, Italy
Synopsis
Keywords: Phantoms, Relaxometry
A potential low-cost quantitative MR image assessment phantom was investigated by calculating relaxation times and the magnetization transfer ratio over multiple scans. An imaging protocol comprised of an inversion recovery sequence with varying inversion times, a spin echo with varying echo times, and an Enhanced Fast Gradient Echo 3D sequence with and without a magnetization transfer pulse, was developed and used to acquire images of the phantom, a block of store-bought jelly. The imaging data was used to calculate a T1 time of 109±1ms, a T2 time of 12.8±0.2ms, and an MTR value of 17.4±0.2%.Introduction
With the continued expansion of quantitative MR imaging, which can measure material information beneficial to diagnostic imaging1,2, methods to understand inter- and intra-system repeatability and stability are becoming essential additions to the workflow of an MR scanner. While commercial T1 and T2 relaxation phantoms are available3, and the preparation of gels, such as agar, have been extensively documented4, these options are often costly or require precise manufacturing measurements to ensure stability. This study aimed to investigate the use of store-bought packaged jelly as a potential phantom for imaging characteristics, first proposed by Rua et al5. As well as being low-cost and readily available, food goods within the United Kingdom are regulated by the Food Standards Agency (FSA), providing a level of consistency to each product. T1 and T2 relaxation times, and magnetization transfer ratios (MTRs) of the jelly phantom were calculated over multiple sessions to assess the stability of these parameters.Methods
MRI was performed on a 3T GE Signa Premier (GE Healthcare, Chicago, Illinois), using a 19 channel Head Coil with the jelly packet (Hartley’s, Histon, England) taped to a Braino sphere, as shown in Figure 1.2D inversion recovery images were acquired using inversion times (TI): 50, 60, 75, 100, 200, 250, and 500 ms. T2 was characterised using a spin echo sequence with echo times (TE): 10, 15, 20, 40, 60, and 80 ms. The following imaging parameters were used for all relaxation data acquired: Number of slices=1, acquisition matrix size = 128 x 128, reconstructed matrix size= 256 x 256, slice thickness = 5 mm, field of view (FOV) = 256 mm, and bandwidth= 122 Hz/pixel. MTR values were calculated using an Enhanced Fast Gradient Echo 3D sequence (EFGRE3D) with and without a fermi magnetization transfer pulse of duration 8 ms, offset by 1200 Hz, and a flip angle of 200°. The imaging parameters of the EFGRE3D sequence were: number of slices = 86, slice thickness = 2 mm, FOV = 256 mm, acquisition matrix size = 320 x 320, bandwidth = 244 Hz/Pixel, TI = 32 ms, and TE = 2.77 ms.Voxel-wise curve fitting was performed on the resultant relaxation data to allow the creation of T1 and T2 maps respectively of the phantom in MATLAB (2022a, MathWorks, Cambridge, MA), displayed in Figure 2. Equations 1 and 2 were used for fitting the T1 and T2 data respectively, where Mxy is the signal intensity at each voxel location, and M0 is the maximum signal. MTR values for the phantom were calculated using Equation 3, where SIMTon and SIMToff are the signal intensities with the magnetization pulse turned on and off respectively.
(Equation 1:) $$M_{xy}=\vert{a-(b\times\exp{(\frac{-TI}{T_1}}))}\vert$$
(Equation 2:) $$M_{xy}=M_0\times(\exp{(\frac{-TE}{T_2})})+c$$
(Equation 3:) $$MTR=100\times\frac{SI_{MToff}-SI_{MTon}}{SI_{MToff}}$$
For consistency in the creation of each region of interest (ROI), used to calculate the overall characteristic values, automated segmentation tools were developed in FIJI6 to create ROIs accurately around the phantom, with a uniform 3mm reduction applied to the ROIs to avoid impact from partial volume effect at the boundaries. The relaxation data was acquired in four separate sessions over the period of one month, while the MTR data was acquired during a single session with all components re-setup between scans. The same jelly phantom and MRI scanner was used for all data collection. MTR values were calculated over five slices throughout the jelly to assess any variations in results, with the data averaged to generate the final MTR %.
Results
The average T1 and T2 relaxation times calculated in this study for the jelly phantom were 109±1 ms and 12.8±0.2 ms respectively. The average MTR value for the jelly phantom was calculated as 17.4±0.2 %. While the inter-slice variation in the mean was low, larger variations in MTR values were observed within each studied slice, with an average standard deviation of 5.4. The full set of T1 and T2 times, and MTR values for each dataset is provided in Table 1.Discussion
Over the course of 1 month, the coefficient of variation for the T1 and T2 times calculated was 1.43% and 2.46% respectively. No trends were observed with the calculated relaxation times over time suggesting good phantom stability. A comparison with estimated errors from components within a commercially available characteristics phantom with similar relaxation times3 suggests jelly could be a very cost-effective phantom; however, further investigation is needed to assess inter-scanner variations, including different scanner vendors, temperature dependencies, and potential differences between manufacturer batches of jelly. MTR values also provided high consistency when comparing the average values obtained over the complete phantom; however, individual slice measurements displayed a larger variation in results. Further investigation highlighted that this was a potential result of noise, with a gaussian distribution observed around the averaged MTR value, as shown in Figure 3. Further studies are being conducted to assess the MTR stability over longer time periods.Conclusions
The calculated T1 and T2 relaxation times, and MTR % values, suggest that store-bought jelly is suitable for use as a pre-made image characteristics phantom. While further studies are still required, the current results indicate potential for the use of pre-packaged food products in quantitative MR imaging assessment.Acknowledgements
This work was supported by the National Institute for Health and Care Research, and the British Heart Foundation [Grant Number RG/F/21/110035]References
- Schawkat, K., Eshmuminov, D., Lenggenhager, D., Endhardt, K., Vrugt, B., Boss, A., Petrowsky, H., Clavien, P.A. and Reiner, C.S., 2018. Preoperative evaluation of pancreatic fibrosis and lipomatosis: correlation of magnetic resonance findings with histology using magnetization transfer imaging and multigradient echo magnetic resonance imaging. Investigative radiology, 53(12), pp.720-727.
- Tirkes, T., Lin, C., Fogel, E.L., Sherman, S.S., Wang, Q. and Sandrasegaran, K., 2017. T1 mapping for diagnosis of mild chronic pancreatitis. Journal of Magnetic Resonance Imaging, 45(4), pp.1171-1176.
- Jiang, Y., Ma, D., Keenan, K.E., Stupic, K.F., Gulani, V. and Griswold, M.A., 2017. Repeatability of magnetic resonance fingerprinting T1 and T2 estimates assessed using the ISMRM/NIST MRI system phantom.Magnetic resonance in medicine,78(4), pp.1452-1457.
- Hellerbach, A., Schuster, V., Jansen, A. and Sommer, J., 2013. MRI phantoms–are there alternatives to agar?. PloS one, 8(8), p.e70343.
- Rua, C., Symms, M.R., Ghayoor, A., Avants, B., Bishop, C. and Becerra, L., A clinical protocol for 3D imaging of the locus coeruleus with super-resolution at 3 Tesla.ISMRM 31, 2645.
- Schindelin, J., Arganda-Carreras, I., Frise, E., Kaynig, V., Longair, M., Pietzsch, T., Preibisch, S., Rueden, C., Saalfeld, S., Schmid, B. and Tinevez, J.Y., 2012. Fiji: an open-source platform for biological-image analysis. Nature methods, 9(7), pp.676-682.
Figures
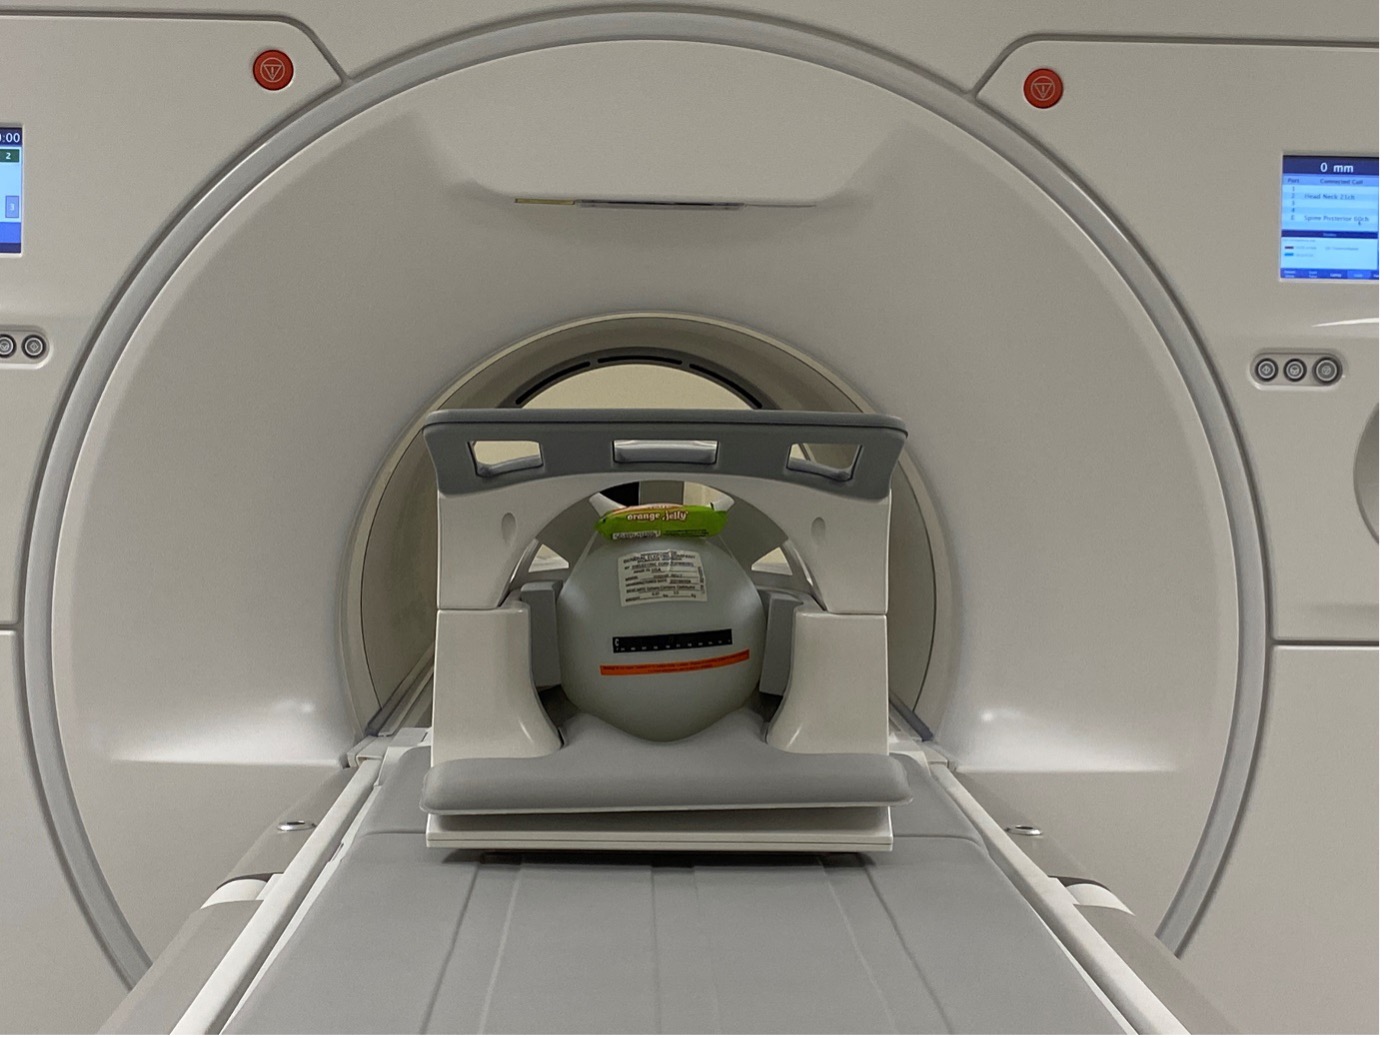
Figure 1 - The Jelly phantom positioned on a Gadobutrol Magnetic Resonance Spectroscopy sphere setup for imaging within a 3T GE Signa Premier
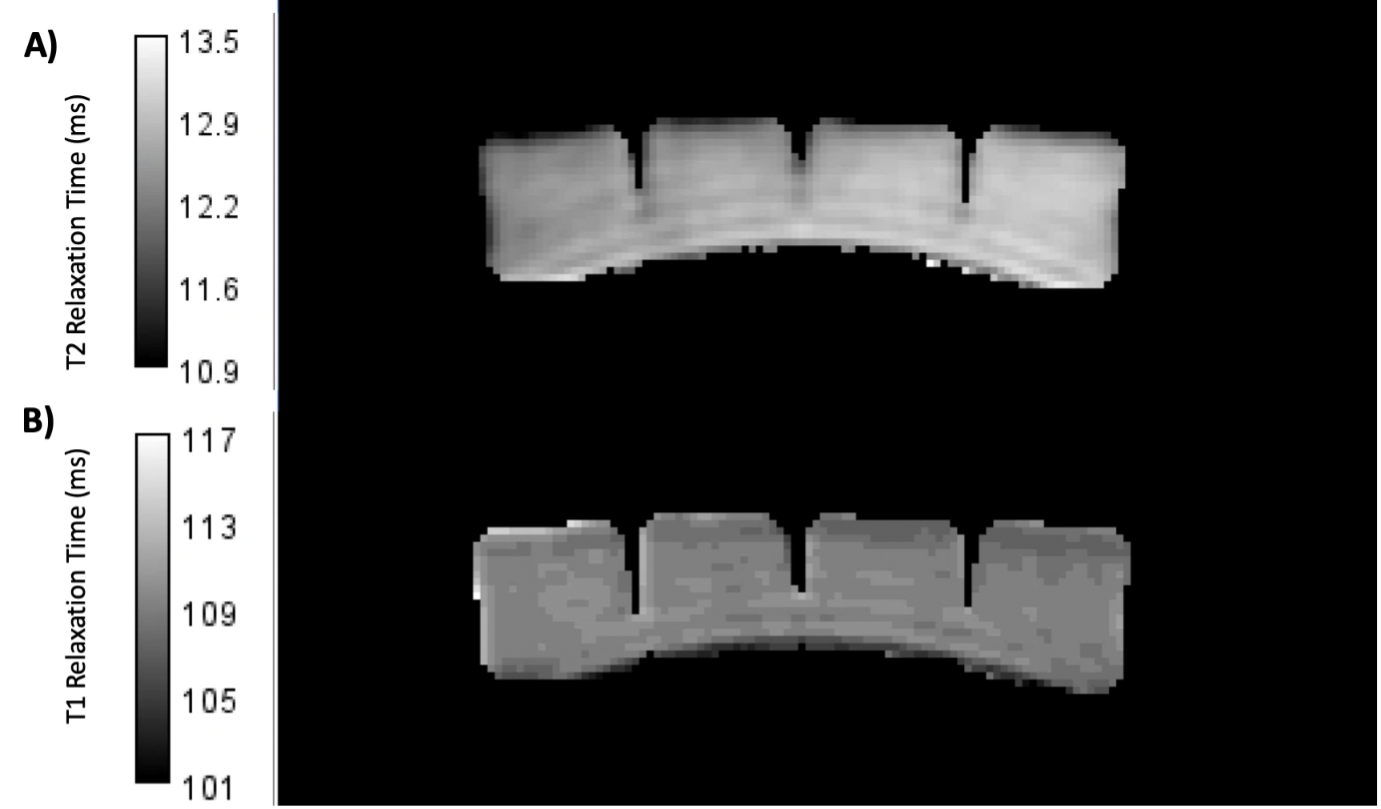
Figure 2 - T2 (A) and T1 (B) maps generated for a block of store-bought jelly
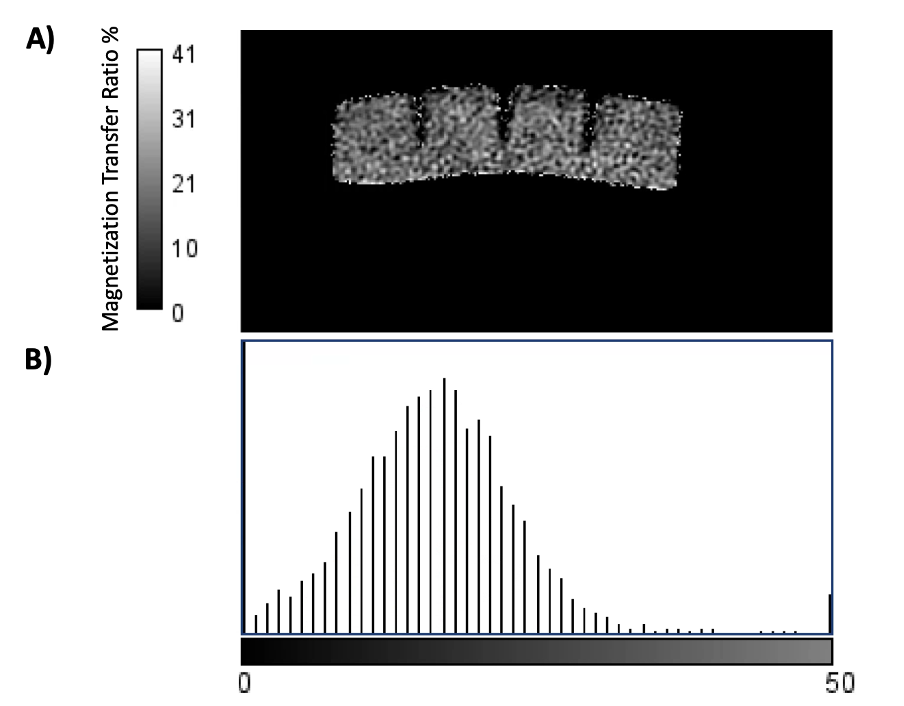
Figure 3 - (A) MTR % map generated of the Jelly phantom, and a histogram (B) of the MTR values through the ROI covering the Phantom
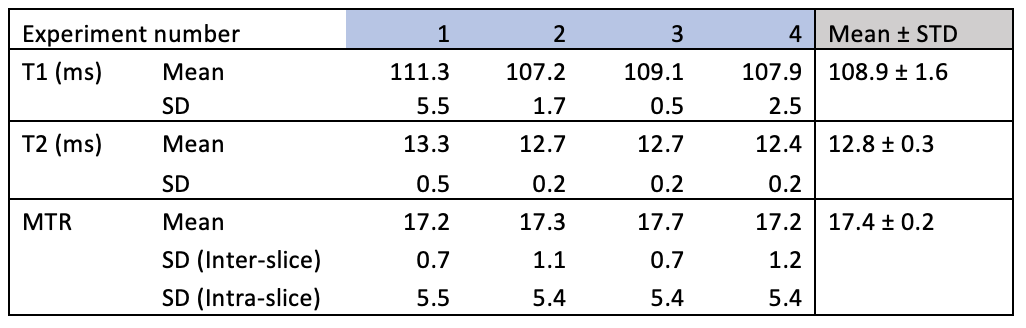
Table 1 - Average T1 relaxation times, T2 relaxation times, and magnetic transfer ratio (%) results from the four scans of the jelly phantom. All T1 and T2 relaxation images were produced on separates days over a period of 1 month, with the MTR images produced through a single imaging session.
DOI: https://doi.org/10.58530/2023/5224