5214
T2 mapping with GRAPPATINI in temporal lobe epilepsy improves epileptogenic zone characterization: a pilot study
Maria Celeste Bonacci1, Maria Eugenia Caligiuri1, Ilaria Sammarra2, Tobias Kober3, Domenico Zacà4, Francesco Fortunato2, and Antonio Gambardella2
1Neuroscience Research Center, Università degli Studi Magna Graecia di Catanzaro, Catanzaro, Italy, 2Institute of Neurology, Università degli Studi Magna Graecia di Catanzaro, Catanzaro, Italy, 3Advanced Clinical Imaging Technology, Siemens Healthcare AG, Lausanne, Switzerland, 4Siemens Healthcare, Milan, Italy
1Neuroscience Research Center, Università degli Studi Magna Graecia di Catanzaro, Catanzaro, Italy, 2Institute of Neurology, Università degli Studi Magna Graecia di Catanzaro, Catanzaro, Italy, 3Advanced Clinical Imaging Technology, Siemens Healthcare AG, Lausanne, Switzerland, 4Siemens Healthcare, Milan, Italy
Synopsis
Keywords: Epilepsy, Quantitative Imaging
The use of qMRI techniques in the routine imaging assessment of epilepsy patients may improve sensitivity in detecting subtle MRI abnormalities which can further aid lateralization and localization of the epileptogenic zone. T2 relaxometry might be a promising tool for a better and non-invasive lateralization of the epileptogenic zone, as well as for identifying lesions that are not visible on standard MRI.Background
Temporal lobe epilepsy (TLE) is characterized by seizures originating from the mesial or lateral temporal lobe. While hippocampal sclerosis (Hs) has been long considered as the hallmark of drug resistance in these patients (up to one-third), there is compelling evidence that also patients with (apparently) negative MRI may not respond to medications. Indeed, hippocampal/temporal lobe abnormalities may not be clearly visible on routine clinical MRI scans, even if volumetric T1-weighted and T2-weighted images are acquired. Moreover, there is not always accordance between MRI findings and electroencephalographic (EEG) abnormalities. Quantitative MRI (qMRI) techniques, such as quantitative T2 mapping, measure intrinsic properties of brain tissue, and thus may represent a useful addition to the standardized assessment of MRI in epilepsy patients. In fact, qMRI techniques may improve sensitivity in detecting subtle MRI abnormalities which can further aid lateralization and localization of the epileptogenic zone.Objective
In this study we have analyzed T2 maps of 10 patients with temporal-lobe epilepsy (TLE) using an accelerated T2 mapping technique to calculate T2 relaxation times of brain tissue and display them voxel-wise on a parametric map.Methods
Ten patients with TLE, 3 males and 7 females (age: 45,6±17,35), diagnosed by EEG and apparently negative to standard MRI alterations, were scanned on a 3T PET-MR Biograph mMR (Siemens Healthcare ). The protocol comprised standard HARNESS acquisition optimized for epilepsy patients (1) and a T2 relaxometry sequence (GRAPPATINI (2), TR=4s, 16 echos, 0:174.4ms, spaced by 10.9 ms; Resolution: 0.45 x 0.45 x 4 mm3). T2 mapping acquisition and reconstruction were performed using a multi-contrast spin-echo research application sequence, enabled to perform blocked undersampling optimized for iterative reconstruction. It starts by calculating an initial guess of the M0 image and the T2 map by standard fitting of the undersampled data. Subsequently, the signal model is applied to calculate simulated image data for all scanned TEs, i.e. a set of estimated T2 contrast images. These images are Fourier-transformed. In order to compare only k-space points which were actually sampled, the resulting estimated k-spaces are multiplied by a binary mask representing the employed block-sampling scheme (“artificial subsampling”). Subsequently, the difference between the actually measured data and the estimated k-space data are calculated. The l2-norm of this residual k-space yields a cost value. Having this cost value, the algorithm checks whether the error between its estimation and the measured data meets a fixed termination criterion. If the criterion is not met, the iterative reconstruction tries to improve the M0 and T2 estimations. To this end, a CG descent optimizer is used, which needs the derivative maps for all fitted parameters. This process is repeated until one of two stop criteria is fulfilled: either an error threshold is reached or the maximal number of iterations. The result of this iterative reconstruction is that the resulting parametric T2 maps are reconstructed directly on the scanner. For each patient, we processed the T1 images with Freesurfer, to obtain segmentations of grey and white matter and of the bilateral hippocampi. Afterwards, using FSL, the simulated image for TE=80s was used to calculate the linear transform to the individual structural space. This transform was then applied to the T2map. Finally, we calculated histograms of T2 value distributions in the following regions: whole-brain, hippocampus, temporal lobe GM and WM. Regions were classified as ipsi-lateral or contra-lateral to EEG seizure focus. Histograms were calculated after masking out CSF voxels, to avoid contamination of high signal values. Normalization and graphical representation of the histograms were performed using an in-house script in matlab: for each patient and each ROI, we compared the individual histogram towards the first quartile, second quartile (median) and third quartile of the cohort distribution of T2 values.Results
Out of ten patients, 5 had a clear epileptogenic side on the EEG, 1 had bilateral electrophysiological abnormalities, and 1 had conflicting evidence of Hs between two expert raters. Interestingly, distribution of T2 values in the temporal region (either whole temporal GM, hippocampus or both) was altered in agreement with the epileptogenic side. Figure 1 shows the T2 distributions in left and right hippocampi of a patient with left EEG abnormalities. It can be observed how the peak position of the histogram is shifted towards higher T2 values in the ipsilateral side (Left peak = 55.5 ms; Right peak = 50.6 ms). Figure 2 shows the doubt Hs case, highlighting how the histogram parameters for the ipsilateral hippocampus were all severely affected. Of note, Hs and EEG side coincided in this case.Discussion and Conclusion
T2 relaxometry might be a promising tool for a better and non-invasive lateralization of the epileptogenic zone, as well as for identifying lesions that are not visible on standard MRI. Quantification of epilepsy-related abnormalities using qMRI can improve the identification of optimal candidates for both surgical treatment of the epileptogenic zone and/or testing of anti-epileptic drugs.Acknowledgements
No acknowledgement found.References
1. Bernasconi A, Cendes F, Theodore WH, Gill RS, Koepp MJ, Hogan RE, Jackson GD, Federico P, Labate A, Vaudano AE, Blümcke I, Ryvlin P, Bernasconi N. Recommendations for the use of structural magnetic resonance imaging in the care of patients with epilepsy: A consensus report from the International League Against Epilepsy Neuroimaging Task Force. Epilepsia. 2019 Jun;60(6):1054-1068. doi: 10.1111/epi.15612. Epub 2019 May 28. PMID: 31135062.
2. Hilbert, T et al. “MARTINI and GRAPPA – When Speed is Taste." Proc Int Soc Magn Reson Med. Milan, Italy(2014).
Figures
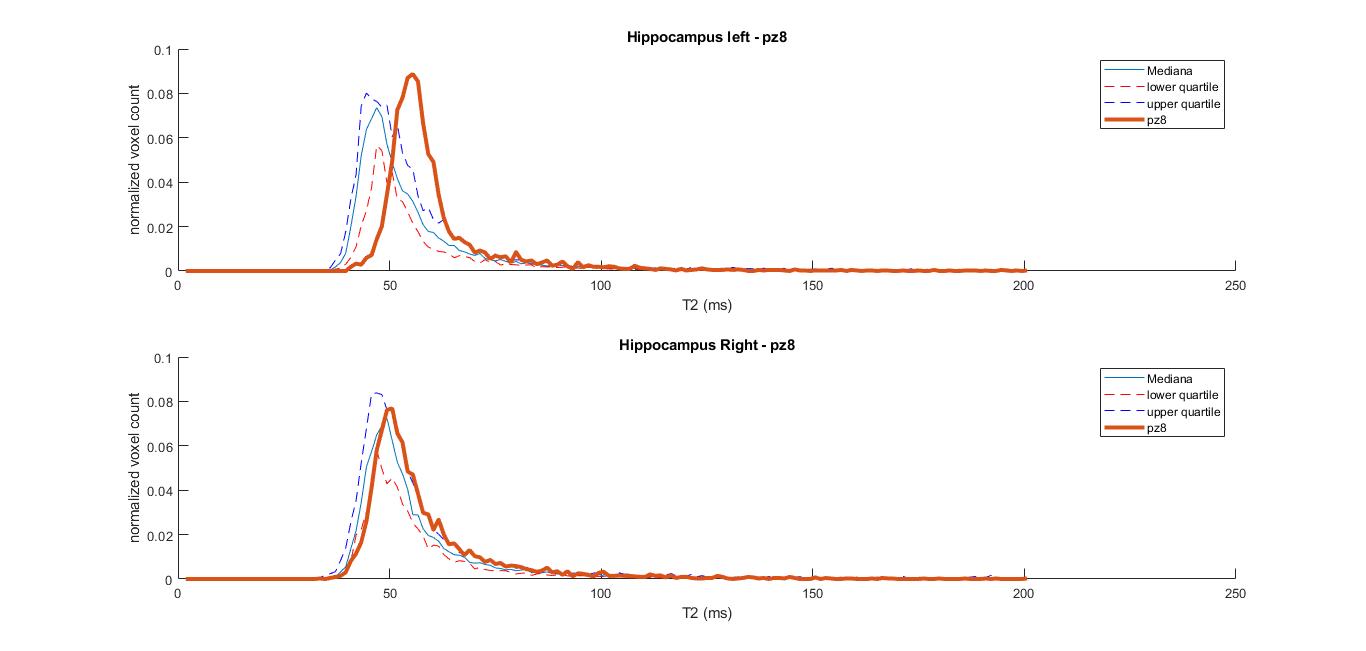
Figure 1: hippocampal T2 distributions for a patient with left-hemispheric EEG abnormalities
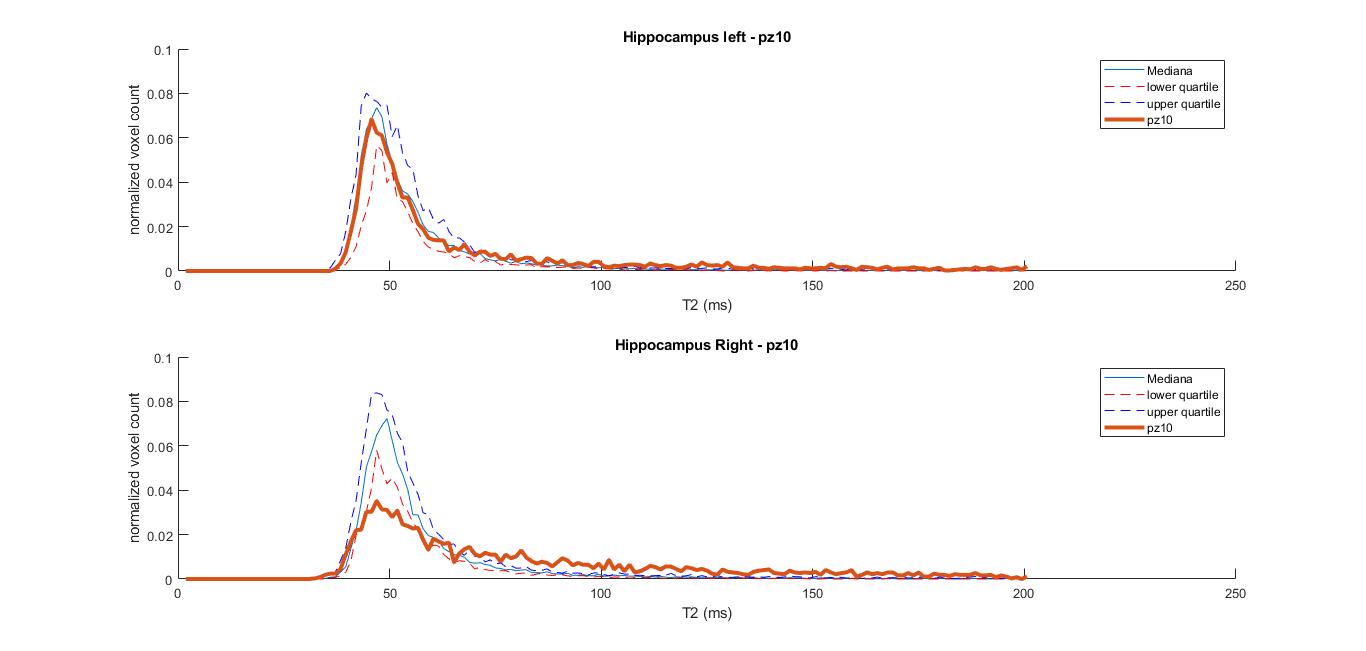
Figure 2: hippocampal T2 distributions for a patient with right-hemispheric EEG abnormalities and right Hippocampal Sclerosis (Hs, routinely detected as atrophy on T1-weighted MRI, and hyperintense signal on T2-weighted MRI)
DOI: https://doi.org/10.58530/2023/5214