5208
Detection of Lesions in Focal Epilepsy by Asymmetry Analysis of MR Fingerprinting
Yuting Li1, Leiyu Geng2, Hong Ge2, Wenbo Zhang3, Siyuan Wu3, and Shenghong Ju2
1Radiology, Zhongda Hospital, Medical School of Southeast University, Nanjing, China, 2Zhongda Hospital, Medical School of Southeast University, Nanjing, China, 3Medical School of Southeast University, Nanjing, China
1Radiology, Zhongda Hospital, Medical School of Southeast University, Nanjing, China, 2Zhongda Hospital, Medical School of Southeast University, Nanjing, China, 3Medical School of Southeast University, Nanjing, China
Synopsis
Keywords: Epilepsy, MR Fingerprinting
Conventional MRI is limited in diagnosis of subtle epileptic lesions. Therefore, this study aimed to localize epileptic lesions by using MRF technology. Twenty epilepsy patients were included which underwent T1, T2 and MRF examinations. The MRI were spatially normalized to the symmetric ICBM-152 template, followed by transformation of T1 and T2 MRF maps. Absolute asymmetric index (|AI|) analysis was then performed on T1 and T2 MRF maps to detect epileptic lesions. Results showed that the |AI| analysis can detect epileptogenic foci in 75% of patients. In conclusion, the asymmetry analysis could help improve epileptic focus localization in clinical practice.Purpose
Epilepsy is one of the most common and serious neurological disorders [1]. Although visual evaluation of MRI has been widely applied to detection of epileptogenic foci, conventional MRI can be limited in detecting subtle epileptic lesions,particularly the focal cortical dysplasia [2]. Magnetic resonance fingerprinting (MRF) is a novel, quantitative, and noninvasive imaging methodology to measure brain tissue properties,and has shown potential in diagnosis of epilepsy [3,4]. Due to the lack of quantitative evaluation of MRF measures, this study aimed to develop a epileptogenic focus localization method based on asymmetric indices of MRF.Method
ParticipantsThis study prospectively included 20 patients with focal epilepsy (12 men and 8 women; mean age, 30.3 ±13.5years; age range, 17–64 years) who underwent MRI examination between January and October 2022.
Data Acquisition
MRI scans were performed using a 3.0 T system (MAGNETOM Vida, Siemens Healthcare, Erlangen, Germany). The imaging protocol included conventional fluid-attenuated inversion recovery, T1- and T2- weighted imaging, and two-dimensional (2D) MRF. A multi-slice 2D MRF acquisition was implemented based on the fast imaging with steady-state precession (FISP) sequence.
Image Preprocessing
The 3D T1-weighted MRI images were preprocessed by using FreeSurfer software [5]. The major steps included intensity normalization, removal of non-brain tissues, bias field correction, gray matter (GM)-white matter (WM) segmentation and tissue segmentation [6]. Preprocessed T1-weighted images were then spatially normalized to symmetric ICBM-152 brain template by advanced normalization tools [7,8]. The MRF T1 and T2 maps were coregistered with corresponding T1-weighted images by rigid transformation.
Asymmetry Analysis
The GM and WM regions-of-interest (ROIs) of T1-weighted images were transformed to the symmetric ICBM-152 template by transformations of spatial normalization, and then left-right flipped around midsagittal plane of the symmetric template. For each voxel in the template space, a Gaussian kernel with full-width-half-maximum (FWHM) of 4-mm was applied to summarize the probabilities of GM and WM ROIs from all transformed segmentation images and their flipped images. The voxel was then labelled as that of ROI with the maximum summed probability. A symmetric GM ROI could then be determined on the symmetric template, and was then applied to asymmetry analysis.
The coregistered MRF T1 and T2 maps were warped to the symmetric space by using results of corresponding T1-MRI spatial normalization. The warped MRF T1 and T2 maps were smoothed by a 4-mm FWHM Gaussian kernel, which was restricted within the symmetric GM ROI. Absolute asymmetric index (|AI|) was then determined for each voxel:
|AI|=2*|left-right|/(left+right)
where left and right denote voxel values on contralateral positions. The clusters of voxels with top 10% largest |AI| were then evaluated by an experienced radiologist on both MRF T1 and T2 maps. The clusters that agreed with electroencephalogram and seizure semiology evaluation were considered as potential epileptogenic foci.
Statistics
A 3D sphere with 6-mm radius was located on center of potential epileptogenic focus with local maximal |AI|. The average |AI| values and peak values were obtained and compared between T1 and T2 MRF maps by two-tailed student’s test.
Results
Figure 1 showed average of MRF T1 and T2 maps of all patients. A total of 22 epileptogenic foci were found in 75% (15/20) of all patients, which agreed with the electroencephalogram findings and seizure semiology evaluation. The detected foci on two representative patients were demonstrated in Figure 2. Figure 3 showed average and peak |AI| values of detected foci. The T2 map showed significantly increased average |AI| values (0.574 vs. 0.333, P-value < 0.001) and peak |AI| values compared with T1 map (1.291 vs. 0.793, P-value < 0.001).Conclusion
The asymmetry analysis method based on MRF in this study showed potential to detect subtle epileptic lesions. Clinical application of this novel quantitative MRF technique and the symmetric analysis method may improve the accuracy of epileptic foci localization.Acknowledgements
This work is partly sponsored by grants from the Natural Science Foundation of Jiangsu province (No. 20220830).References
[1] Bernasconi, Andrea, et al. "Advances in MRI for'cryptogenic'epilepsies." Nature reviews neurology 7.2 (2011): 99-108. [2] Ma, Dan, et al. "Development of high‐resolution 3D MR fingerprinting for detection and characterization of epileptic lesions." Journal of Magnetic Resonance Imaging 49.5 (2019): 1333-1346.[3] Tang, Yingying, et al. "Characterizing thalamic and basal ganglia nuclei in medically intractable focal epilepsy by MR fingerprinting." Epilepsia 63.8 (2022): 1998-2010.[4] Liao, Congyu, et al. "Detection of lesions in mesial temporal lobe epilepsy by using MR fingerprinting." Radiology 288.3 (2018): 804-812.[5] Fischl B. FreeSurfer[J]. Neuroimage, 2012, 62(2): 774-781.[6] Fischl B, Salat D H, Busa E, et al. Whole brain segmentation: automated labeling of neuroanatomical structures in the human brain[J]. Neuron, 2002, 33(3): 341-355.[7] Fonov, Vladimir S., et al. "Unbiased nonlinear average age-appropriate brain templates from birth to adulthood." NeuroImage 47 (2009): S102.[8] Avants, Brian B., et al. "Symmetric diffeomorphic image registration with cross-correlation: evaluating automated labeling of elderly and neurodegenerative brain." Medical image analysis 12.1 (2008): 26-41.Figures
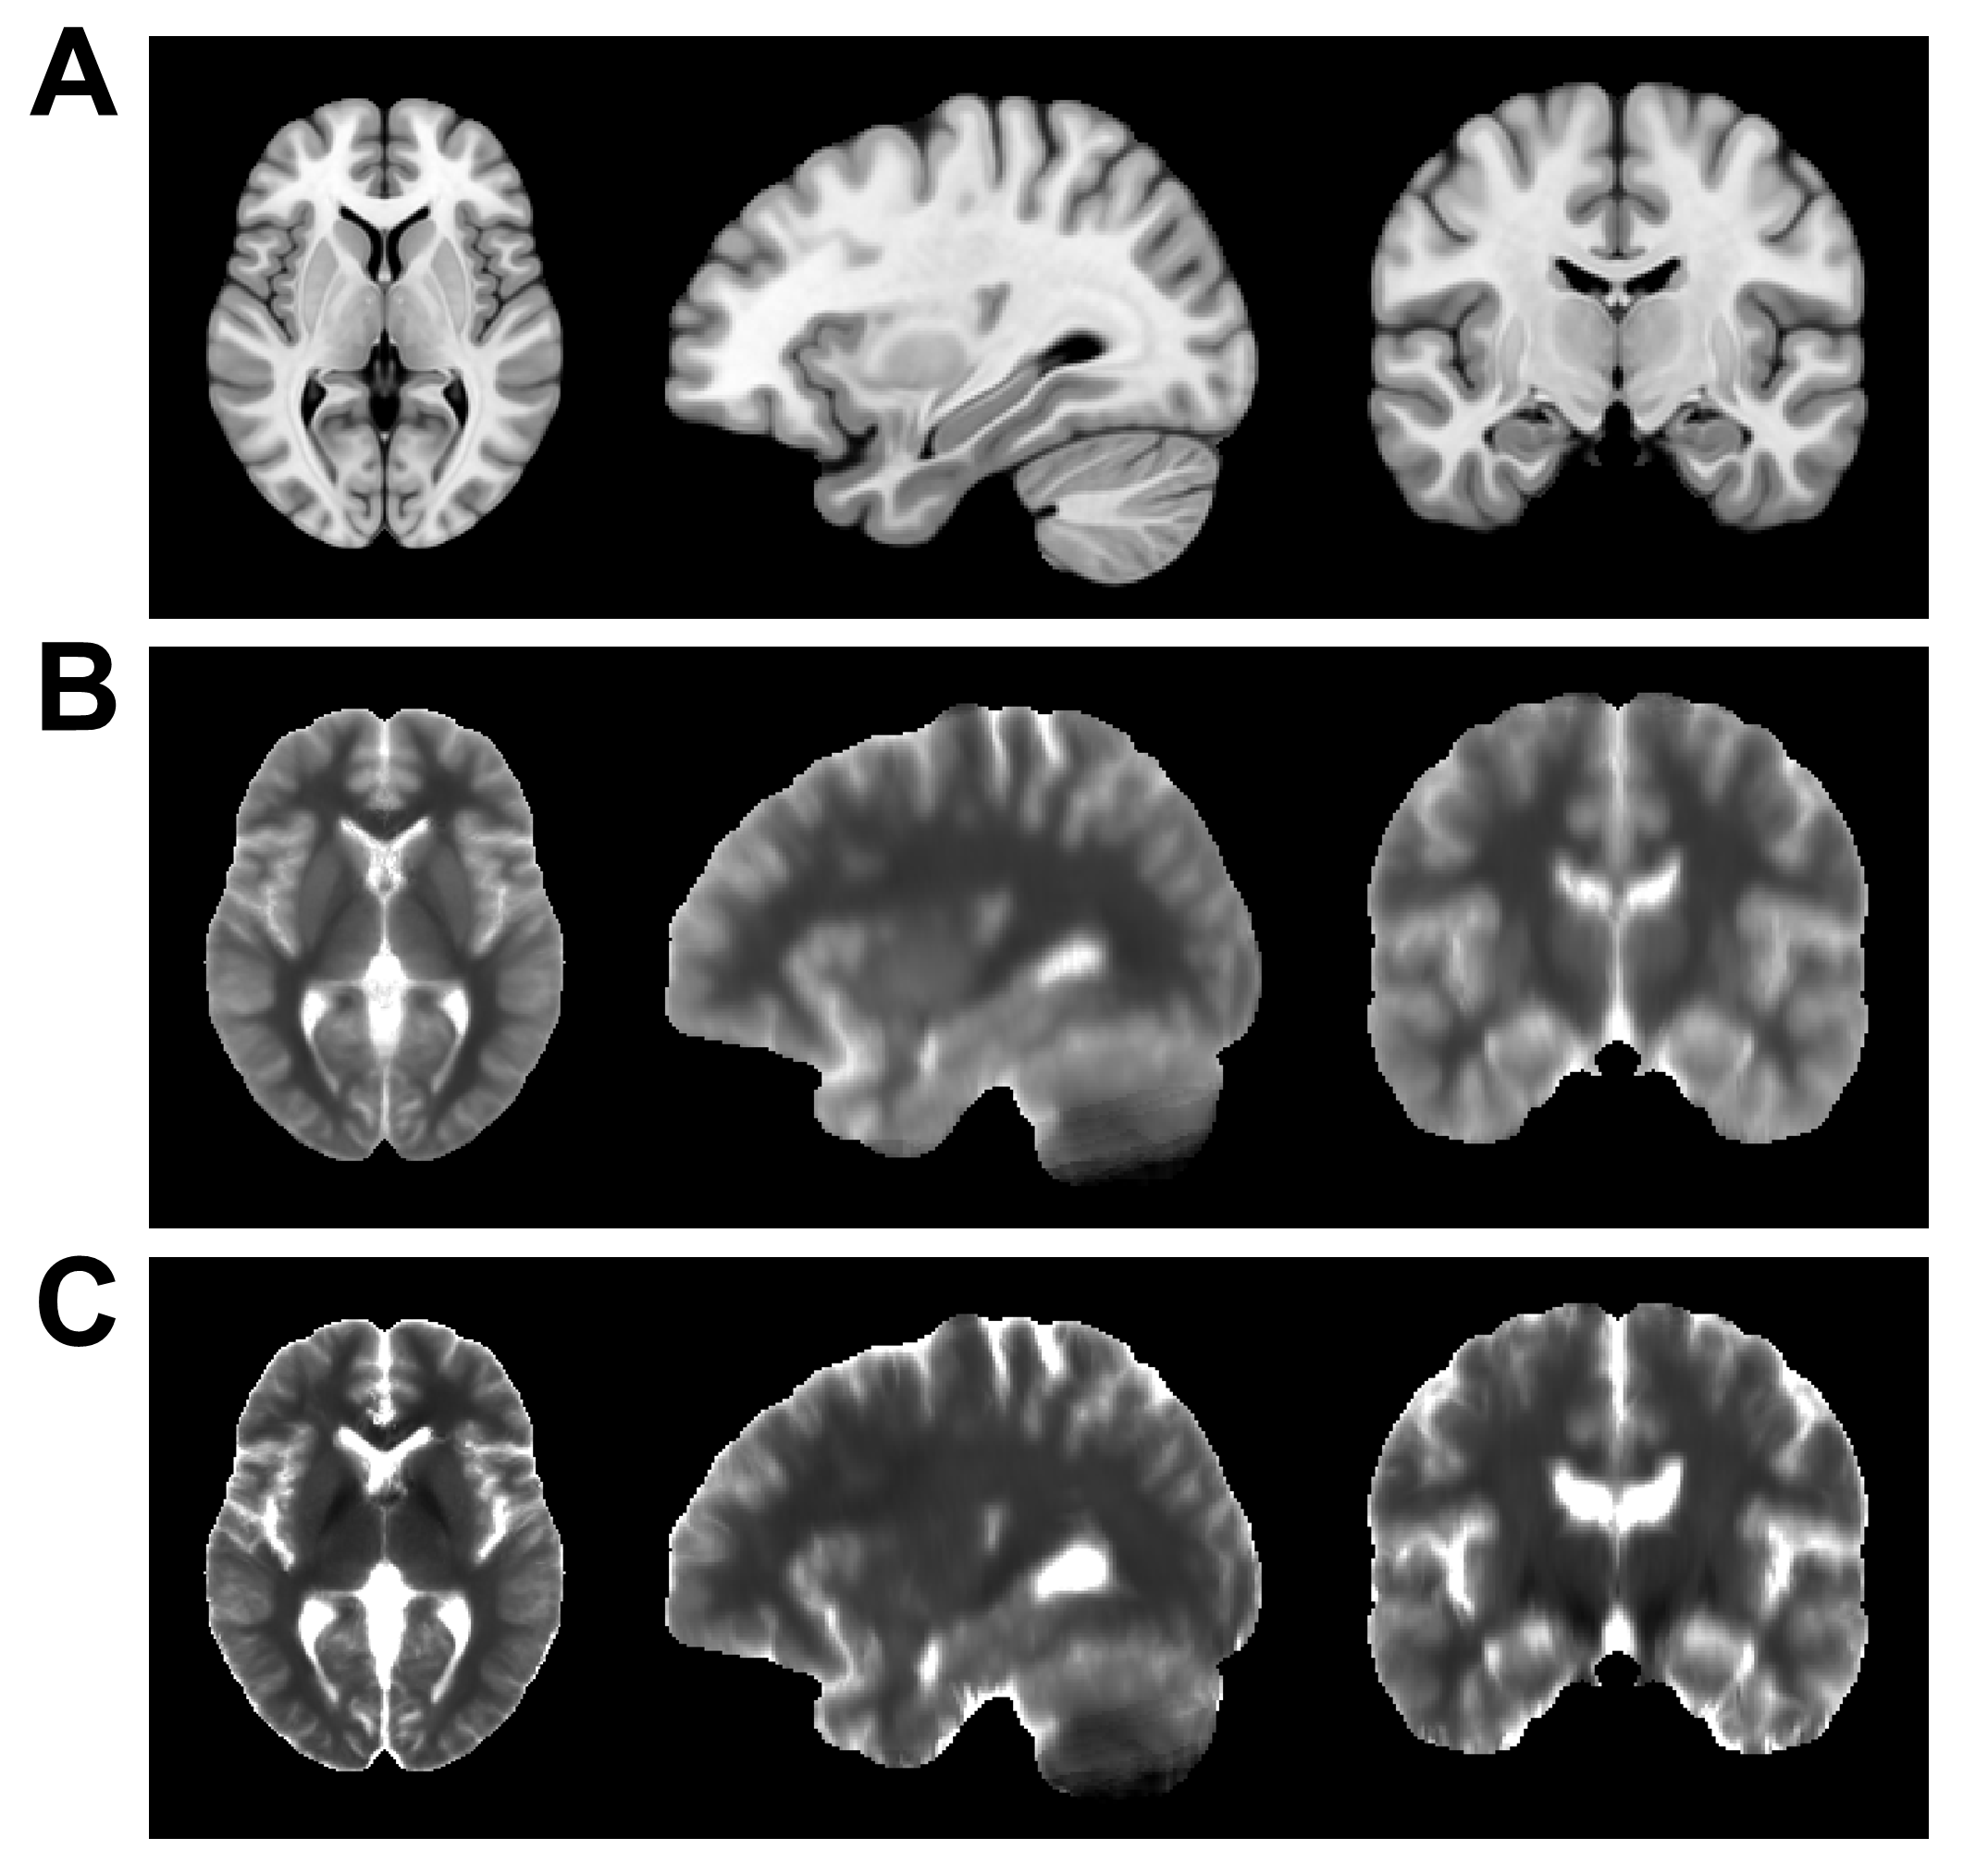
Comparison of T1-weighted MRI, average MRF T1 and T2 maps. (A) Symmetric ICBM-152 T1-weighted brain template; (B) Average MRF T1 maps; (C) Average MRF T2 maps.
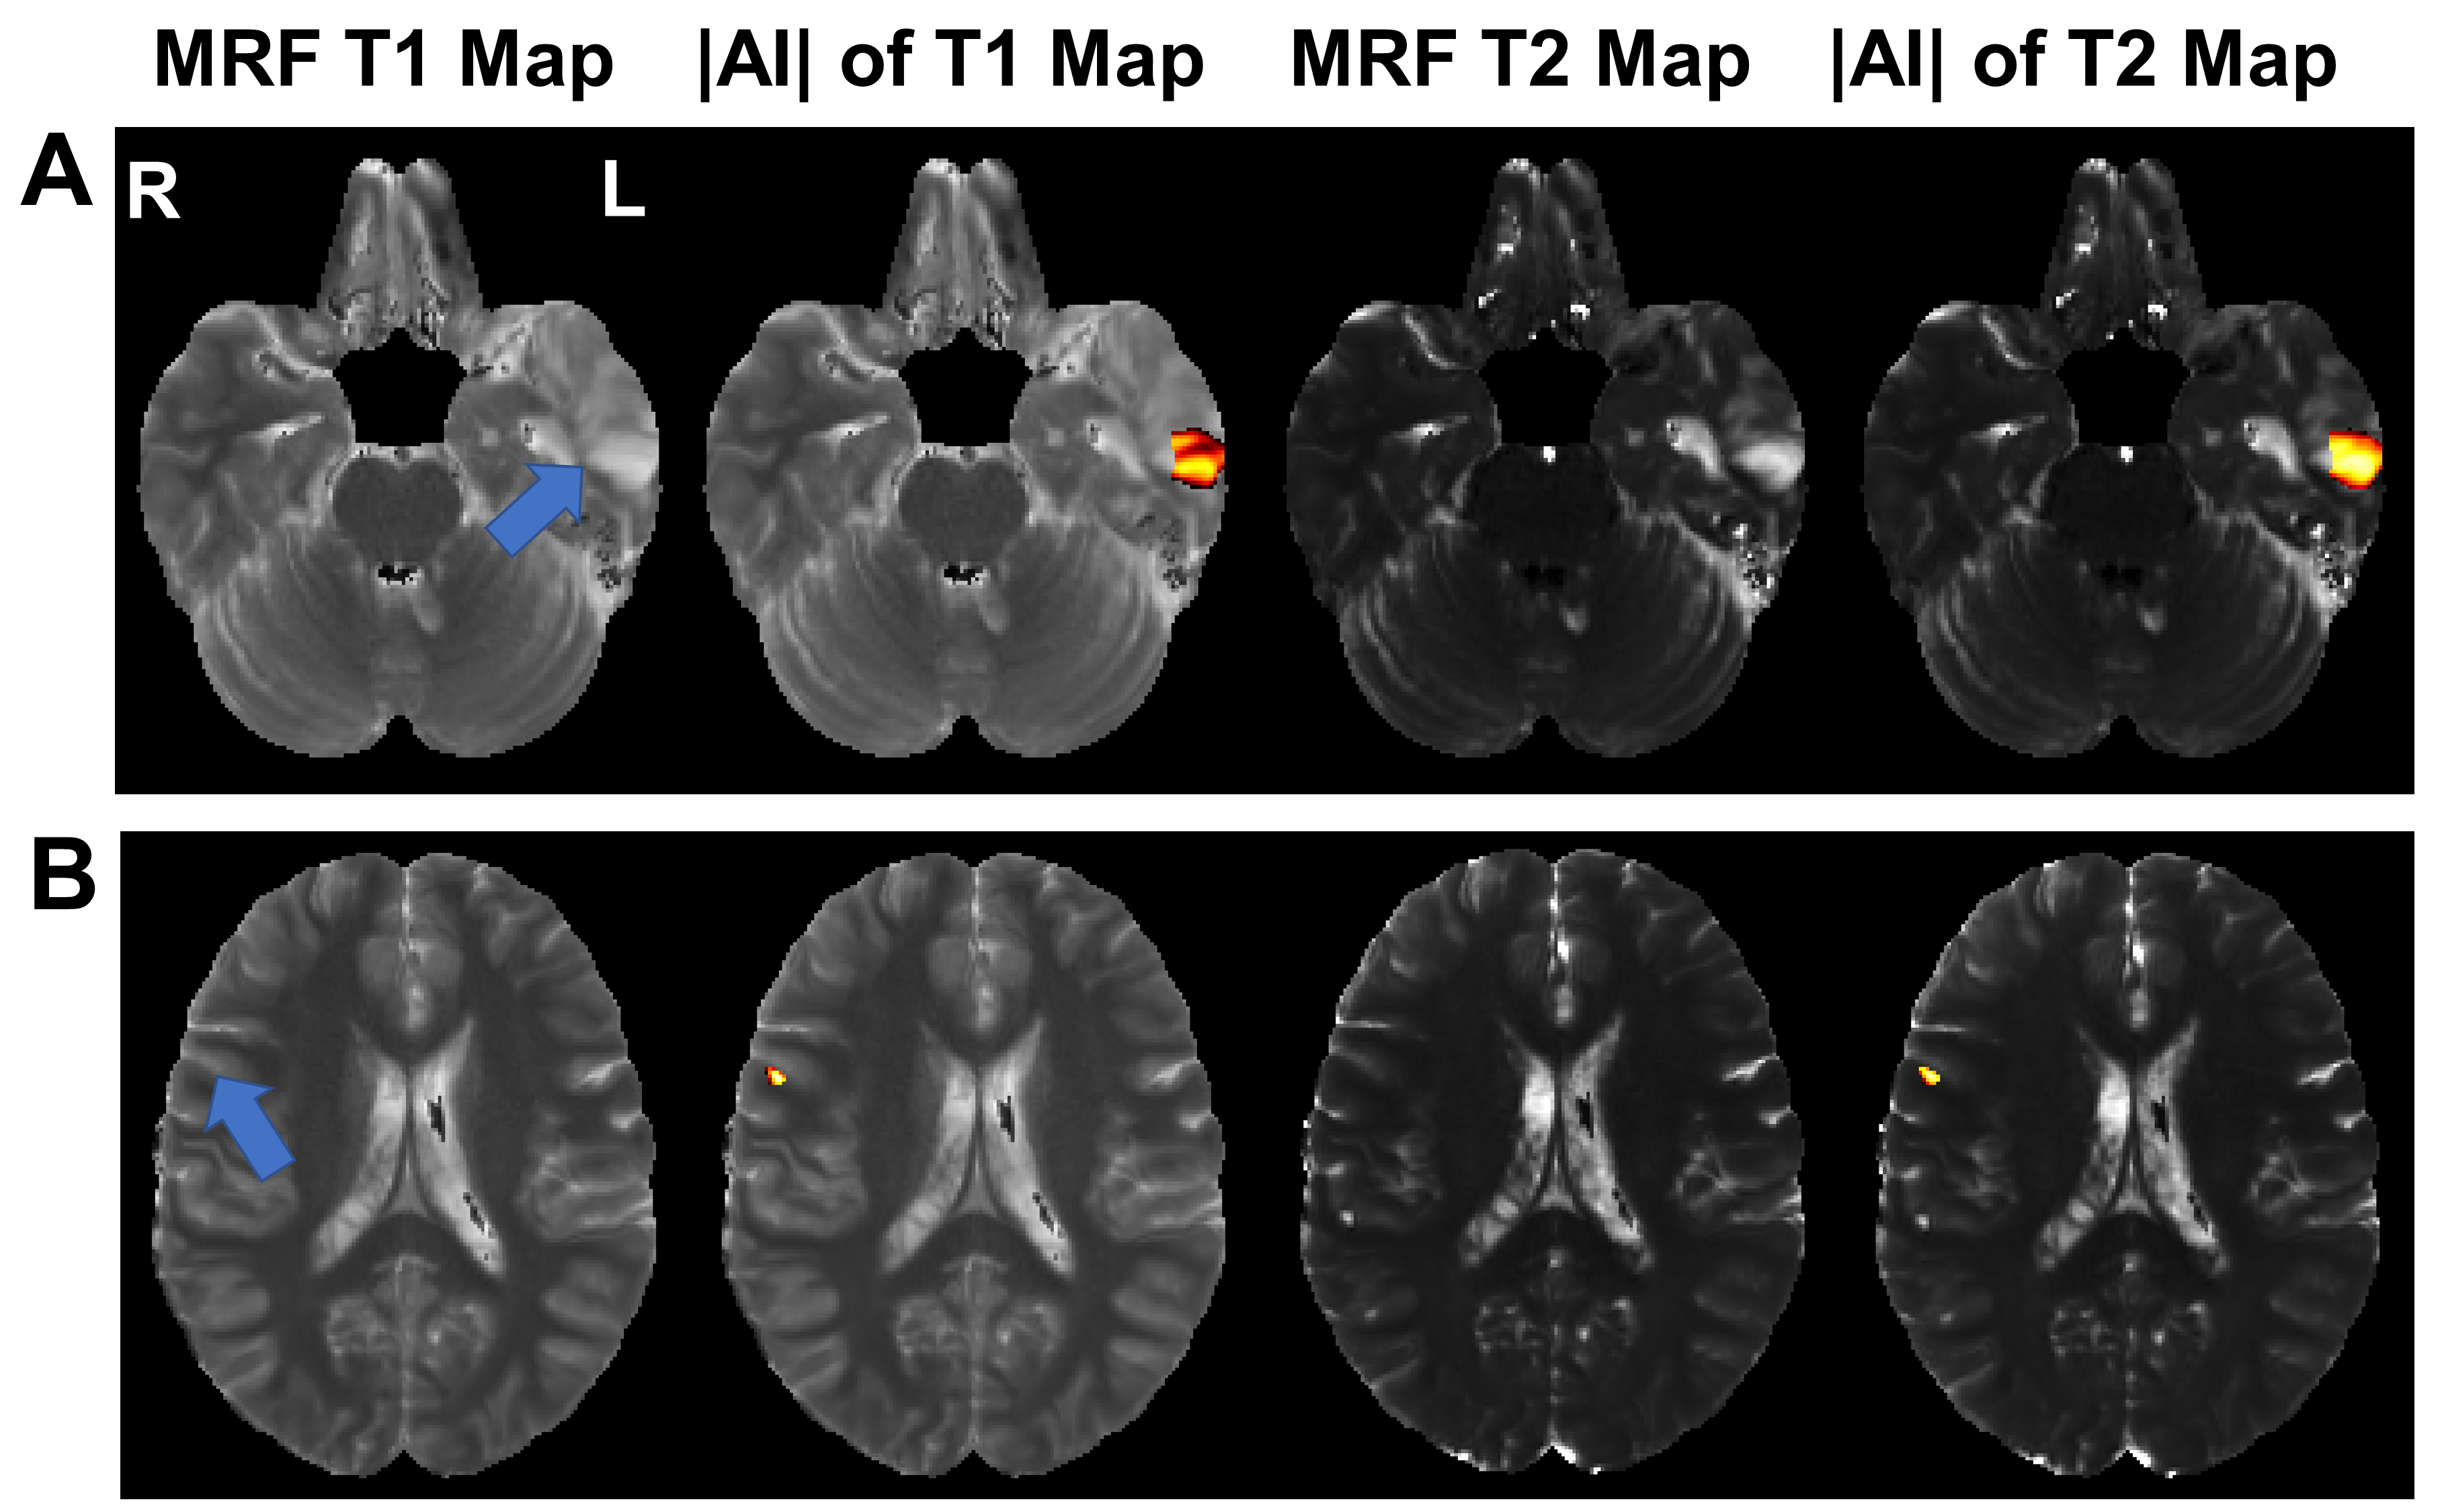
Epileptic lesion localization results of representative patients. Arrow point to epileptic lesion.
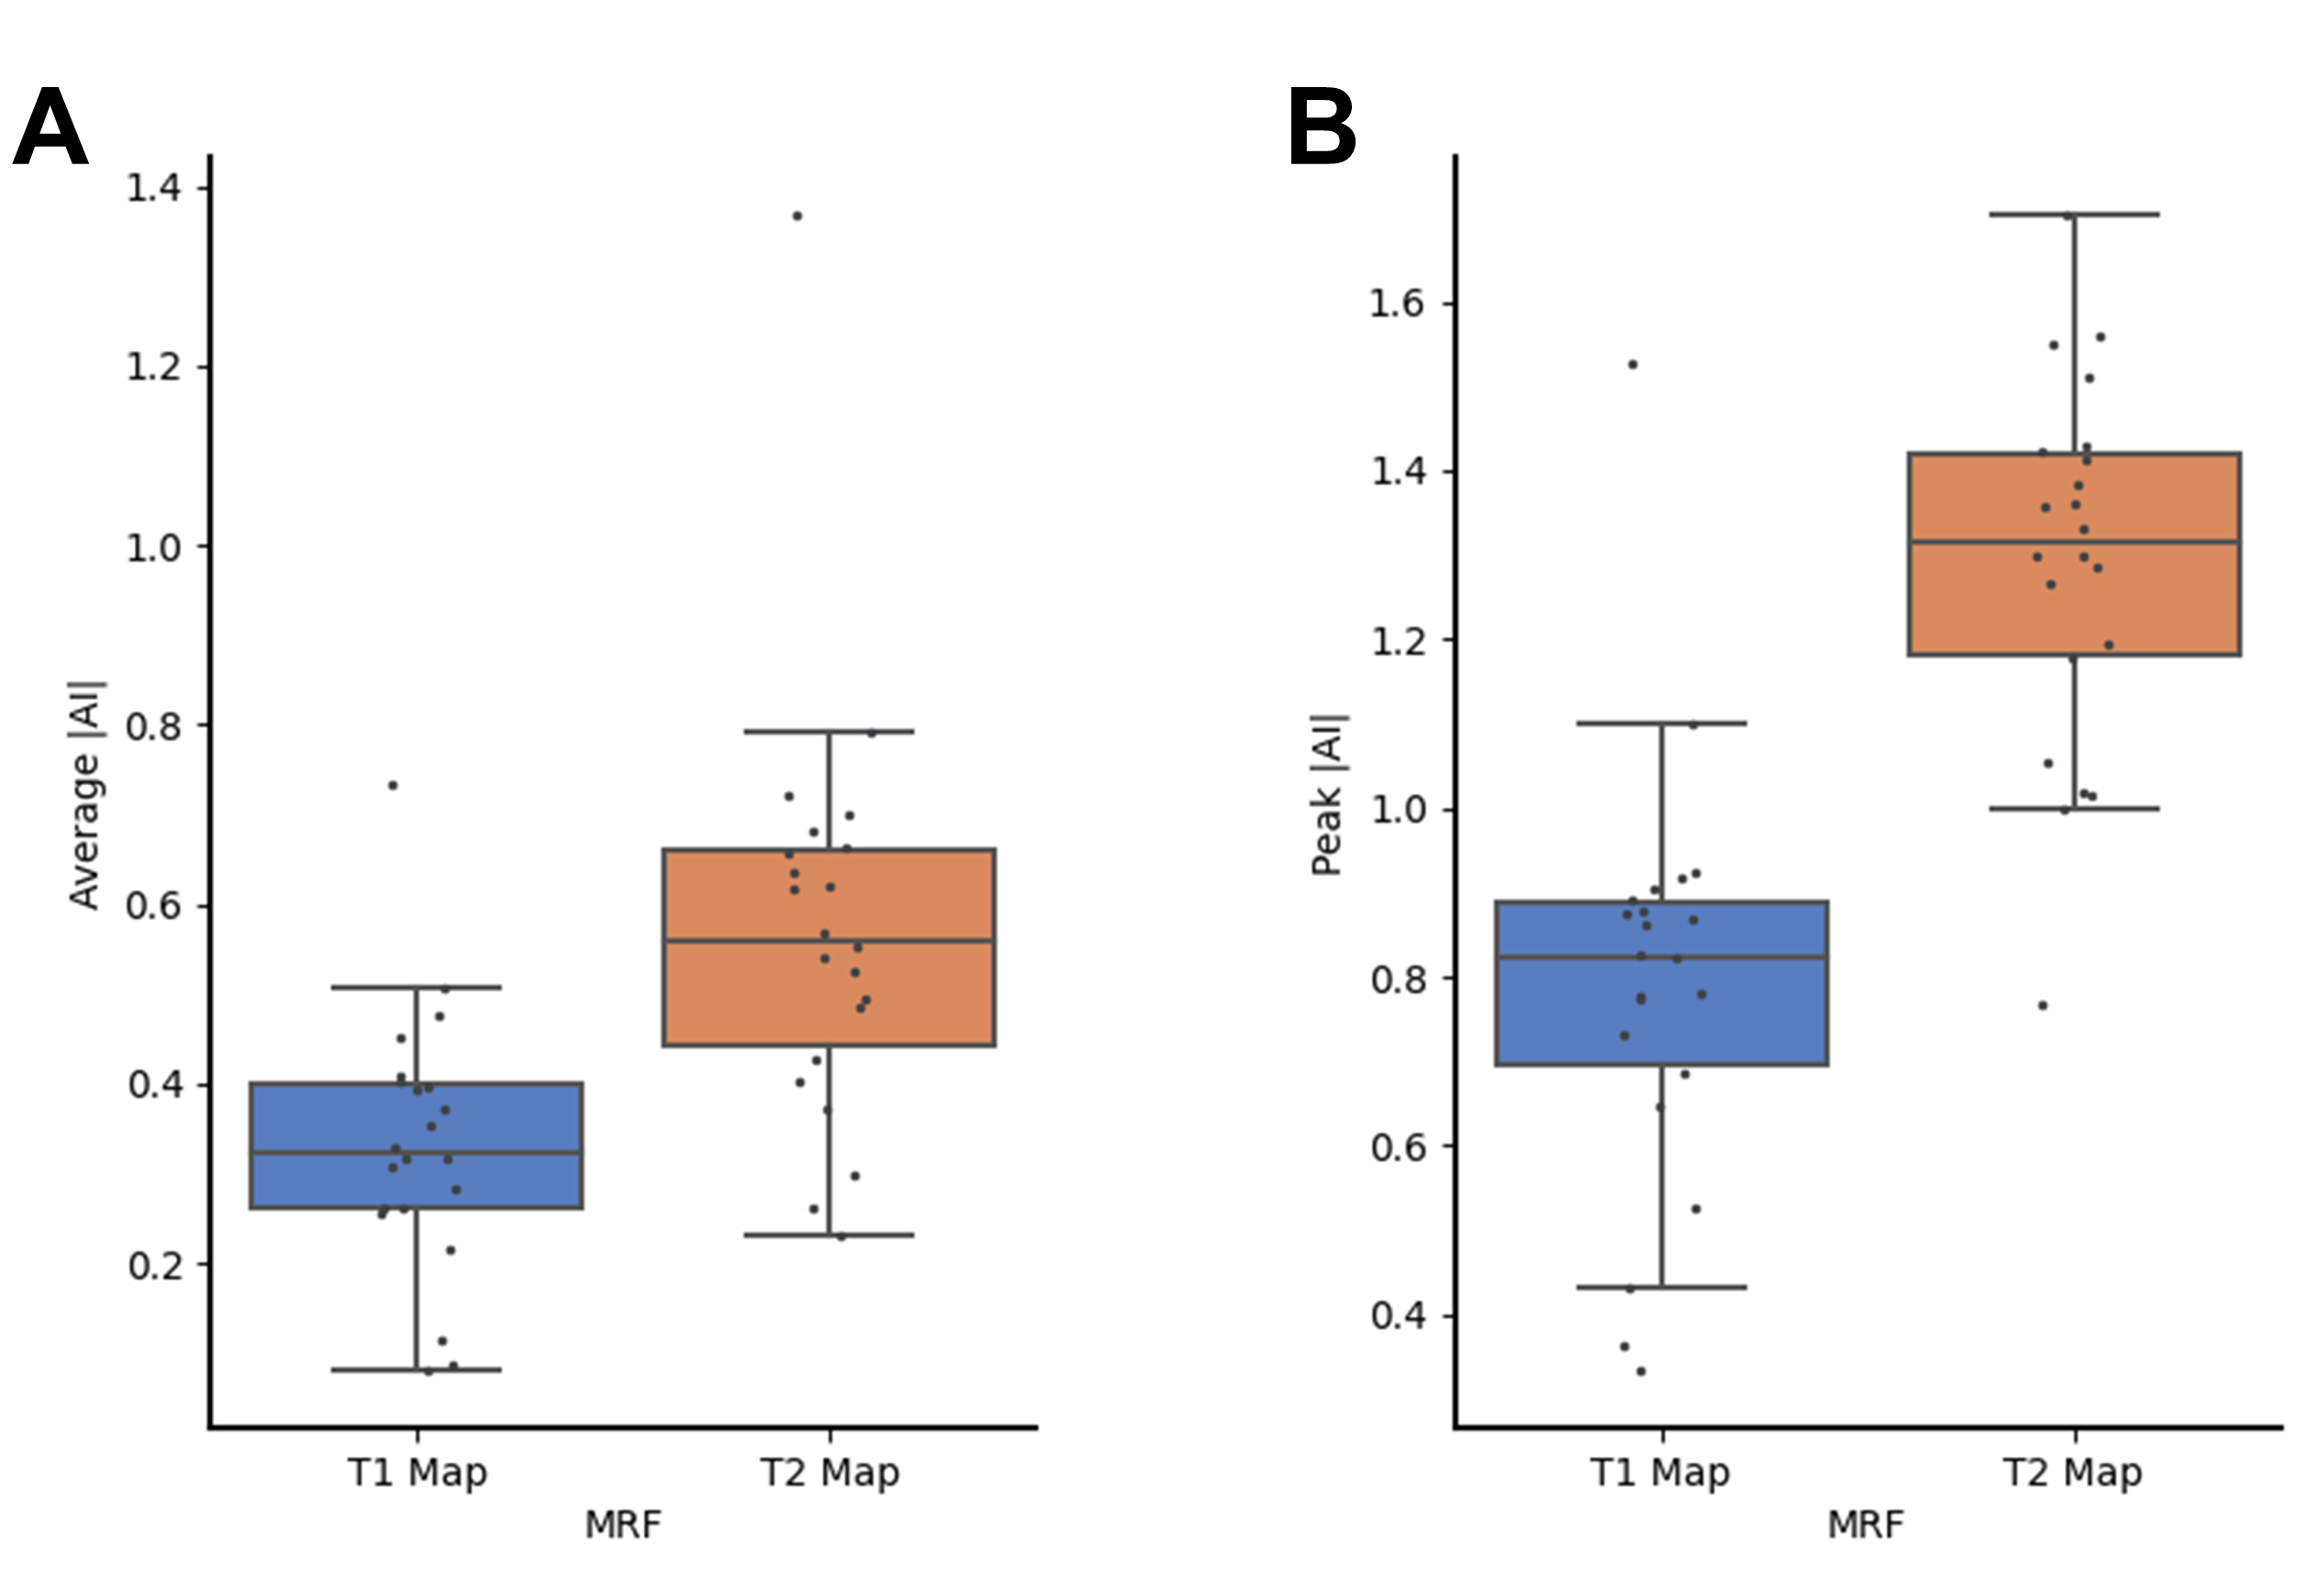
Comparison of absolute asymmetric indices of MRF T1 and T2 maps. (A) Average absolute asymmetric indices; (B) Peak absolute asymmetric indices.
DOI: https://doi.org/10.58530/2023/5208