5207
Diffusion spectrum imaging study of cognitive and emotional related structural network in patients with temporal lobe epilepsy1Department of Magnetic Resonance, Lanzhou University Second Hospital, Lanzhou, China, 2Philips Healthcare, Xi'an, China
Synopsis
Keywords: Epilepsy, Diffusion/other diffusion imaging techniques
To investigate the relationship between changes in brain networks and changes in emotion and cognition in patients with temporal lobe epilepsy. We used Diffusion spectrum imaging to construct structural brain networks. Then graph-theoretical analysis was applied to estimate structural connectivity and network properties in temporal lobe epilepsy (TLE) patients. Our study found that the brain network connectivity is altered and this alteration is associated with cognitive decline in TLE patients. This result offers a complementary understanding of neuropathology mechanism of TLE and its related cognition alteration, which may be helpful for clinical diagnosis and prognosis evaluation.Introduction
Temporal lobe epilepsy (TLE), one of the most common and severe neurological disorders worldwide, mainly characterized by recurrent abnormal hypersynchronous electrical discharges arising from the temporal lobe[1]. There is accumulating evidence that epilepsy is caused by the disorder of neural networks. Recent studies have shown that TLE was associated with emotional and cognitive dysfunction,[2] but the underlying white matter alterations remains unclear. Diffusion spectrum imaging (DSI), compared with diffusion tensor imaging, is an advanced diffusion weighted imaging model that display crossing fibers and complex intravoxel fiber orientation distributions. [3] Based on the DSI technique and grapy theory, we aimed to evaluate the changes of white matter and epileptic connectomes. Moreover, we investigated the relationship between network metrics and the clinical scales in patients with TLE.Methods
Thirty-three TLE patients and twenty-eight age-, sex- and educational matched healthy controls (HC) enrolled from the Second Hospital of Lanzhou University. The diagnosis of TLE was made according to International League against Epilepsy criteria[4]. DSI and Sagittal three-dimensional T1 weighted images(3D-T1WI)were acquired in all subjects on a 3T MR scanner (Ingenia CX, Philips Healthcare, the Netherlands) with a dedicated 32 channel head coil. High resolution sagittal 3D T1 imaging was used for structural data collection. The corresponding parameters were as follows: TR=3900ms, TE=3.5ms, flip angle=12°, 360slices, 1x1x1 mm3 spatial resolution. The corresponding parameters of DSI were: the shortest TR and TE, flip angle=90°, slice thickness=2mm, scan time=11min20s. The white matter structural network and graph-theoretical analysis was performed by DSI Studio (https://dsi-studio.labsolver.org) and GRETNA software (https:/nitrc.org/projects/Gretna/). The following network attributes were calculated: the hierarchy, the network efficiency,the synchronization,the nodal cluster coefficiency,the nodal efficiency and the nodal shortest path. Each patient with TLE was assessed by the National Hospital Seizure Severity Scale (NHS3) to determine epilepsy severity. All participants underwent Montreal Cognitive Assessment (MoCA) to evaluate their general cognition. Self-rating anxiety scale (SAS) as basis for anxiety assessment was also acquired. We examined differences in the network attributes and nodal attributes between TLE group and HC group by using two-sample t test. Spearman’s correlation analysis was performed to investigate the relationship between brain dysfunction and clinical features.Results
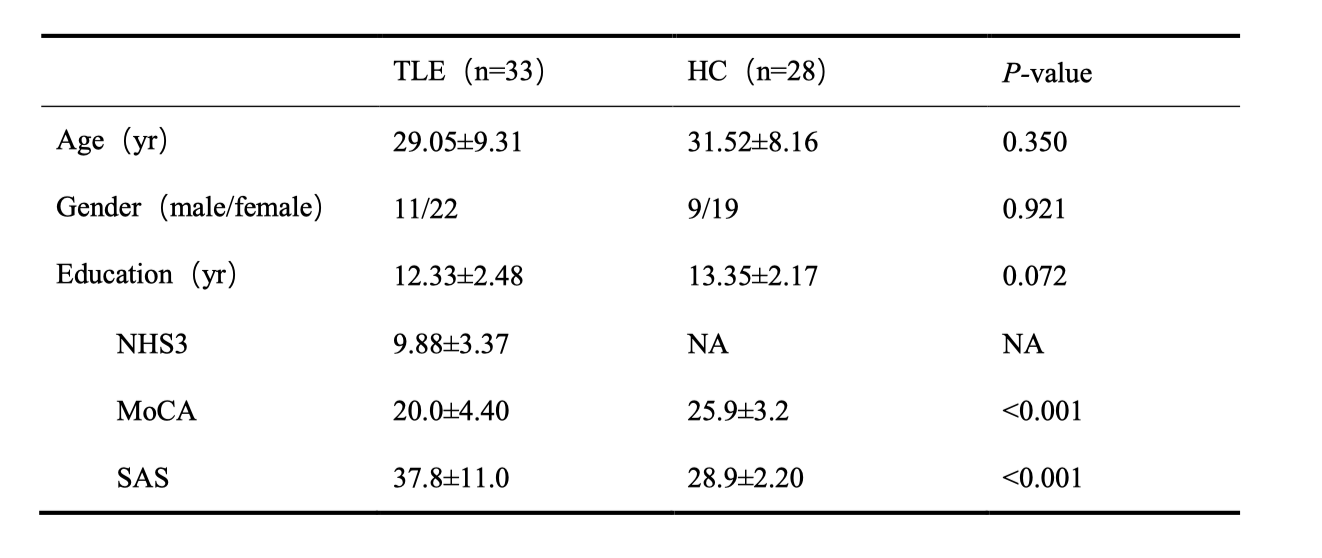
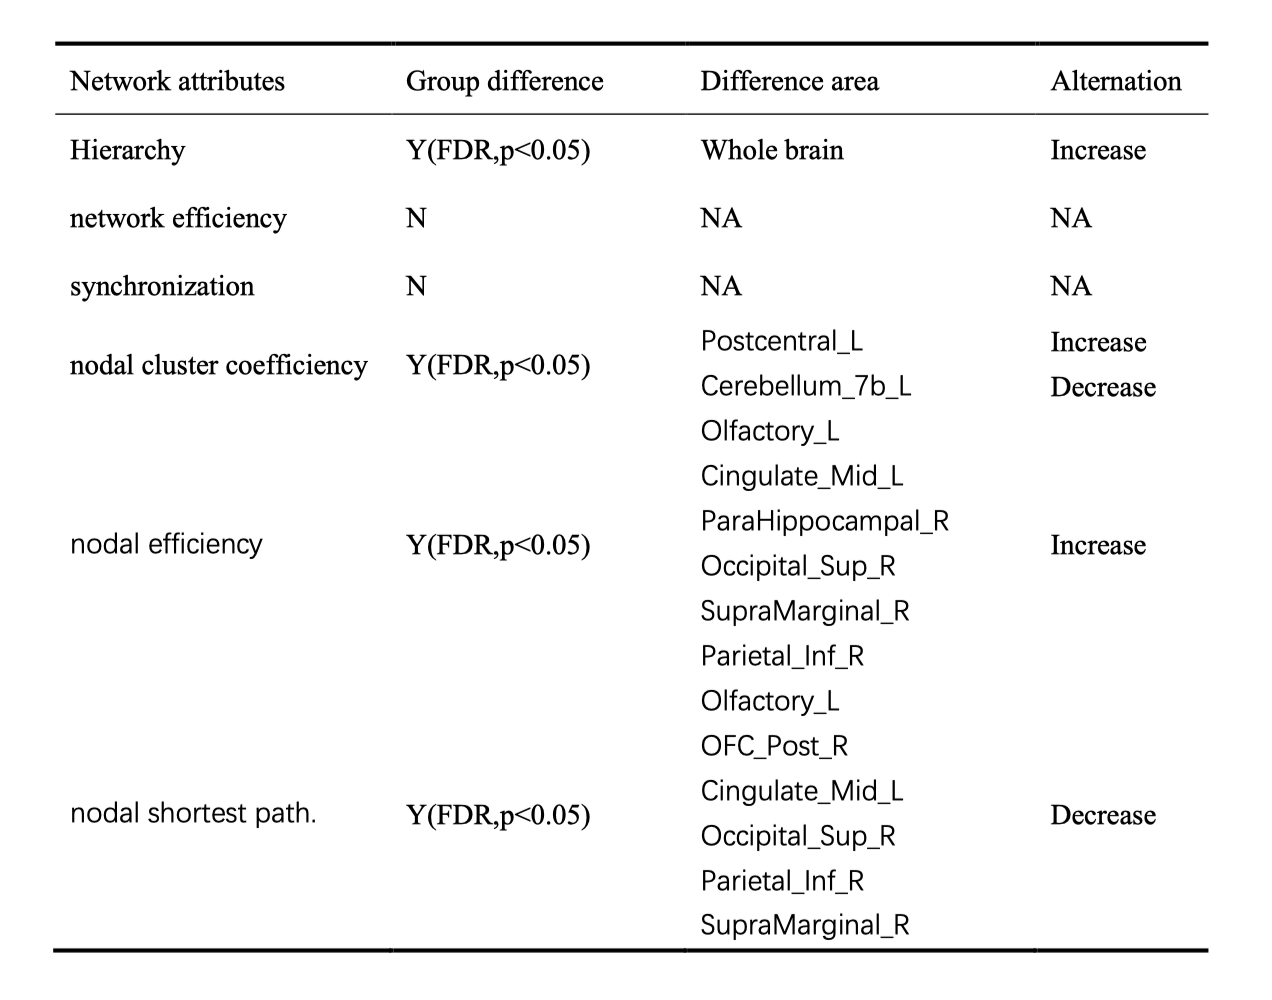
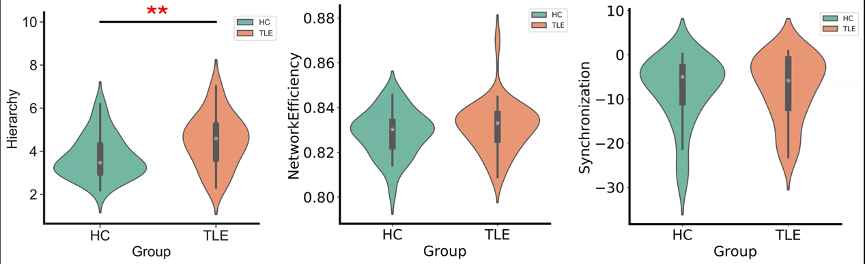
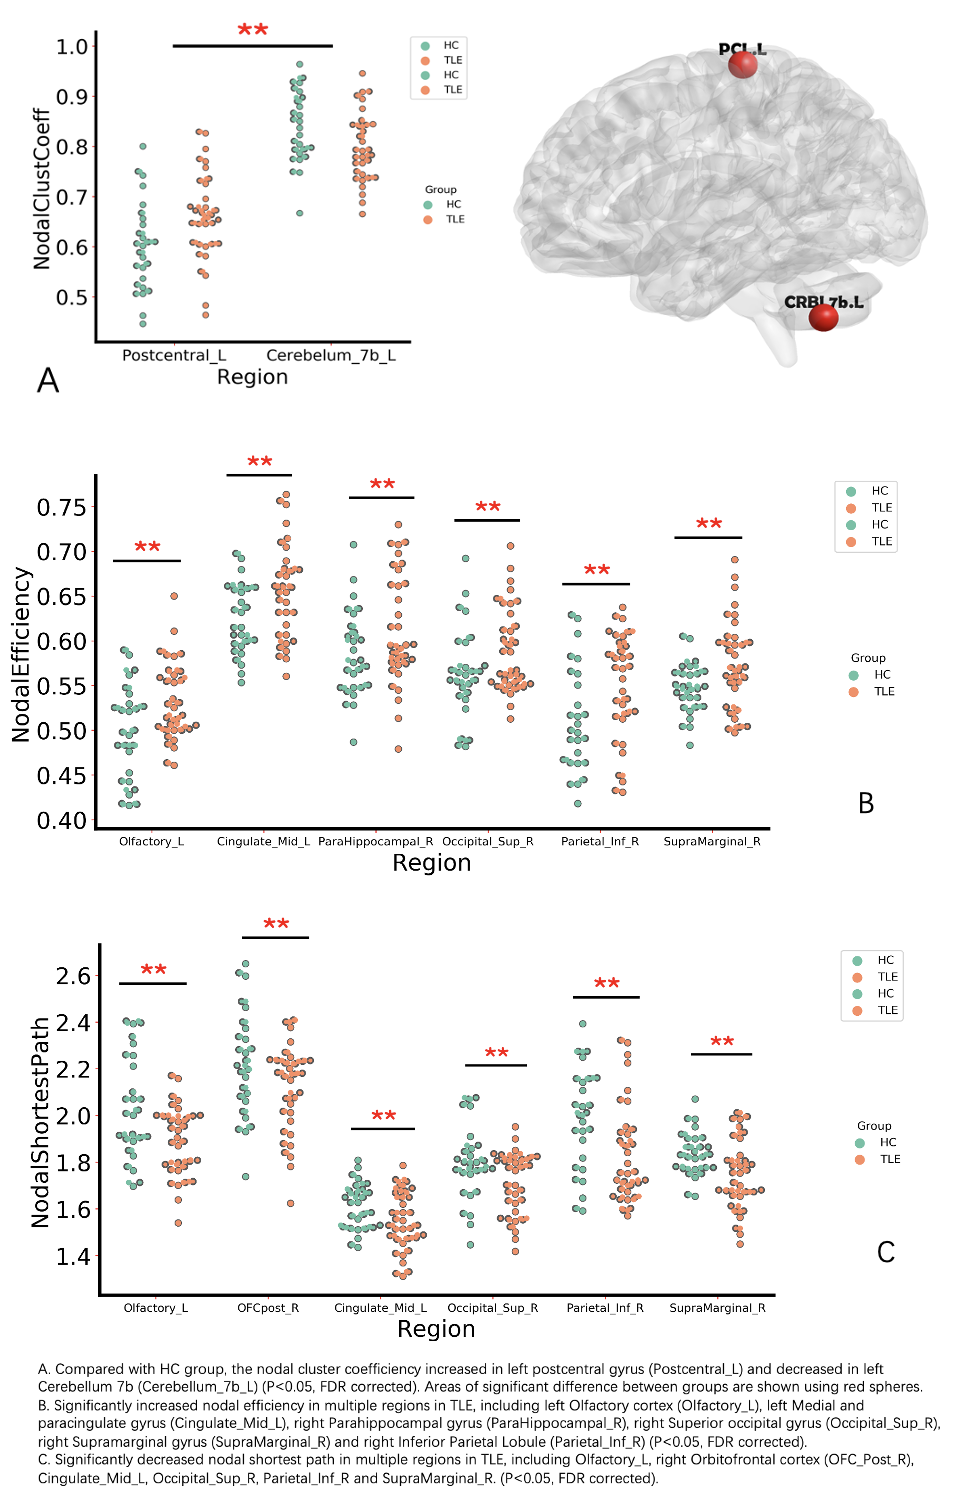
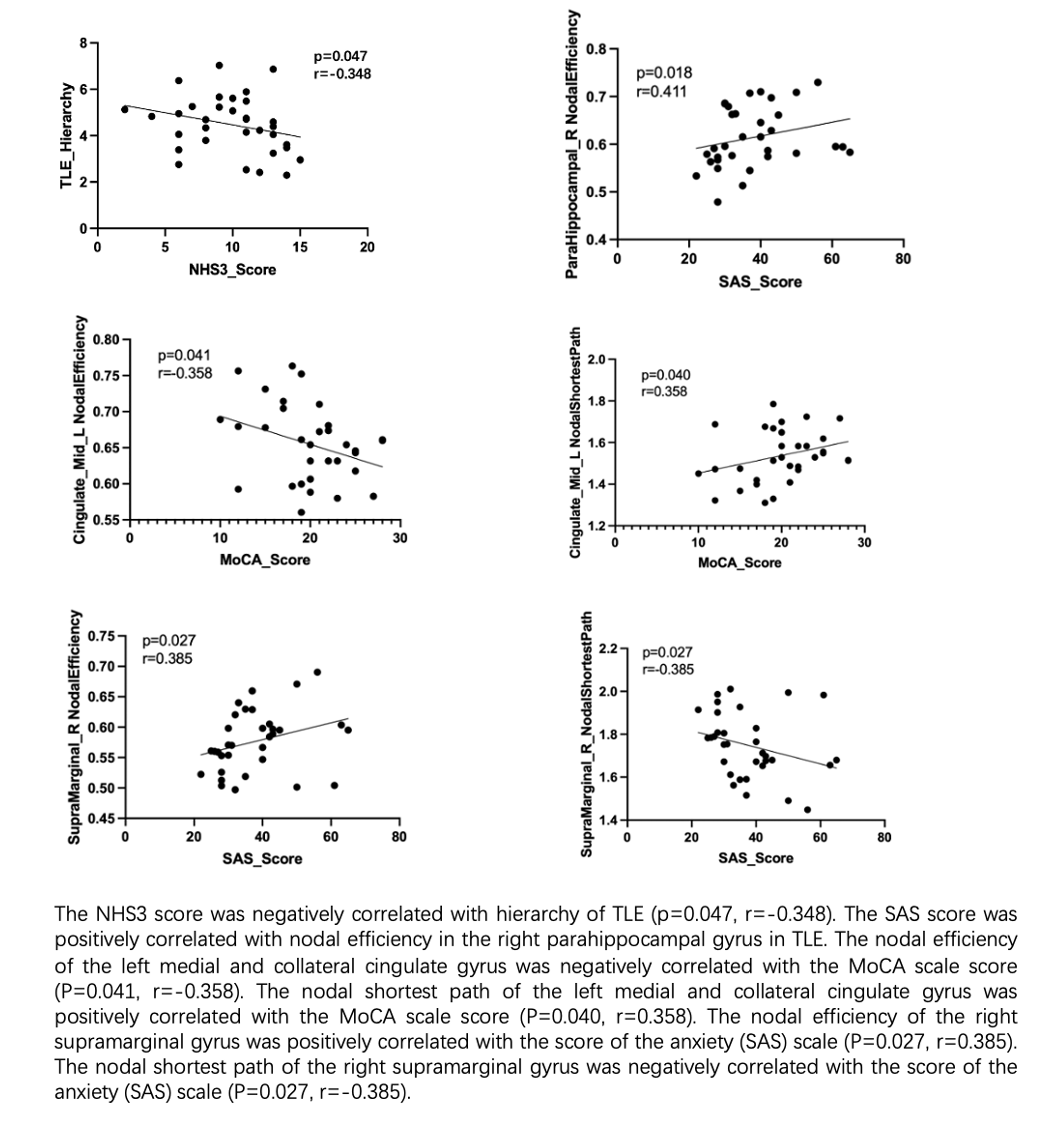
Table 1 showed the demographic and clinical characteristics of TLE and HC. The two groups did not differ in terms of age, gender, or educational distribution. Compared with the HC, patients with TLE showed a significantly higher MoCA score (p < 0.001) and SAS scores (p < 0.001). Table 2 showed the statistical results of graph theory analysis between TLE and HC group. Compared with HC, the hierarchy was significantly higher in TLE (p<0.05) and there was no significant difference in other network indicators (Fig 1). The nodal cluster coefficiency was increased in the left Postcentral gyrus and decreased in left Cerebellum 7b. We also found a significant increase in nodal efficiency and decrease in nodal shortest path in several brain regions, including left Olfactory cortex, left Medial and paracingulate gyrus, right Superior occipital gyrus, right Supramarginal gyrus and left Inferior Parietal Lobule (Fig 2). Spearman analysis showed that there was a negative correlation between hierarchy and NHS3(P=0.047,r=0.348). In the TLE group, the nodal efficiency of the left medial and collateral cingulate gyrus was negatively correlated with the MoCA scale score (P=0.041, r=-0.358), the nodal efficiency of the upper gyrus on the right edge was positively correlated with the score of the anxiety (SAS) scale (P=0.027, r=0.385). The nodal shortest path had the opposite correlation with the nodal efficiency. Besides, the nodal efficiency in the right parahippocampal gyrus was positively correlated with the SAS (P=0.018, r=0.411) (Fig 3).Discussion
In this study, we found the metrics of global and regional networks in patients with TLE were different from HC. Compared with HC, TLE group showed higher hierarchy, suggesting that TLE patients had a higher topological level, a closer connection and a higher internal connectivity than HC brain. In nodal-based network, increased nodal efficiency and decreased nodal shortest path including the left olfactory cortex, middle cingulate gyrus, superior occipital gyrus, inferior parietal lobule indicated local connectivity in these brain areas were increased. It may be related to the formation of specific electrical activity propagation pathways and epilptogenic network[5]. In our assessment of emotion and cognition condition, we found as nodal efficiency increases, the cognitive score decreased, and the anxiety score increased. Due to the increase of node efficiency, the local formation of a pathological transmission network conducive to the propagation of epileptic electrical activity became more and more obvious, resulting abnormal discharge signals continue to damage brain neuron function and then the cognitive and emotional decline.Conclusion
In conclusion, our results provided a solid link between abnormal brain structural network connectivity and altered cognition and emotion condition in TLE patients. This result offers a complementary understanding of neuropathology mechanism of TLE and its related cognition alteration, which may be helpful for clinical diagnosis and prognosis evaluation.Acknowledgements
This work was supported by the Natural Science Foundation of China (Grant No. 82160326).References
[1] HU J, SI Y, ZHOU D, et al. Prevalence and treatment gap of active convulsive epilepsy: a large community-based survey in rural West China [J]. Seizure, 2014, 23(5): 333-7.
[2] STRETTON J, POPE R A, WINSTON G P, et al. Temporal lobe epilepsy and affective disorders: the role of the subgenual anterior cingulate cortex [J]. Journal of Neurology, Neurosurgery & Psychiatry, 2015, 86(2): 144-51.
[3] WANG Z-M, WEI P-H, ZHANG M, et al. Diffusion spectrum imaging predicts hippocampal sclerosis in mesial temporal lobe epilepsy patients [J]. Annals of Clinical and Translational Neurology, 2022, 9(3): 242-52.
[4] SCHEFFER I E, BERKOVIC S, CAPOVILLA G, et al. ILAE classification of the epilepsies: Position paper of the ILAE Commission for Classification and Terminology [J]. Epilepsia, 2017, 58(4): 512-21.
[5] STASENKO A, LIN C, BONILHA L, et al. Neurobehavioral and Clinical Comorbidities in Epilepsy: The Role of White Matter Network Disruption [J]. The Neuroscientist, 0(0): 10738584221076133.
Figures