5206
In vivo γ-aminobutyric acid alterations as a biomarker of the therapeutic effect of MRI-negative temporal lobe epilepsy1The Second Affiliated Hospital, Medical College of Shantou University, Shantou, China, 2The Second Affiliated Hospital of Xiamen Medical College, Xiamen, China, 3GE Healthcare, Beijing, Beijing, China
Synopsis
Keywords: Epilepsy, Molecular Imaging, therapeutic effect
Current diagnosis of MRI-negative TLE relies on clinical history and EEG or IEEG. However, IEEG is invasive and fails to monitor therapeutic effects dynamically. It is necessary to screen for effective biomarkers. We used MEGA-PRESS technique to investigate role of GABA and other metabolic alterations in TLE. We demonstrated that GABA, NAA, NAA+NAAG, and Glu levels in MTL were significantly different between epileptic and contralateral sides, and increasing index of GABA values is associated with increasing index of seizure frequency. These findings suggested that GABA is an effective biomarker for lateralization and therapeutic effect monitoring in patients with MRI-negative TLE.Abstract
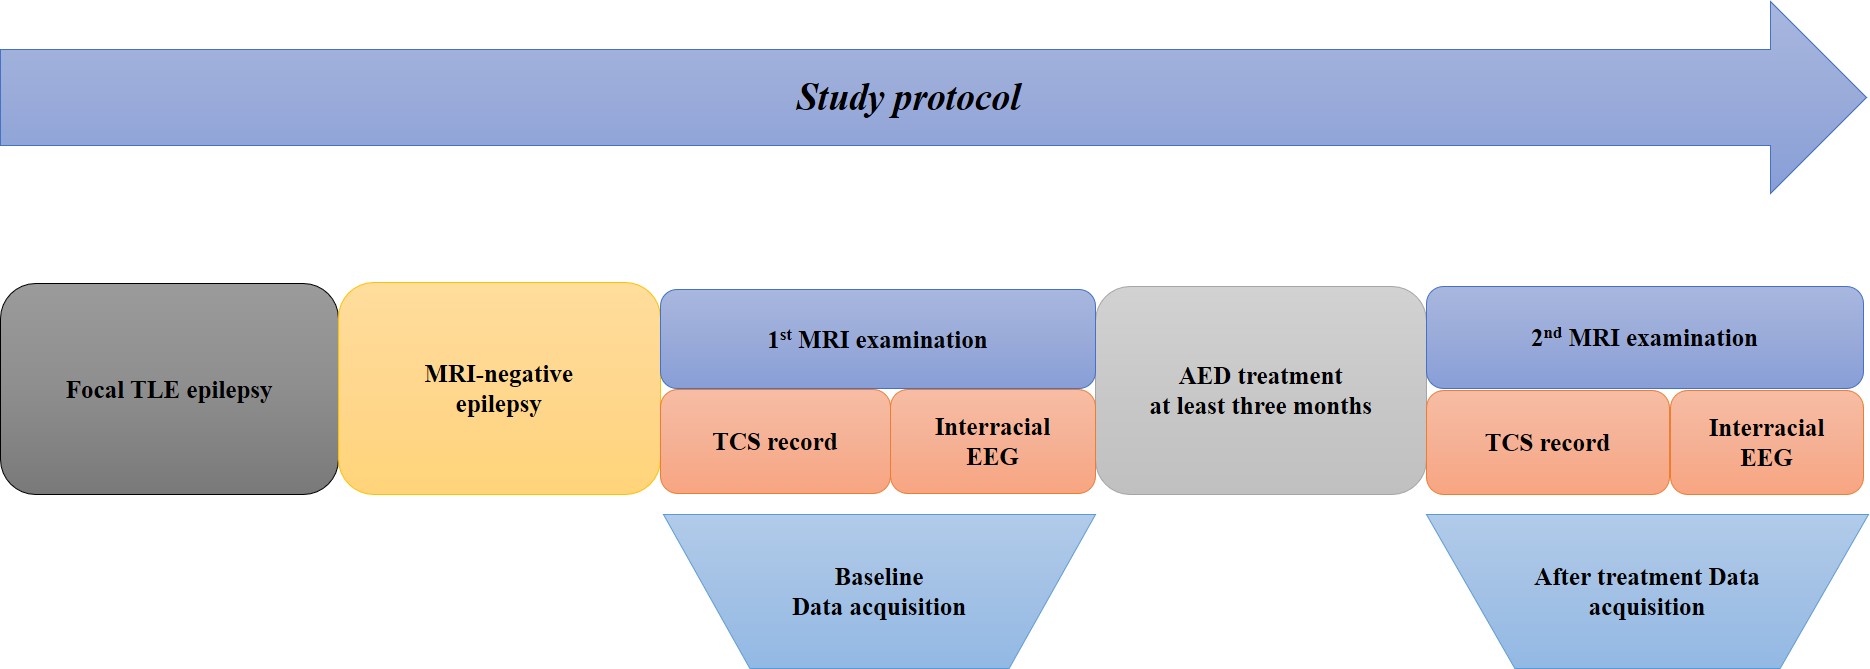
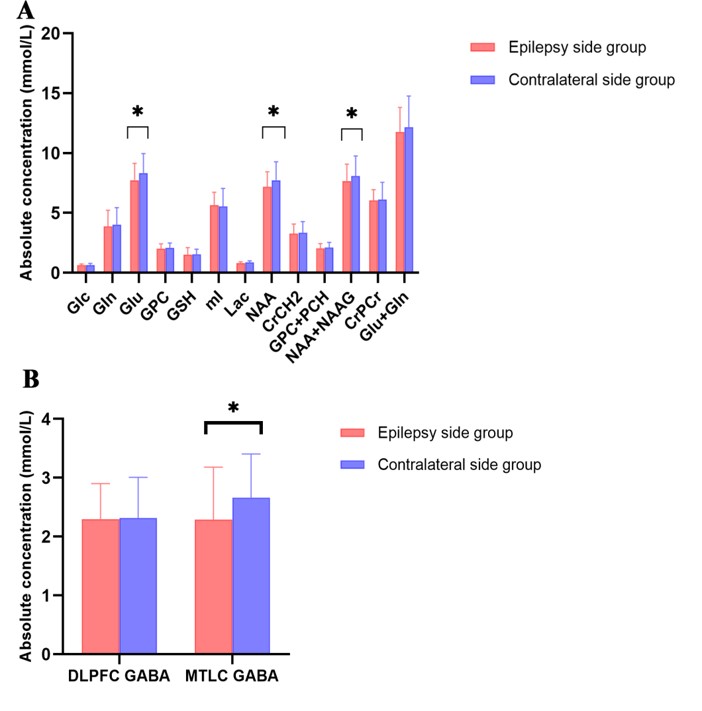
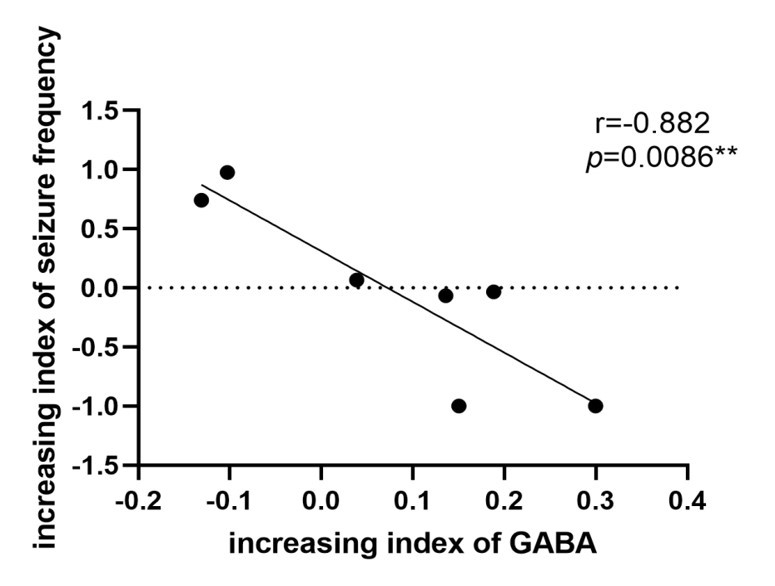
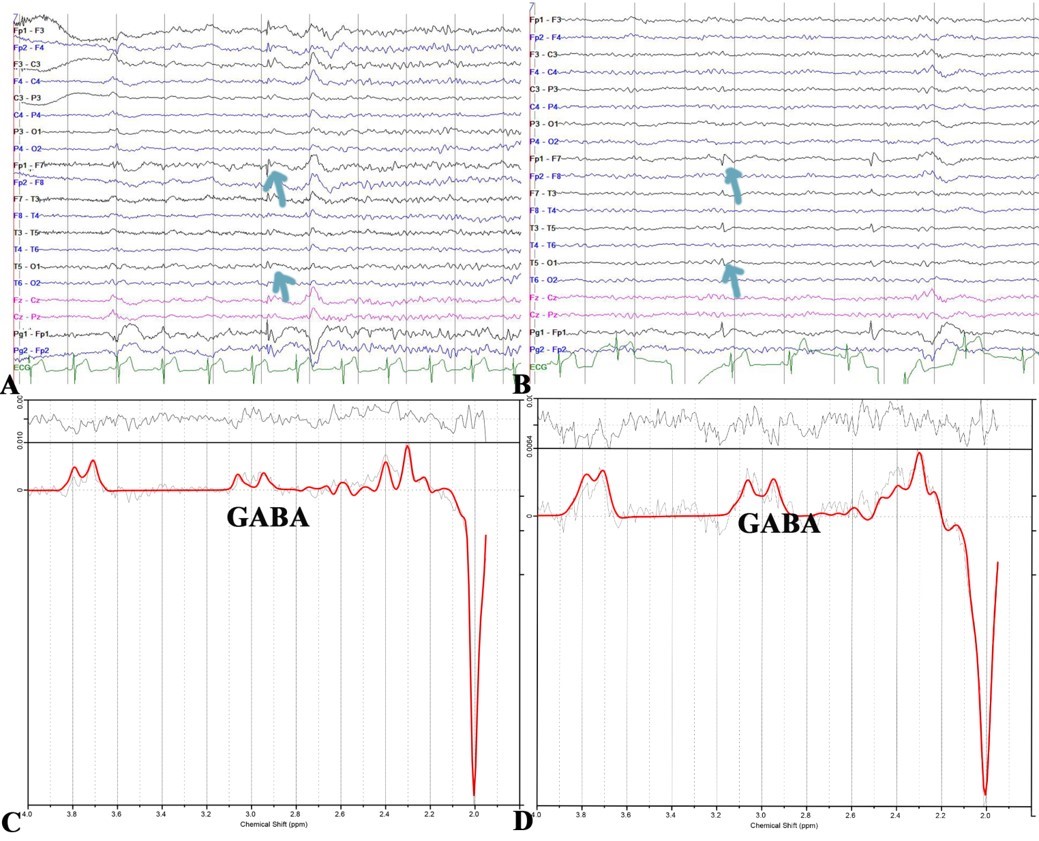
Background: Temporal lobe epilepsy (TLE) is a common epileptic syndrome. Up to 30% of patients with TLE are magnetic resonance imaging (MRI)-negative. Moreover, 70% of patients with TLE have a high risk of developing drug resistance1. To this end, electroencephalography (EEG) and intracranial EEG (IEEG), especially the latter, are essential tools for the location and lateralization of MRI-negative TLE epileptic foci. However, IEEG is invasive, and EEG and IEEG fail to dynamically monitor therapeutic effects2. Despite verifying proton magnetic resonance spectroscopy (1H-MRS) for focal localization in MRI-negative TLE patients, it is necessary to reveal underlying metabolic changes and screen for effective biomarkers for therapeutic effect monitoring3. Previous studies have demonstrated that γ-aminobutyric acid (GABA) has an important role in the mechanism and treatment of epilepsy4. Utilizing J-difference spectral editing approach, MEGA-PRESS5 has been the most widely applied technique for noninvasive GABA imaging, and has been validated by correlation with chromatographic measurements of GABA6. Therefore, in this study, we adopted MEGA-PRESS to investigate the role of GABA and other metabolites level alterations in the mesial temporal lobe (MTL) and dorsolateral prefrontal cortex (DLPFC) in patients with MRI-negative TLE. We aimed to explore the association of metabolite levels with age, onset age of epilepsy, duration of epilepsy, tonic-clonic seizure (TCS) frequency, and interval days since the most recent seizure. Furthermore, we also explored the correlation between metabolite levels and epileptic foci suggested by video-EEG. Methods: 37 patients (14 women) and 20 health control (11 women) were enrolled in this study. All MRI examinations were performed on a 3.0T MRI scanner (MR750w; GE Healthcare, Milwaukee, WI, USA). MEGA-PRESS sequence was acquired with following parameters: TR/TE = 1800/68 ms; FOV = 24 mm; slice thickness = 20 mm; NEX = 8. GABA and other metabolites levels were further calculated using LCModel software (linear combination model) (http://www.lcmodel.com). Figure 1 shows the diagram of the study protocol. Metabolite level differences in the epileptic and contralateral sides on the MTL and DLPFC were compared using paired t-test. Figure 2 show this part results. Pearson correlation coefficient (PCC) was calculated to analyze the association of GABA level with clinical factors including TCS frequency. Moreover, we followed up above patients to obtain reexamination data from 6 patients with an interval of at least three months, and analyzed the correlation between increasing index of TCS frequency and increasing index of GABA in the region of interest. Figure 3 show this part results. P-value < 0.05 was considered statistically significant. Results: We found that GABA levels significantly decreased in the epileptic side (2.292 ± 0.890), compared with the contralateral side (2.662 ± 0.742, P = 0.029*) in MTL. N-acetylaspartate (NAA) levels were significantly lower in the epileptic side (7.284 ± 1.314) than that in the contralateral side (7.655 ± 1.549, P = 0.034*). NAA + N-acetylaspartylglutamate (NAAG) levels significantly decreased in the epileptic side (7.668 ± 1.406), compared with the contralateral side (8.086 ± 1.675, P = 0.032*). Glutamate (Glu) levels significantly decreased in the epileptic side (7.773 ± 1.428), compared with the contralateral side (8.245 ± 1.616, P = 0.040*). Last but not least, in the prospective drug effect monitoring analysis, a strong negative correlation was found between increasing index of GABA values and increasing index of seizure frequency in epileptogenic MTL (r = -0.882, P = 0.008**). Figure 4 demonstrates the consistency of GABA values alterations in epileptogenic MTL with EEG epileptic wave frequency in a same follow-up patient. There were no tonic-clonic seizures detected for three months after treatment. Conclusion: To the best of our knowledge, this is the first study to investigate in vivo MTL and DLPFC GABA levels in MRI-negative TLE using MEGA-PRESS technique. This is also the largest study of GABA levels in MRI-negative TLE measured with MRS to date. For the first time, we have used GABA, an important inhibitory neurotransmitter, as a biomarker of epilepsy therapeutic efficacy and have demonstrated the critical role of neuronal excitation/inhibition imbalance in localization of epileptogenic zone and monitoring of efficacy dynamically. Effective biomarkers could substantially improve the management of people with epilepsy and could lead to individualized and effective treatment, rather than just symptomatic treatment. Our results demonstrated that GABA, NAA, NAA+NAAG, and Glu levels on the MTL are able to refer the localization in MRI-negative TLE. More importantly, the increasing index of GABA level on the epileptogenic MTL, probably indicating the neuronal imbalance of excitation and inhibition, is associated with increasing index of seizure frequency. These findings suggested that GABA level in the MTL can be a specific and effective biomarker for lateralization and therapeutic effect monitoring in MRI-negative TLE.Acknowledgements
We thank GE Healthcare for assistance in resolving some technical MRI-related issues and providing relevant consultation. We wish to thank the participants and their families for their contribution to our research.References
1. Muhlhofer W, Tan Y-L, Mueller SG, Knowlton R. MRI-negative temporal lobe epilepsy-What do we know? Epilepsia. 2017;58(5):727-742. doi:10.1111/epi.13699
2. Thijs RD, Surges R, O'Brien TJ, Sander JW. Epilepsy in adults. Lancet. 2019;393(10172):689-701. doi:10.1016/S0140-6736(18)32596-0
3. Pitkänen A, Löscher W, Vezzani A, et al. Advances in the development of biomarkers for epilepsy. The Lancet Neurology. 2016;15(8):843-856. doi:10.1016/S1474-4422(16)00112-5
4. Treiman DM. GABAergic mechanisms in epilepsy. Epilepsia. 2001;42 Suppl 3
5. Mescher M, Merkle H, Kirsch J, Garwood M, Gruetter R. Simultaneous in vivo spectral editing and water suppression. NMR In Biomedicine. 1998;11(6):266-272.
6. Bielicki G, Chassain C, Renou JP, et al. Brain GABA editing by localized in vivo (1)H magnetic resonance spectroscopy. NMR In Biomedicine. 2004;17(2):60-68.
Figures