5200
N-acetylaspartate and myo-inositol provide complementary information for lateralization of mesial temporal lobe epilepsy1School of Biomedical Engineering, Shanghai Jiao Tong University, Shanghai, China, 2Department of Nuclear Medicine, Ruijin Hospital, Shanghai Jiao Tong University School of Medicine, Shanghai, China, 3Beckman Institute for Advanced Sciences and Technology, University of Illinois at Urbana Champaign, Urbana, IL, United States, 4Department of Electrical and Computer Engineering, University of Illinois at Urbana Champaign, Urbana, IL, United States, 5National Center for Supercomputing Applications, University of Illinois at Urbana Champaign, Urbana, IL, United States
Synopsis
Keywords: Epilepsy, Metabolism
Lateralization of drug refractory mesial temporal lobe epilepsy can be challenging for routine MR scans at 3.0T. Exogenous and radioactive tracer 18F-FDG has been widely reported to aid the lateralization of MR unidentifiable epileptic hippocampus. 1H-MRSI holds promise to provide endogenous metabolic information of the epileptogenic zone. This study demonstrated the feasibility of fast high-resolution mapping of NAA/Cr, mIn/Cr and mIn/NAA, and investigated their associations with the FDG uptake. Our experimental results showed that NAA and mIn were independently sensitive to metabolic changes in hippocampal sclerosis, providing complementary information for temporal lobe epilepsy lateralization.Introduction
Accurate detection of epileptogenic zone (EZ) is important for successful presurgical planning for drug-resistant epilepsy patients1. The most common pathology of EZ in mesial Temporal lobe epilepsy (mTLE) is hippocampal sclerosis (HS)2, 3, which is histologically characterized by neuronal loss and gliosis4, 5. However, up to 34% of TLE patients do not have MRI identifiable lesions (MR-negative epilepsy), which presents a challenge for the up to 34% of TLE patients do not have MRI identifiable lesions (MR-negative epilepsy), which complicates the presurgical workup6. Exogenous and radioactive tracer 18F-fluorodeoxy-D-glucose (18F-FDG), reflective of cellular glucose uptake, has been widely reported to aid the lateralization of MR-negative epilepsy7, 8. 1H MRSI measures endogenous metabolites, including NAA, a marker of neuronal integrity and mitochondrial dysfunction9-11, and myo-inositol (mIn), a marker of astrogliosis9-11. These metabolites have been widely reported as useful in the lateralization or detection of epileptic lesions10, 12. In this study, with the fast, high-resolution MRSI enabled by SPICE (SPectroscopic Imaging by exploiting spatiospectral CorrElation)13 and simultaneous 18F-FDG PET on a PET/MR scanner, we investigated the association between endogenous metabolism from 1H-MRSI and exogenous metabolism from 18F-FDG PET, and evaluated the feasibility of the combination of NAA and mIn in the lateralization of epileptogenic hippocampus.Materials and Method
Data acquisition:In this IRB-approved study, forty-four drug-resistant unilateral mTLE patients were recruited. All patients received comprehensive examinations, including neurologic evaluation, video-EEG, diagnostic MRI, PET, and SEEG. The comprehensive information was deliberated as gold standard of lateralization. The MRI and PET scans were performed on an integrated 3T PET/MR scanner (Biograph mMR; Siemens Healthcare, Erlangen, Germany). The MR experimental protocols included T1-weighted MPRAGE (1.0×1.0×1.0 mm3, TR/TE/TI: 1900/2.44/900 ms, FOV 256×256 mm2, 192 slices,), FLAIR (0.4×0.4×3.0 mm3, TR/TE/TI 8460/92/2433 ms, FOV 220×220 mm2, 45 slices) and high-resolution MRSI scans using SPICE (2.0×3.0×3.0 mm3, TR/TE: 160/1.6 ms, FOV 240×240×96 mm3 with 9.5 minutes or FOV 240×240×160 mm3 with 12.5 minutes); The PET images were obtained at 30~50 minutes post a bolus injection of 18F-FDG (mean dose of 3.7 MBq/kg, matrix size 344×344, voxel size 2.0×2.0×2.0 mm3, 127 slices, 15 minutes).Data processing: Reconstruction of the MRSI spatiospectral functions was performed using a union-of-subspaces model, incorporating pre-learned spectral basis functions as described in previous publications14-16. Then, spectral quantification was done using an improved LCModel-based algorithm that incorporated both spatial and spectral priors16, which generated metabolite maps of NAA, Cho, Cr, and mIn. FDG uptake (SUVRs) were obtained using intensity normalization by cerebellar scaling of 18F-FDG PET images.
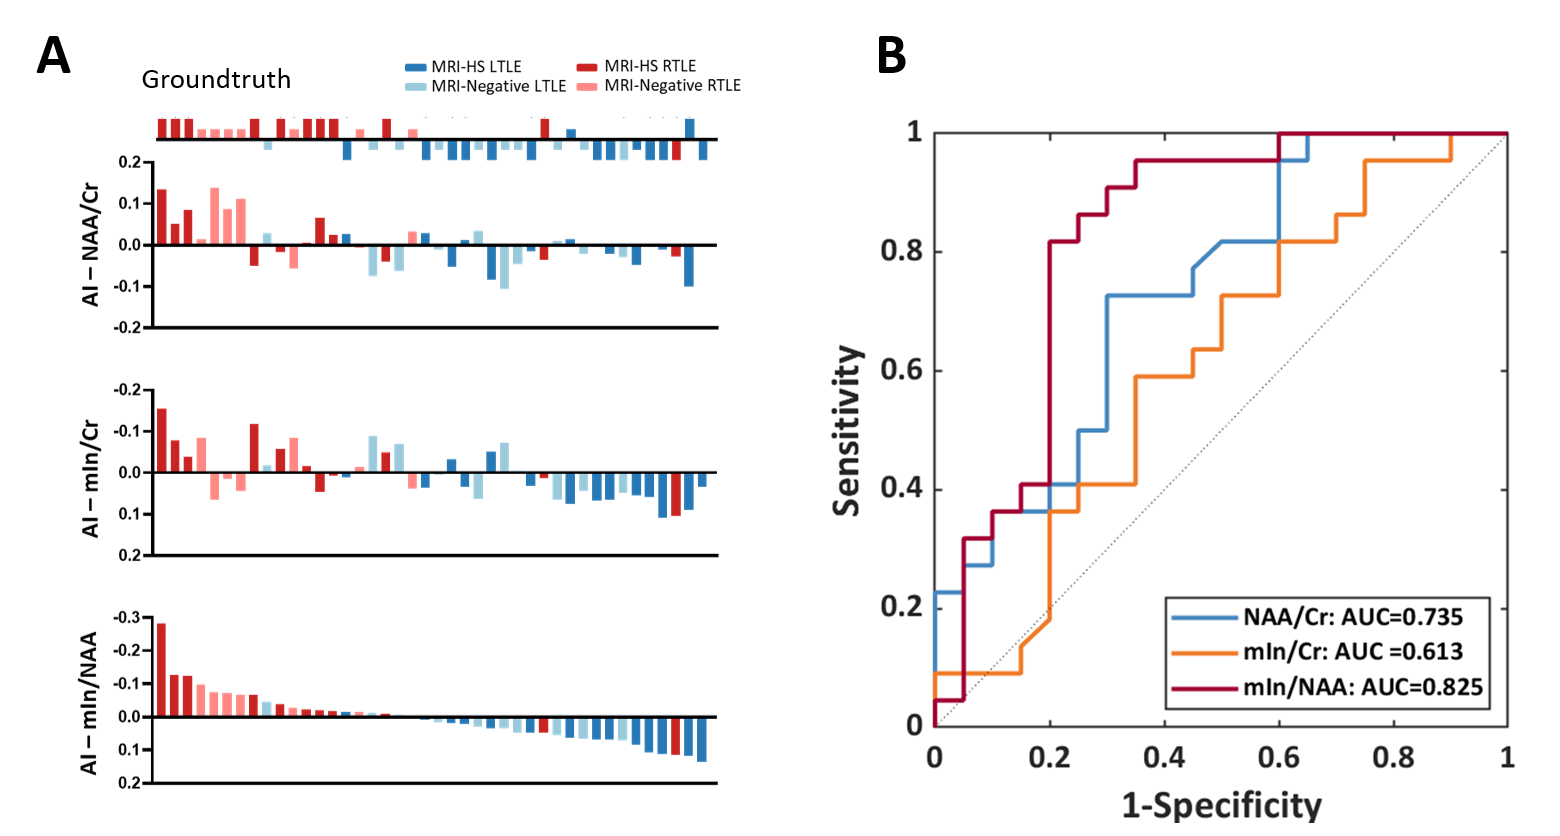
Statistical analysis: Hippocampi were segmented from the T1-weighted image using FreeSurfer v7.0 package (https://surfer.nmr.mgh.harvard.edu). The hippocampal masks were then used to extract the metabolic measurement of NAA/Cr, mIn/Cr, mIn/NAA, and SUVR. The Wilcoxon signed-rank tests were applied to compare these metabolic measurements between the ipsilateral and contralateral hippocampi in the TLE groups. Spearman’s correlations were used to assess the associations between NAA/Cr, mIn/Cr, and FDG uptake. For lateralization, we also quantified the left to right hippocampal asymmetry index (AI) with the following formula: AI = (left-right)/(left+right). The lateralization accuracies of metabolic AIs were then evaluated using logistic regression models with a leave-one-out cross-validation strategy.
Results and Discussion
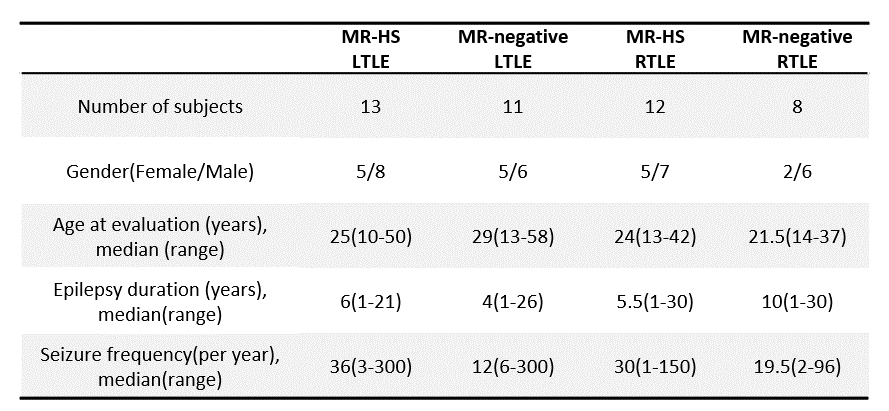
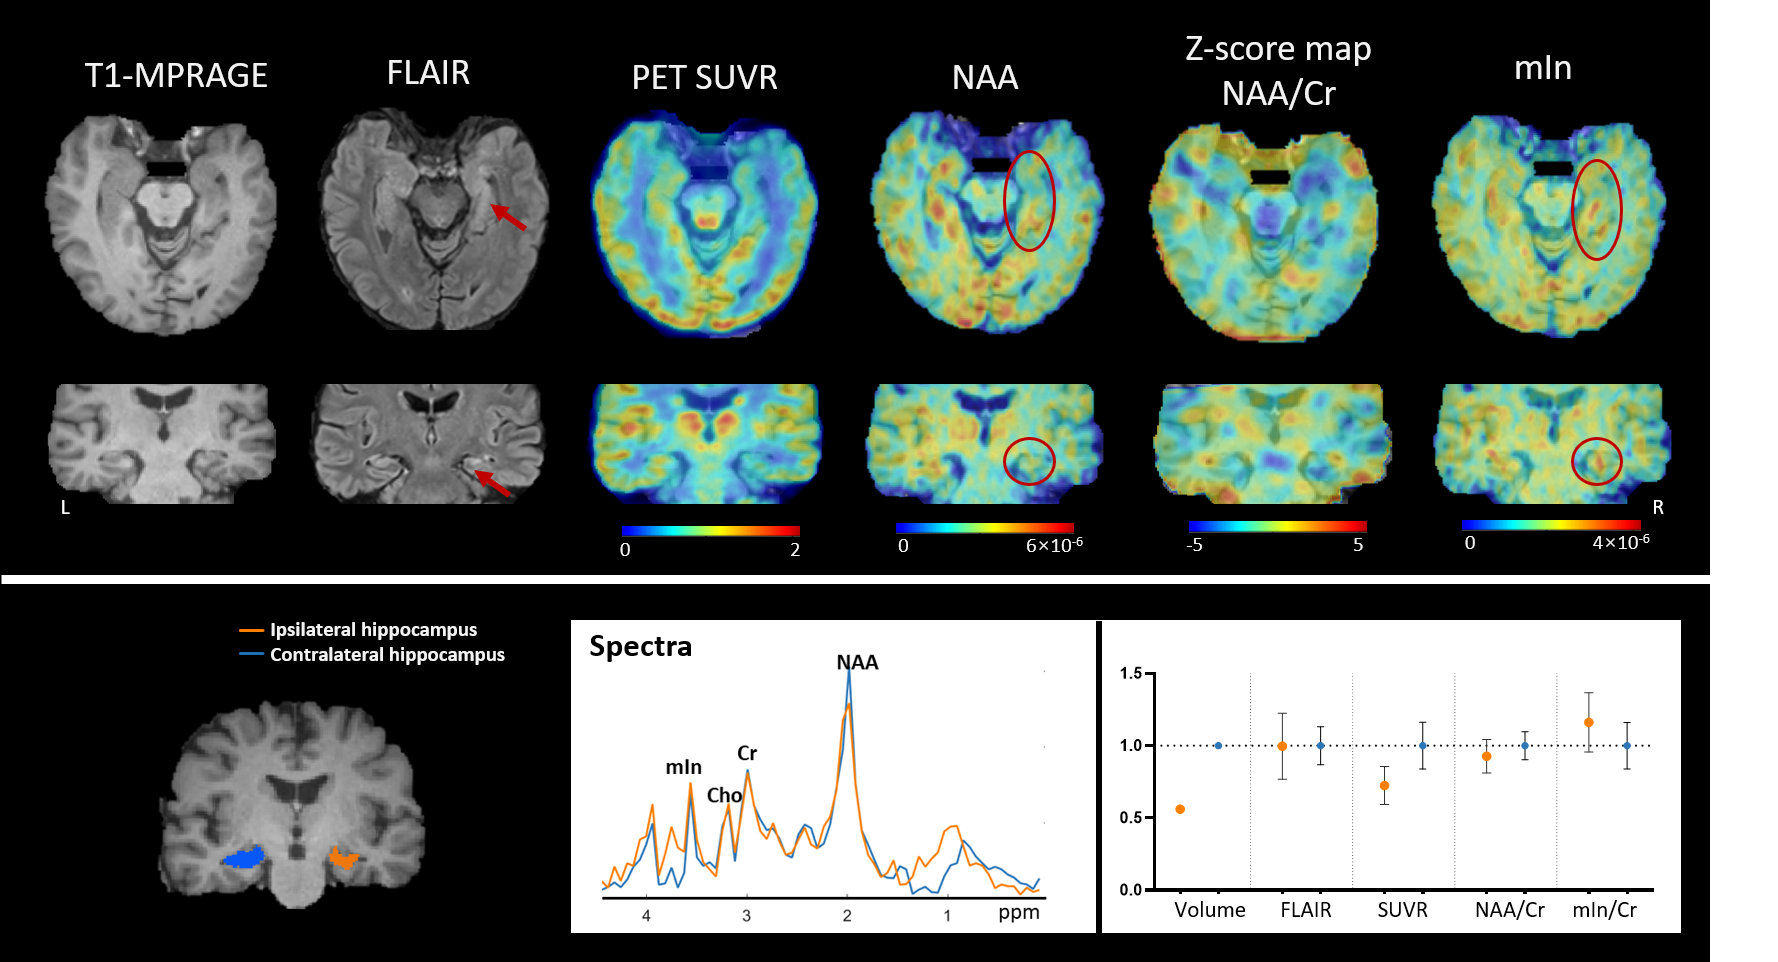
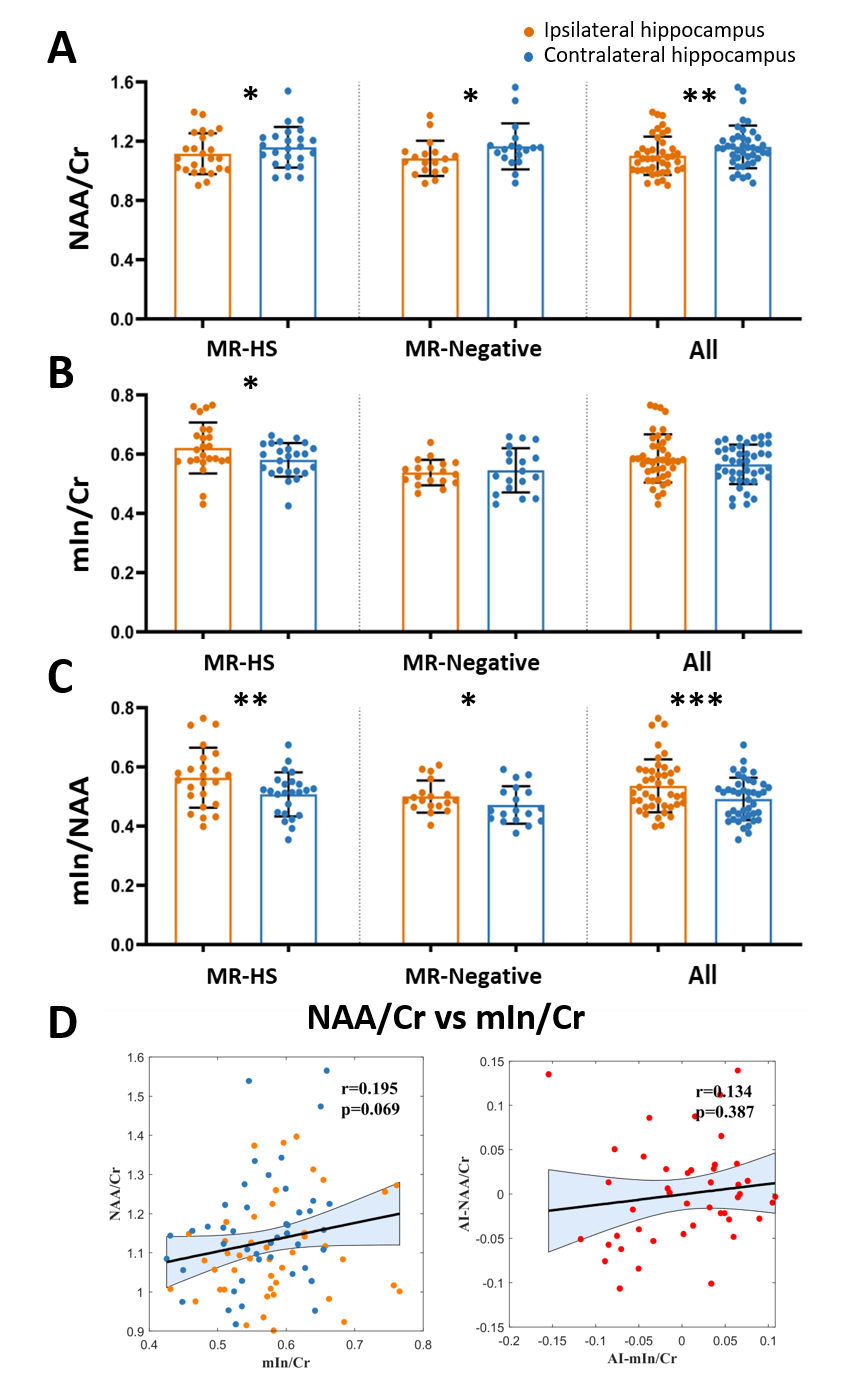
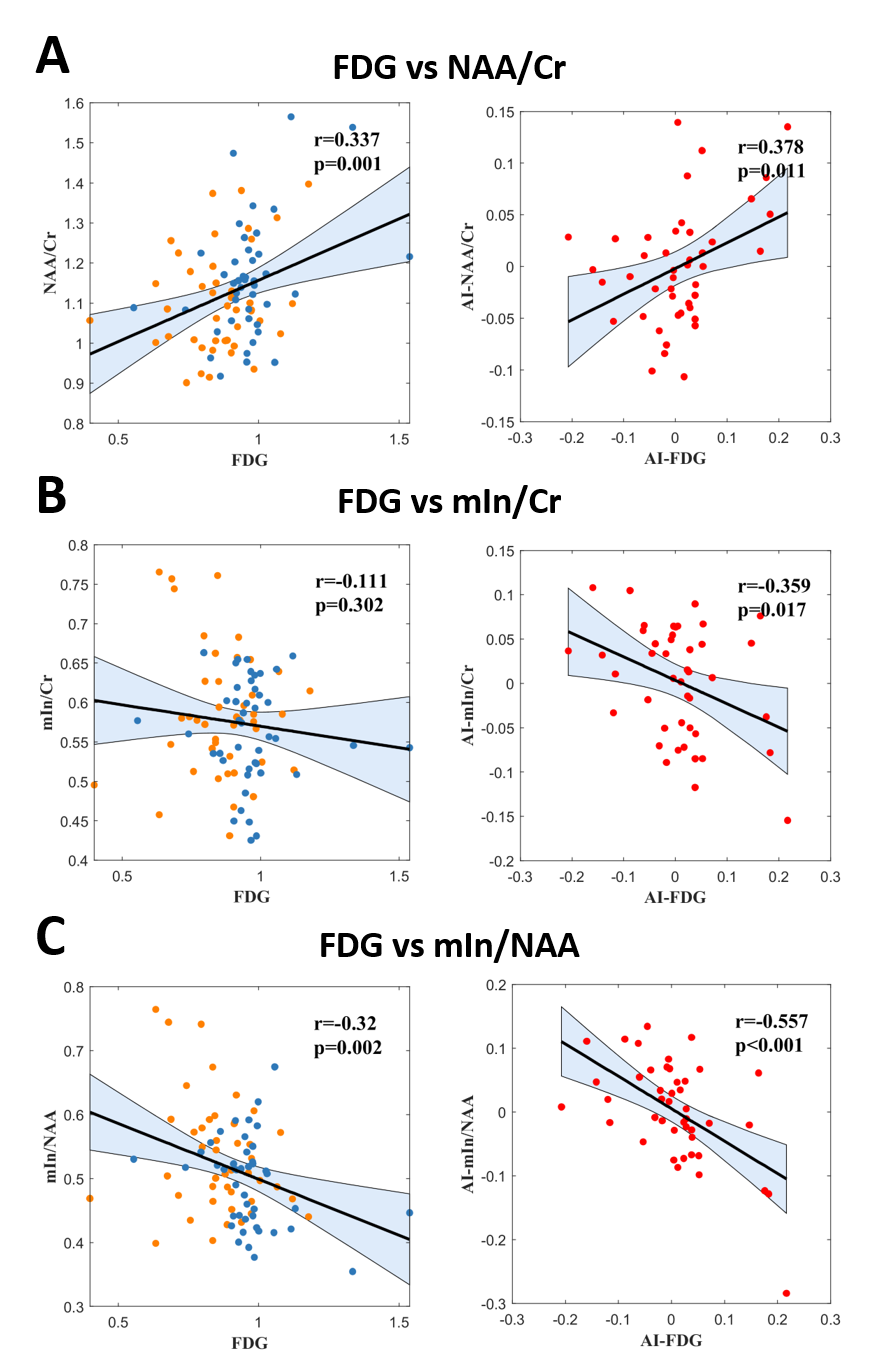
Patient demographics are listed in Table 1, showing routine MR was able to lateralize 25/44 (57%) hippocampal sclerosis. In Figure 1, a representative MR-HS patient exhibited hippocampal atrophy and mild FLAIR hyperintensity in the left hippocampus, where decreased FDG uptake, decreased NAA, and increased mIn can be found in the left hippocampus, amygdala, and parahippocampus.Wilcoxon signed-rank tests revealed that ipsilateral hippocampi had decreased NAA/Cr not only in the MR-HS TLE (P = 0.028), but also in MR-negative TLE (P = 0.029) (Figure 2A), while mIn/Cr only showed significant increase in MR-HS TLE (P = 0.01) (Figure 2B). Notably, the mIn/NAA ratio was even stronger in differentiating ipsi- from contra-lateral hippocampi in all TLE patients (MR-HS, P = 0.004; MR-negative, P = 0.05; All subjects, P = 0.0006) (Figure 2C), while hippocampal NAA/Cr and mIn/Cr did not show significant associations (Figure 2D). NAA was positively correlated with FDG uptake, whereas mIn tended to show mild negative correlation with FDG uptake (Figure 3), indicating that NAA and mIn could serve as complementary markers that provide information on different aspects of tissue damage. Further, using logistic regression models, mIn/NAA showed the highest AUC of 0.825 in lateralization of MR negative TLE compared with NAA/Cr (AUC = 0.735) and mIn/Cr (AUC = 0.613) (Figure 4).
Conclusion
Our findings suggest that by measuring endogenous NAA and mIn maps, fast high-resolution MRSI may provide a non-invasive, tracer-free imaging tool to lateralize the epileptogenic zone for temporal lobe epilepsy.Acknowledgements
N/AReferences
1. Spencer DD, Gerrard JL, Zaveri HP. The roles of surgery and technology in understanding focal epilepsy and its comorbidities Lancet Neurol. 2018 Apr;17:373-382.
2. Cendes F, Sakamoto AC, Spreafico R, Bingaman W, Becker AJ. Epilepsies associated with hippocampal sclerosis Acta Neuropathol. 2014 Jul;128:21-37.
3. Malmgren K, Thom M. Hippocampal sclerosis--origins and imaging Epilepsia. 2012 Sep;53 Suppl 4:19-33.
4. Margerison JH CJ. Epilepsy and the temporal lobes. A clinical, electroencephalographic and neuropathological study of the brain in epilepsy, with particular reference to the temporal lobes Brain. 1966;89:499-530.
5. Thom M. Review: Hippocampal sclerosis in epilepsy: a neuropathology review Neuropathol Appl Neurobiol. 2014 Aug;40:520-543.
6. Davis KA, Nanga RP, Das S, Chen SH, Hadar PN, Pollard JR, et al. Glutamate imaging (GluCEST) lateralizes epileptic foci in nonlesional temporal lobe epilepsy Sci Transl Med. 2015 Oct 14;7:309ra161.
7. Lamusuo S JL, Ylinen A, Kälviäinen R, Mervaala E, Haaparanta M, Jääskeläinen S, Partanen K, Vapalahti M, Rinne J . [18F]FDG-PET reveals temporal hypometabolism in patients with temporal lobe epilepsy even when quantitative MRI and histopathological analysis show only mild hippocampal damage. Arch Neurol. 2001;58:933-939.
8. Niu N, Xing H, Wu M, Ma Y, Liu Y, Ba J, et al. Performance of PET imaging for the localization of epileptogenic zone in patients with epilepsy: a meta-analysis. Eur Radiol. 2021 Feb 1.
9. Oz G, Alger JR, Barker PB, Bartha R, Bizzi A, Boesch C, et al. Clinical proton MR spectroscopy in central nervous system disorders. Radiology. 2014 Mar;270:658-679.
10. Pan JW, Kuzniecky RI. Utility of magnetic resonance spectroscopic imaging for human epilepsy. Quant Imaging Med Surg. 2015 Apr;5:313-322.
11. Petroff OA, Errante LD, Kim JH, Spencer DD. N-acetyl-aspartate, total creatine, and myo-inositol in the epileptogenic human hippocampus. Neurology. 2003 May 27;60:1646-1651.
12. Fernández-Vega N, Ramos-Rodriguez JR, Alfaro F, Barbancho M, García-Casares N. Usefulness of magnetic resonance spectroscopy in mesial temporal sclerosis: a systematic review. Neuroradiology. 2021 Sep;63:1395-1405.
13. Lam F, Liang ZP. A subspace approach to high-resolution spectroscopic imaging. Magn Reson Med. 2014 Apr;71:1349-1357.
14. Lam F, Ma C, Clifford B, Johnson CL, Liang ZP. High-resolution (1) H-MRSI of the brain using SPICE: Data acquisition and image reconstruction. Magn Reson Med. 2016 Oct;76:1059-1070.
15. Ma C, Lam F, Johnson CL, Liang ZP. Removal of nuisance signals from limited and sparse 1H MRSI data using a union-of-subspaces model. Magn Reson Med. 2016 Feb;75:488-497.
16. Li Y, Lam F, Clifford B, Liang ZP. A subspace approach to spectral qsuantification for MR spectroscopic imaging. IEEE Trans Biomed Eng. 2017 Oct;64:2486-2489.
Figures