5199
Combining MR Fingerprinting with Voxel-based Morphometric MRI Analysis to Reduce False Positives for Focal Cortical Dysplasia Detection
Zheng Ding1,2, Siyuan Hu2, Ting-Yu Su1,2, Joon Yul Choi1, Xiaofeng Wang3, Ken Sakaie4, Hiroatsu Murakami1, Hans-Juergen Huppertz5, Ingmar Blumcke1,6, Stephen Jones4, Imad Najm1, Dan Ma2, and Zhong Irene Wang1
1Epilepsy Center, Cleveland Clinic, Cleveland, OH, United States, 2Biomedical Engineering, Case Western Reserve University, Cleveland, OH, United States, 3Quantitative Health Science, Cleveland Clinic, Cleveland, OH, United States, 4Imaging Institute, Cleveland Clinic, Cleveland, OH, United States, 5Swiss Epilepsy Clinic - Klinik Lengg AG, Zurich, Switzerland, 6University of Erlangen-Nuremberg, Erlangen, Germany
1Epilepsy Center, Cleveland Clinic, Cleveland, OH, United States, 2Biomedical Engineering, Case Western Reserve University, Cleveland, OH, United States, 3Quantitative Health Science, Cleveland Clinic, Cleveland, OH, United States, 4Imaging Institute, Cleveland Clinic, Cleveland, OH, United States, 5Swiss Epilepsy Clinic - Klinik Lengg AG, Zurich, Switzerland, 6University of Erlangen-Nuremberg, Erlangen, Germany
Synopsis
Keywords: Epilepsy, MR Fingerprinting
We sought to improve focal cortical dysplasia (FCD) lesion detection by combining MR fingerprinting (MRF) with voxel-based morphometric MRI analysis. We acquired high-resolution MRF and T1w MPRAGE data from 29 patients and 47 age-and-gender-matched healthy controls. FCD probability maps were generated using the morphometric analysis program (MAP18). MRF T1 and T2 values in white matter were significantly higher in true-positive clusters than false-positive clusters. Using normalized MRF T1, T2, and cluster size as input, an SVM model was able to predict whether each cluster represents a true positive with high accuracy, demonstrating its potential contribution to clinical FCD detection workflow.Introduction
Focal cortical dysplasia (FCD) is one of the most common pathologies underlying MRI-negative epilepsy. Detection of FCD can often be assisted by voxel-based morphometric analysis for an increased yield1,2. However, false positives are commonly seen in post-processing results due to normal variants, imaging artifacts and registration errors, etc. Interpretation of post-processing results, therefore, still requires substantial efforts and prior experience. MR fingerprinting (MRF) is a recently developed novel technique to measure quantitative tissue properties not attainable in conventional MRI3, and has demonstrated effectiveness in distinguishing epileptic lesions in prior studies4,5. In this study, we aimed to improve automatic FCD detection by combing MRF features with voxel-based MRI processing to differentiate false positive (FP) clusters from true positive (TP) clusters, with the hypothesis that true positive (TP) clusters would have significantly higher MRF T1 and T2 values than FP clusters, due to the underlying pathology.Methods
3D whole-brain MRF scans were acquired on a 3T SIEMENS Prisma scanner from 29 patients with medically intractable focal epilepsy with pathologically confirmed FCD (1.2 mm3 isotropic voxels, scan time 10.4 min)4. A total of 47 age-and-gender-matched healthy controls (HCs) were also included. MRF T1 and T2 maps were reconstructed by matching the signal evolution pattern to a pre-defined simulation dictionary (Figure 1c,g). A T1w image data set was synthesized from the MRF T1 maps (Figure 1e). 3D lesion labels were drawn on synthetic T1w images (Figure 1d). All images from patients and HCs were co-registered into the MNI space using symmetric image normalization method (SyN) in advanced normalization tools (ANTs)6. The warping transformation from T1w images was applied to T1 and T2 maps. Morphometric analysis with MAP18 (v2018) was performed for GM/WM segmentation and voxel-wise lesion prediction, using T1w 3D magnetization-prepared rapid acquisition with gradient echo (MPRAGE) scans as input7 (Figure 1b,f). The output of MAP18 neural network prediction (valNN)7 were in the form of single or multiple clusters with voxel-wise lesion probability value in the MNI space (Figure 1h). Clusters were thresholded with a minimal size of 15 voxels. The average MRF T1 and T2 values were calculated in each cluster from the valNN output, for GM and WM separately. Normalized MRF T1 and T2 was calculated through dividing the average MRF T1 and T2 of each cluster by the mean MRF T1 and T2 within the corresponding ROI across all HCs. Clusters that overlapped with the manual lesion labels were considered TP; while clusters with no overlap were considered FP. Two-sample t-tests were performed to compare MRF T1 and T2 values between TP and FP clusters.A support vector machine (SVM) model with linear kernel method was trained in Python Scikit-learn and Imbalanced-learn to separate TP and FP clusters, using MRF data (T1 and T2 values in GM and WM) and cluster volume (in GM and WM) as input. Performance of the classifier was evaluated by 10 fold cross-validation, in which TP clusters in the training folds were over-sampled with Synthetic Minority Oversampling Technique (SMOTE) based on 5 nearest neighbors to address class imbalance. Receiver Operating Characteristic (ROC) curves were generated for each training/testing and averaged to produce an overall evaluation of the classifier. As a comparison, a threshold of 0.5 was applied to the valNN output lesion probability map (without MRF data); the above-threshold clusters that overlapped with the lesion ROI were considered TP, while the below-threshold clusters that overlapped with the lesion ROI were considered FN.Results
For the 29 patients with FCD (23 pathologically confirmed, 6 radiologically confirmed), 9 had type IIb, 7 had type IIa, 11 had mild malformation of cortical development (mMCD) and 2 had Mild malformation of cortical development with oligodendroglial hyperplasia and epilepsy (MOGHE). As shown in Figure 2a-b, in WM, the average T1 was significantly higher for TP (mean±SD=1033±121ms, n=17) than FP clusters (mean±SD=964±103 ms, n=224, p<0.05). The average T2 was also significantly higher (mean±SD=48.3±3.8 ms) for TP than FP clusters (mean±SD=45.6±7.4ms, p<0.05). In GM, mean T1 and T2 were both not significantly different for TP and FP clusters. Normalized average T1 and T2 based on HC data showed consistent trend in significance (Figure 2c-d). The 10-fold cross-validation of a SVM model trained on un-normalized MRF data and cluster volume showed overall accuracy of 82% for separating TP and FP clusters, with sensitivity of 85.0% and specificity of 75.8% (mean AUC of ROC = 0.85, Figure 3a). SVM models trained on normalized MRF data and cluster volume achieved 87% classification accuracy for 10-fold cross-validation, with slightly higher sensitivity of 90.0% and specificity of 79.8% (mean AUC of ROC = 0.90, Figure 3b). Direct thresholding of the lesion probability map at 0.5 yields a lower sensitivity at 47.5% and comparable specificity of 73.7% as compared to the SVM model performance using MRF inputs.Conclusion
Our data showed the addition of MRF data can improve the identification of true-positive and false-positive clusters from voxel-based morphometric analysis based on conventional MRI. This work demonstrates the potential of using MRF and machine learning techniques to aid epileptic lesion detection, which is a crucial part of noninvasive presurgical evaluation of individuals with medically intractable epilepsy.Acknowledgements
This study was supported by the National Institutes of Health (NIH) grants R01 NS109439 and R21 EB026764.References
- Huppertz, H.-J., Wellmer, J., Staack, A.M., Altenmüller, D.-M., Urbach, H. and Kröll, J. (2008), Voxel-based 3D MRI analysis helps to detect subtle forms of subcortical band heterotopia. Epilepsia, 49: 772-785. https://doi.org/10.1111/j.1528-1167.2007.01436.x
- Wang, Z. I., Jones, S. E., Jaisani, Z., Najm, I. M., Prayson, R. A., Burgess, R. C., Krishnan, B., Ristic, A., Wong, C. H., Bingaman, W., Gonzalez-Martinez, J. A., & Alexopoulos, A. V. (2015). Voxel-based morphometric magnetic resonance imaging (MRI) postprocessing in MRI-negative epilepsies. Ann Neurol, 77(6), 1060–1075. https://doi.org/10.1002/ana.24407
- Ma, D., Gulani, V., Seiberlich, N., Liu, K., Sunshine, J. L., Duerk, J. L., & Griswold, M. A. (2013). Magnetic resonance fingerprinting. Nature, 495(7440), 187–192. https://doi.org/10.1038/nature11971
- Ma, D., Jones, S. E., Deshmane, A., Sakaie, K., Pierre, E. Y., Larvie, M., McGivney, D., Blümcke, I., Krishnan, B., Lowe, M., Gulani, V., Najm, I., Griswold, M. A., & Wang, Z. I. (2019). Development of high-resolution 3D MR fingerprinting for detection and characterization of epileptic lesions. Journal of Magnetic Resonance Imaging, 49(5), 1333–1346. https://doi.org/10.1002/jmri.26319
- Liao C, Wang K, Cao X, Li Y, Wu D, Ye H, Ding Q, He H, Zhong J. (2018). Detection of Lesions in Mesial Temporal Lobe Epilepsy by Using MR Fingerprinting. Radiology 288, 804–812.
- Avants, B. B., Tustison, N. J., Song, G., Cook, P. A., Klein, A., & Gee, J. C. (2011). A reproducible evaluation of ANTs similarity metric performance in brain image registration. NeuroImage, 54(3), 2033–2044. https://doi.org/10.1016/j.neuroimage.2010.09.025
- David, B., Kröll-Seger, J., Schuch, F., Wagner, J., Wellmer, J., Woermann, F., Oehl, B., Van Paesschen, W., Breyer, T., Becker, A., Vatter, H., Hattingen, E., Urbach, H., Weber, B., Surges, R., Elger, C. E., Huppertz, H. J., & Rüber, T. (2021). External validation of automated focal cortical dysplasia detection using morphometric analysis. Epilepsia, 62(4), 1005–1021. https://doi.org/10.1111/epi.16853
Figures
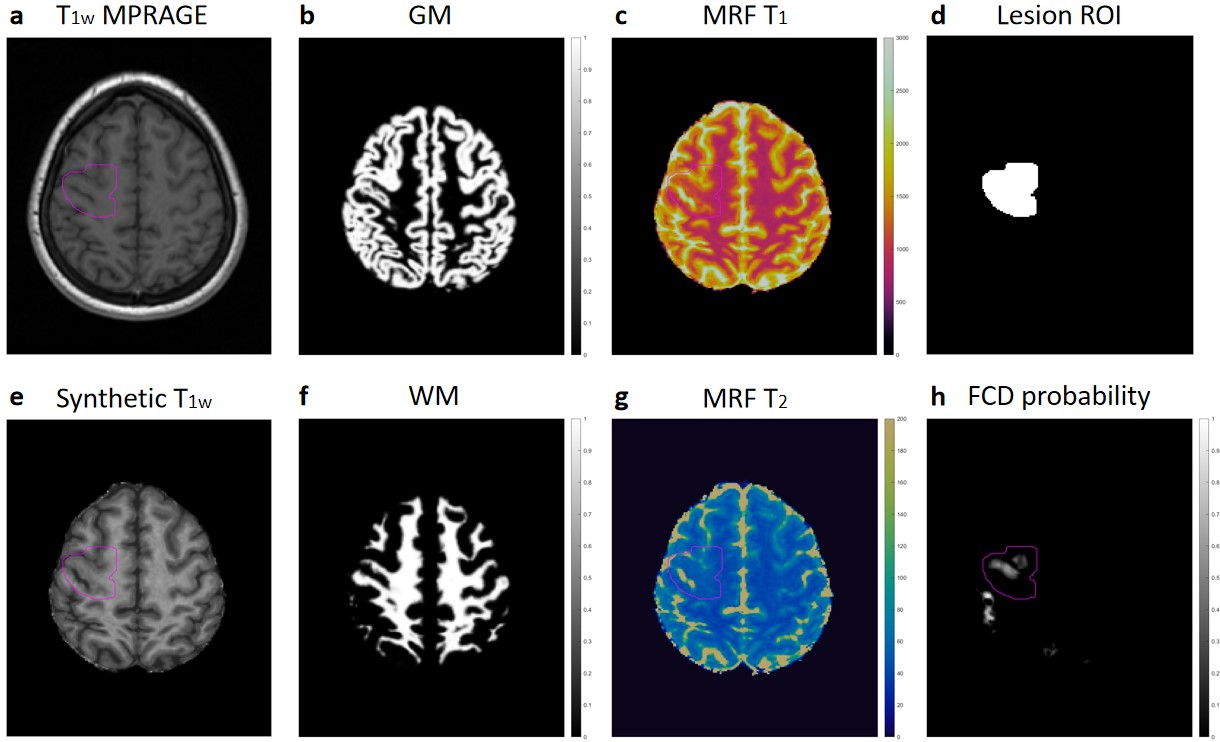
Figure 1: (a) T1w MPRAGE (input to MAP18). (b) MAP18 output GM map. (c) MRF T1 tissue property map. (d) Lesion label by expert reviewer. (e) Synthetic T1w image generated from MRF T1 map. (f) MAP18 output WM map. (g) MRF T2 tissue property map. (h) MAP18 output FCD probability map.
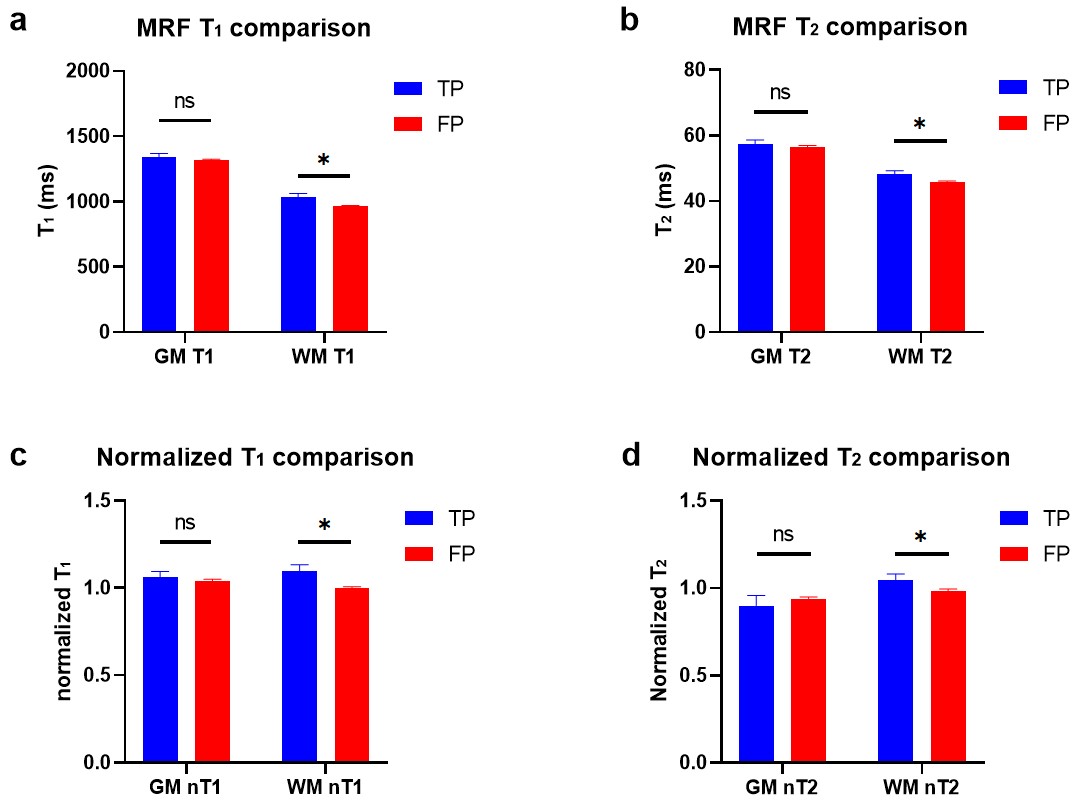
Figure 2: (a-b) MRF T1 and T2 comparison in TP and FP clusters. (c-d) Normalized T1 and T2 comparison in TP and FP clusters. Error bars show standard errors. *p<0.05, ns: non-significant.
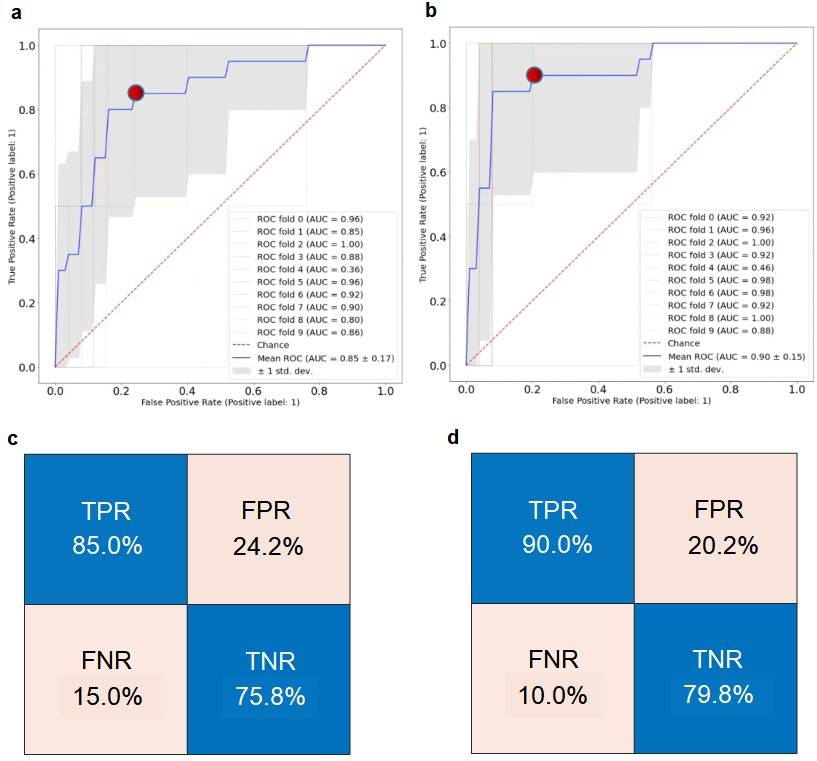
Figure 3: (a) Receiver Operating Characteristic (ROC) curve of the 10-fold cross-validation of SVM trained on un-normalized MRF data with volume. (b) ROC curve of the 10 fold cross-validation of SVM using normalized MRF data with volume. (c) Confusion matrix of the SVM in (a) corresponding to the threshold marked as red dot. (d) Confusion matrix of the SVM in (b) corresponding to the threshold marked as red dot.
DOI: https://doi.org/10.58530/2023/5199