5192
Recovery of T2 distribution from quantitative T2-weighted MRI with physically-driven deep learning1Faculty of Biomedical Engineering, Technion, Haifa, Israel
Synopsis
Keywords: Machine Learning/Artificial Intelligence, Relaxometry
Recovery of T2 distribution of tissue from MRI data acquired at multiple echo times has the potential to be used as a biomarker for the assessment of various pathologies, including stroke and epilepsy, investigation of neurodegenerative diseases, and tumor characterization. Current deep neural networks (DNN) for T2 distribution recovery are highly sensitive to variations in the acquisition parameters such as different echo times. We present a new physically-driven DNN model that encodes the TE acquisition parameters as part of its architecture. Our model accurately recovers the T2 distribution, regardless of variations in SNR and in the acquisition parameters.Introduction
Recovery of T2 distribution of tissue from MRI data acquired at multiple echo times can characterize more precisely than using a single relaxation time the different water pools present in the tissue [1]. The T2 distribution has the potential to be used as a biomarker for the assessment of various pathologies, including stroke and epilepsy, investigation of neurodegenerative diseases, and tumor characterization [2, 3]. Recently, several researchers have proposed to use supervised deep neural networks (DNN) in order to accelerate the recovery of the T2 distribution from the MRI signal and developed models that are robust to low SNR values. The input to the DNN is the observed signal, and the expected output is the prediction of the T2 relaxation times or the water-pool components’ fractions (e.g. MWF map) [4, 5]. The DNN models’ training is accomplished with simulated T2-weighted data from randomly-generated T2 distributions at physiologically-relevant ranges. The MRI signal is simulated using the extended phase graph (EPG) formalism [6] and the relevant T2 distribution: $$$s(TE_i) =\int EPG(TE_i, T_1, T_2, \alpha) p(T_2) dT_2$$$, where s is the MRI signal; TE is the relevant echo-time; T1 and T2 are a single relaxation time, and α is the flipping angle. Yet, these approaches are sensitive to variations in the MRI acquisition protocols such as the echo times (TEs). We present a physically-driven T2 (P2T2) DNN model for robust T2 distribution recovery. Our model encodes the full forward model of the system by taking as input the TE acquisition array in addition to the MRI signal and recovers the corresponding T2 distribution as output.Methods
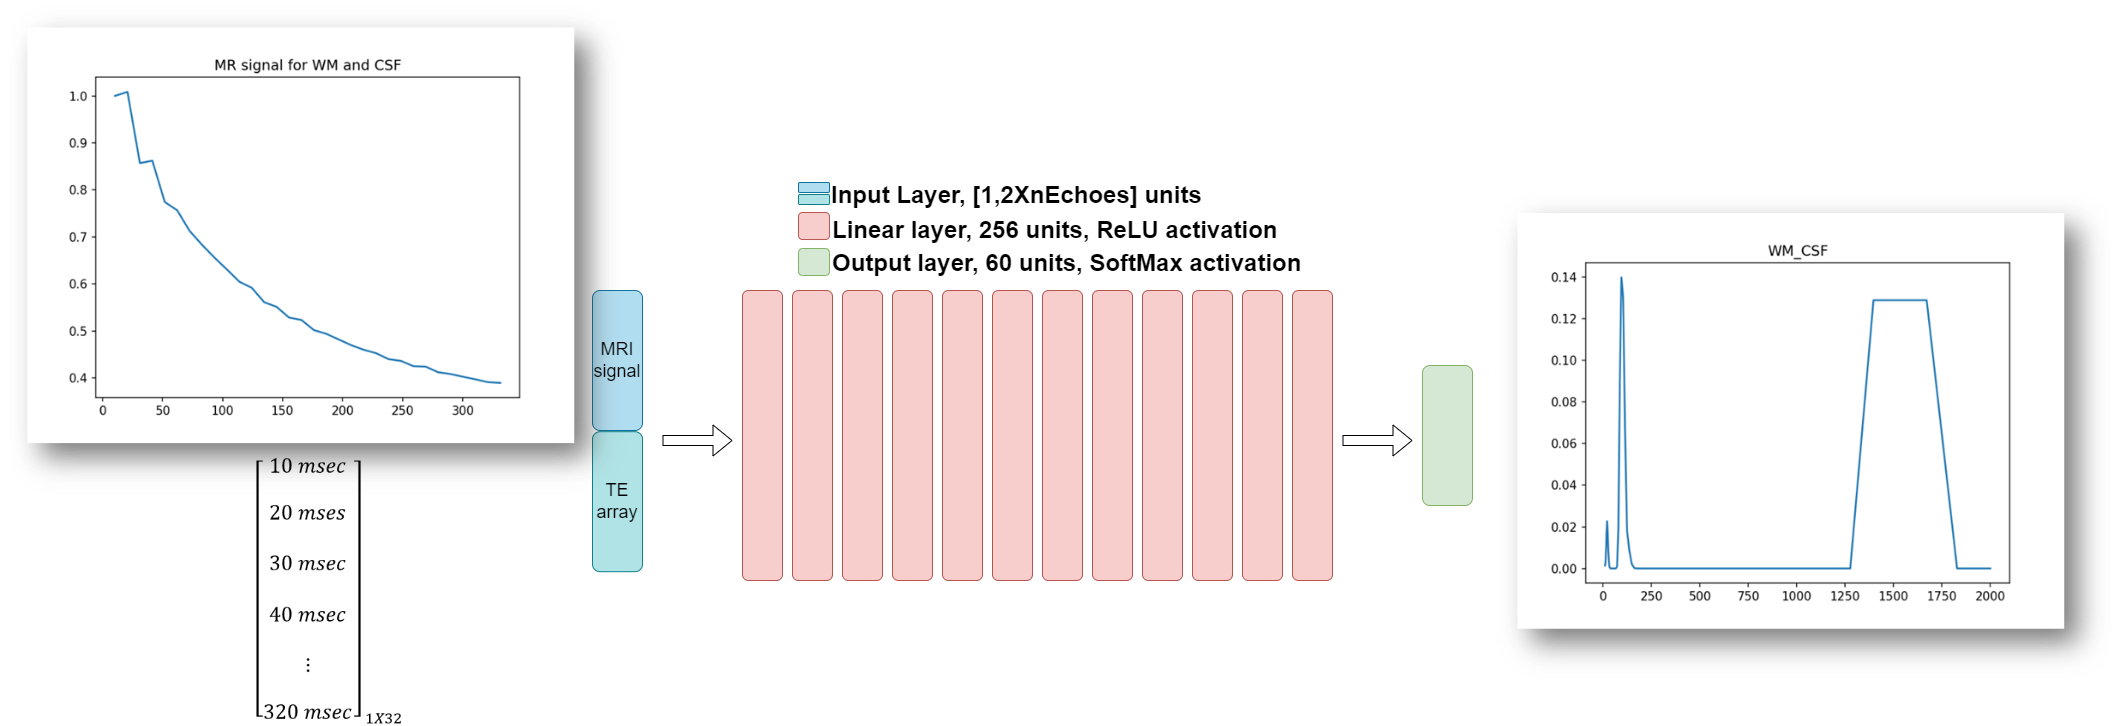
Algorithms:We trained a fully-connected feed-forward model to directly recover the T2 distributions from the MRI signal. Our network is composed of 12 fully-connected layers followed by ReLU activation, an input layer, and an output layer followed by a SoftMax layer (figure 1). The input layer is composed of 40 neurons (twice the number of echoes), which receive the MRI signal along with the TE array. The output layer is composed of 60 neurons which project the output into a distribution space within the size of downsampled ground-truth p(T2). We used simulated data generated with the (EPG) formalism [6] and a linear combination of the mean-squared error (MSE) and Wasserstein distance between the predicted p(T2) and the ground truth [4]. We trained our model on simulated signals with SNR ∈ [80, 200] and TEmin = ΔTE ∈ [5, 15]ms, with 20 echoes. For comparison, we implemented and trained the MIML model [4] on the synthetic dataset with both random TEmin = ΔTE ∈ [5, 15]ms and a fixed TE equal to 12ms.
Data: We used publicly available quantitative T2 data of 3 healthy volunteers. The dataset was acquired with a 3T Siemens scanner using a 2D multi-echo spine-echo sequence with the following parameters: acquisition matrix =128X104; voxel-size = 1.64X1.64X3mm; N-echoes = 20; Flipping-angle = 180◦ , and ΔTE = 12ms.
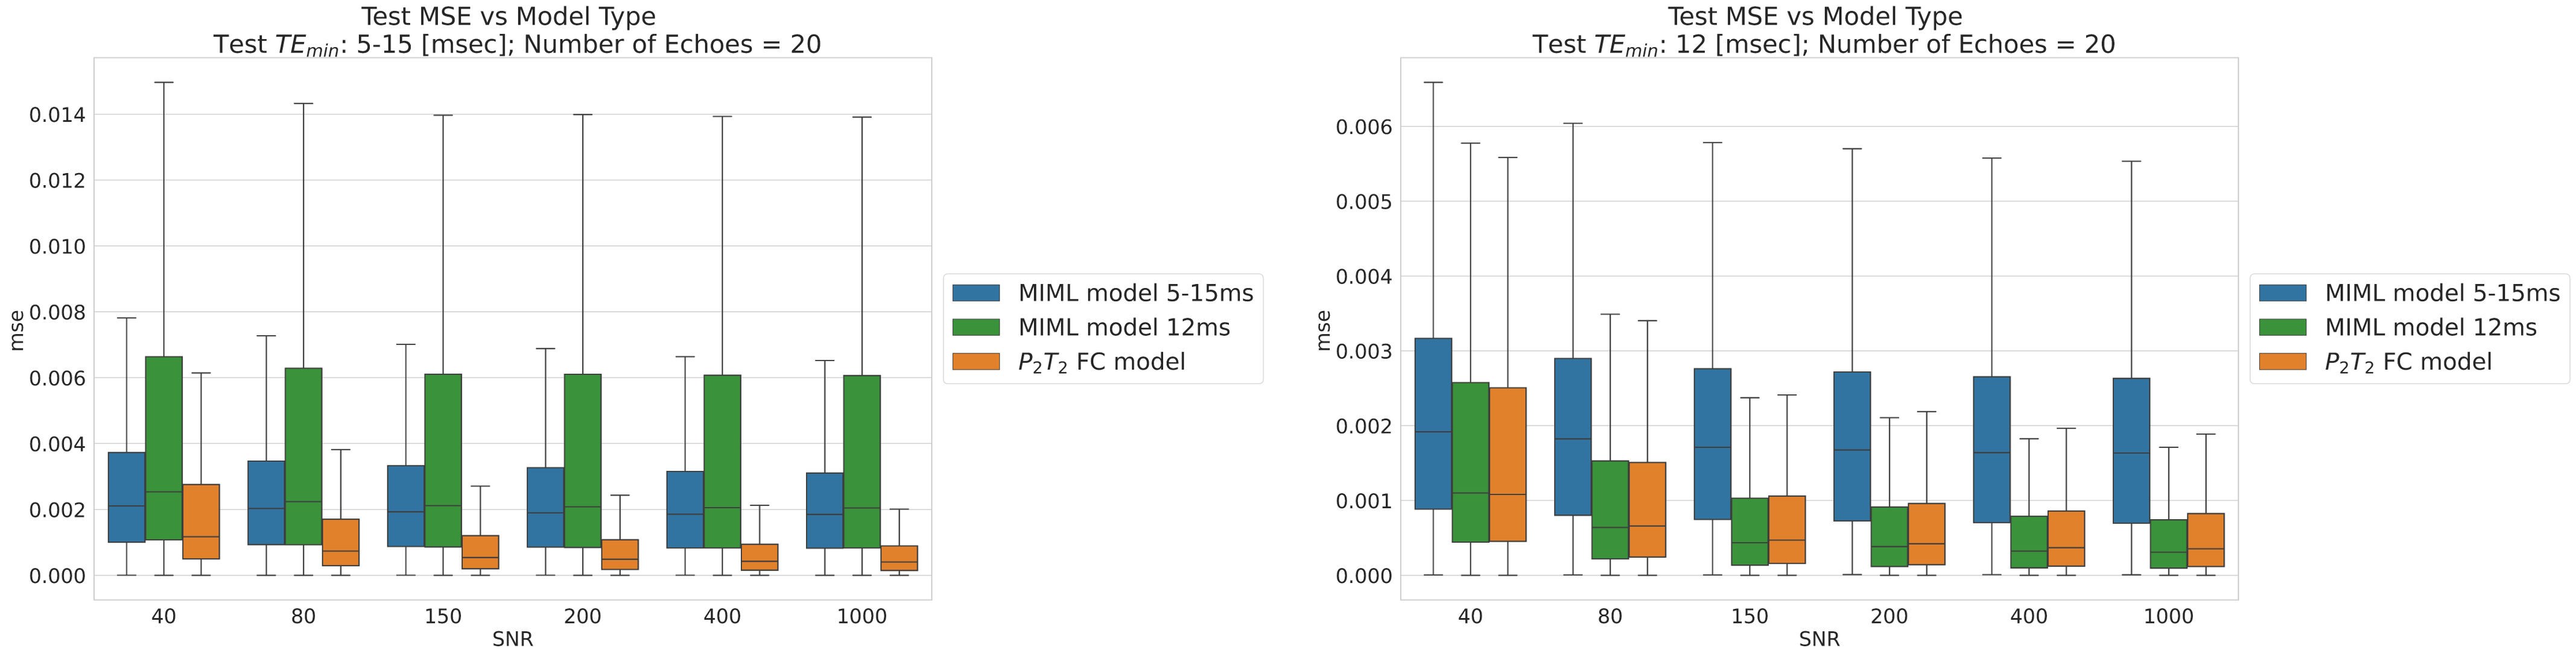
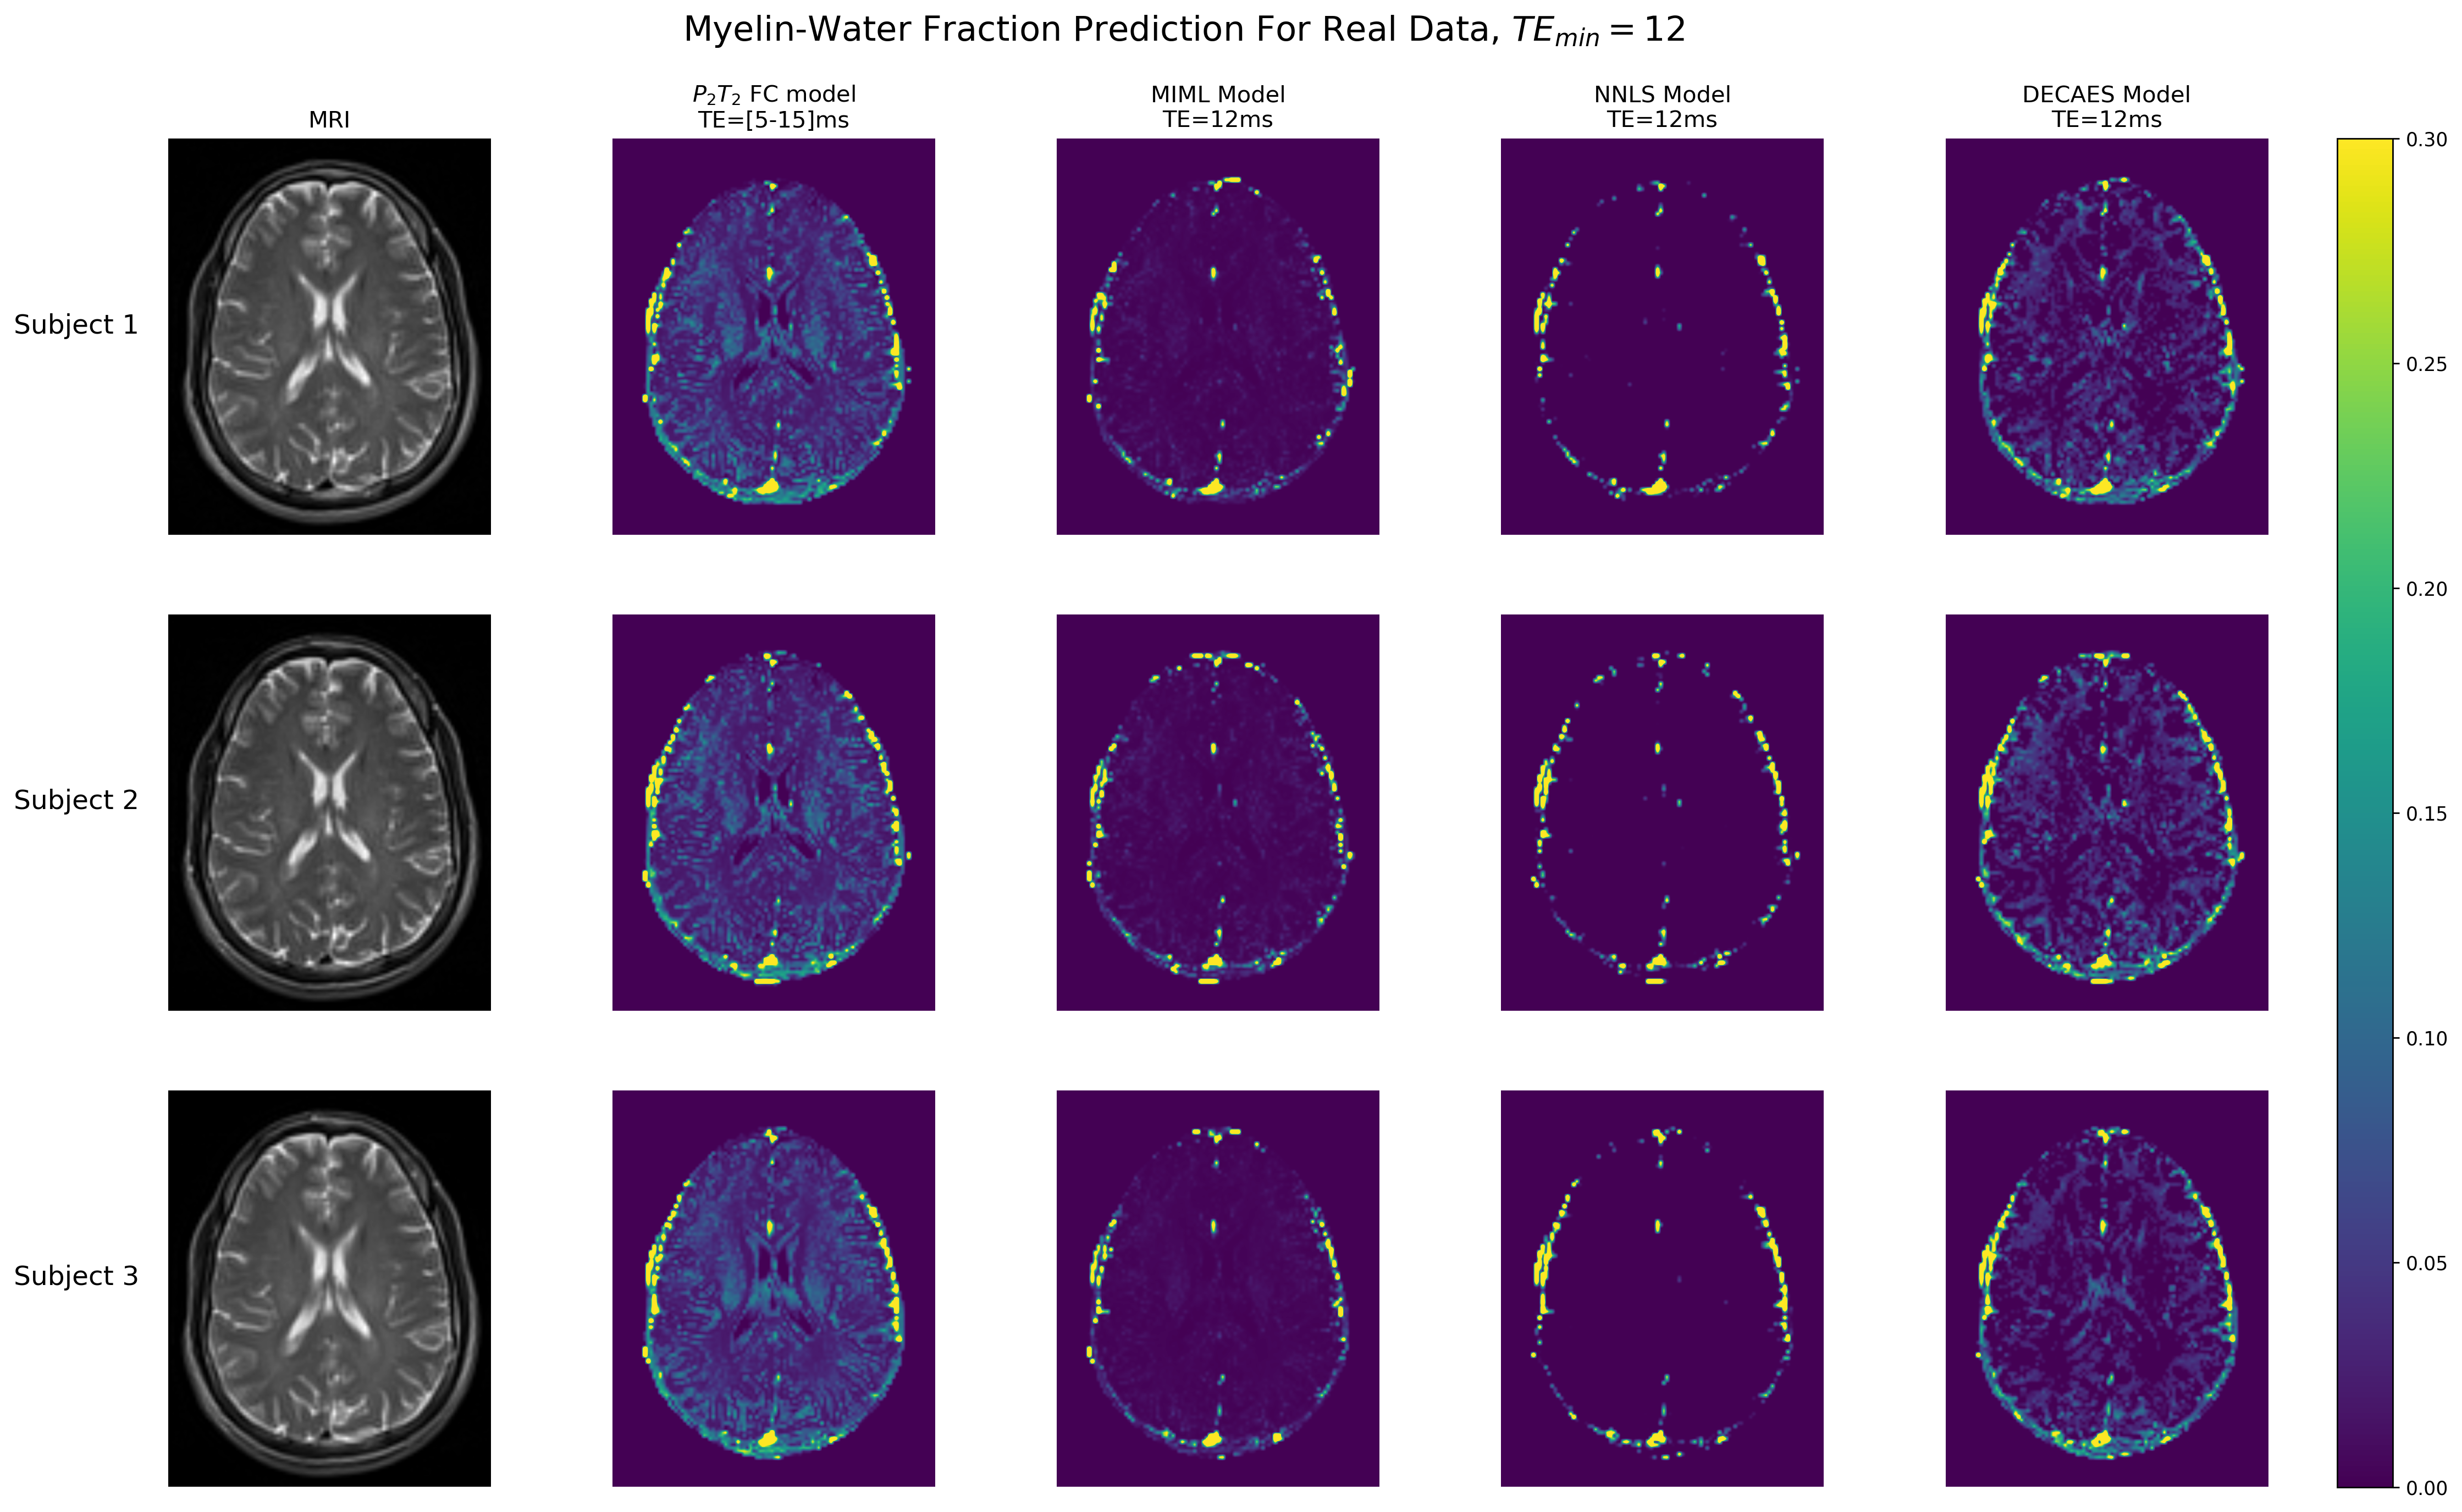
Experiments: We used the simulation data to assess the accuracy of the T2 distribution recovered by the different models by means of the mean-squared error(MSE) between the predictions and the reference data. We also calculated the Myelin-Water Fraction (MWF) maps for the real data using the different models.
Results
Fig. 2 summarizes the different models’ performances, on both the TEmin = 12ms and TEmin ∈ [5, 15] ms test sets. Our physically-driven model achieved a better p(T2) recovery with respect to the ground truth data when evaluated on 1D and 2D synthetic data, compared to the other models. In addition, our model achieved a similar accuracy as a MIML model which was trained with a fixed TE. When using a large range of different TE values, our model was able to maintain its accuracy in recovery of the T2 distribution better than the MIML model. Fig. 3 depicts the application of the different models for the real datasets. Our method provided the most detailed MWF maps with the highest conformity to anatomical structure compared to the MIML model trained with fixed and varying TEs, Non-linear-least-squares (NLLS) approach [7], and the DECAES algorithm.Conclusion
We presented a new physically-driven approach for T2 distribution recovery from multi-echoes MRI scans that is robust to variations in the acquisition parameters. Our approach is capable to learn the physical characteristics of the MRI signal by considering the TE of each sample, resulting in a network that is agnostic for different acquisition protocols.Acknowledgements
Our simulations dataset was generated using the signal-simulation algorithm developed by [4] which was kindly shared with us. The real MRI data was acquired by The Lab for Advanced MRI from Tel-Aviv University and kindly shared with us.References
[1] R. S. Menon and P. S. Allen. “Application of continuous relaxation time distributions to the fitting of data from model systems and excised tissue”. In: Magnetic Resonance in Medicine 20.2 (1991), pp. 214–227. issn:15222594. doi: 10.1002/MRM.1910200205.
[2] Yaghoub Fatemi et al. “Fast T2 mapping using multi-echo spin-echo MRI: A linear order approach”. In: Magnetic Resonance in Medicine 84.5 (Nov.2020), pp. 2815–2830. issn: 1522-2594. doi: 10.1002/MRM.28309. url:https://doi.org/10.1002/mrm.28309.
[3] Hai Ling Margaret Cheng et al. Practical medical applications of quantitative MR relaxometry. Oct. 2012. doi: 10.1002/jmri.23718.
[4] Thomas Yu et al. “Model-informed machine learning for multi-componentT2 relaxometry”. In: Medical Image Analysis 69 (Apr. 2021). issn: 13618423.doi: 10.1016/j.media.2020.101940.
[5] Serge Didenko Vasylechko et al. SynthMap: a generative model for synthesis of 3D datasets for quantitative MRI parameter mapping of myelin water fraction. June 2022. url: https://github.com/sergeicu/synthmap.
[6] J. Hennig. “Multiecho imaging sequences with low refocusing flip angles”.In: Journal of Magnetic Resonance (1969) 78.3 (July 1988), pp. 397–407.issn: 0022-2364. doi: 10.1016/0022-2364(88)90128-X
[7] Erick Jorge Canales-Rodr´ıguez et al. “Comparison of non-parametric T2relaxometry methods for myelin water quantification”. In: Medical image analysis 69 (Apr. 2021), p. 101959. issn: 1361-8415. doi: 10.1016/J.MEDIA.2021.101959.
Figures