5190
Comparison of R1, R2* and PDFF mapping by simultaneous multi-relaxation-time Imaging (TXI) method in hepatic disease
Yishuang Wang1, Tianxiang Huang1, Meining Chen2, XU YAN2, and Longlin Yin1
1Radiology, Sichuan Provincial People's Hospital, Chengdu, China, 2MR Scientific Marketing, Siemens Healthcare, Shanghai, China
1Radiology, Sichuan Provincial People's Hospital, Chengdu, China, 2MR Scientific Marketing, Siemens Healthcare, Shanghai, China
Synopsis
Keywords: Machine Learning/Artificial Intelligence, Liver
MR multiparametric quantitative techniques have an important role in liver-related diseases.We achieved simultaneous proton density fat fraction(PDFF), R2*and R1 quantification of different liver diseases using a simultaneous multi-relaxation-time Imaging(TXI) technique.We observed differences of PDFF,R2* and R1 mapping between healthy volunteers and patients with cirrhosis,HCC,metastatic carcinoma of liver,and liver transplantation.Rapid scanning increases usage of this method in the clinic.These quantitative values can be biomarkers for assessing liver function and liver tissue characterization.Introduction
Hepatocellular carcinoma (HCC) is the fifth most common cancer worldwide, and the second leading cause of cancer related deaths1.From the development of cirrhosis to HCC, to the treatment of HCC through liver transplantation, and other cancers metastasizing to the liver, multi-parameter mapping techniques play an important role in assessment of treatment planning, effectiveness, and prognosis. While most of mapping techniques need scan independently, which take more acquisition time and the joint analysis of multiple sequences is not easy. To accelerate the acquisition, simultaneous multi-relaxation-time Imaging (TXI) technique was introduced to calculate proton density fat fraction (PDFF), R2* and R1 in liver, with a very rapid acquisition time( ~ 40s). The purpose of our study was to investigate TXI technique to quantitatively assess the difference between healthy volunteers and patients with cirrhosis, HCC, metastatic carcinoma of liver, and liver transplantation.Methods
Acquisition:2 healthy volunteers and 8 patients(2 cirrhosis, 2 HCC, 2 metastatic carcinoma of liver from pancreatic cancer,2 liver transplantation)participated in this study.Liver MR scanning was conducted using a 3T MR scanner(MAGNETOM Prisma VIDA,Siemens Healthcare,Erlangen,Germany).The acquisition of TXI technique contains two multi-point quantitative Dixon(qDixon)sequence with two different flip angles and B1 mapping scan.The imaging parameters for qDixon were as follows:TR = 11.51 ms,TE1/TE6/𝜟TE = 1.07/10.02/1.79 ms,FOV = 334 × 382 mm2,matrix = 196 ×224,slice thickness = 3.5 mm,slice number = 52,total time 15.32 seconds for each scan.An additional B1 map sequence was acquired with following parameters:TR= 5050 ms,TE = 1.83 ms,FOV = 309 × 381mm2,matrix = 52 × 64, slice thickness = 8 mm,total time 10 seconds.Quantification Algorithm: For simultaneous multi-parameter mapping,follow 3 steps:first,water,fat signal and T2*map were calculated by at 4˚FA qDixon;second,PDFF was calculated by dividing fat signal by total signal (fat+water);third, the additional B1 map and the first echo from two qDixon data was used for T1 mapping processing with B1 correction.The algorithm was implemented in Matlab 2018b and Python 3.5.
Image analysis : Liver quantitative analysis with no visible lesions(healthy liver,cirrhosis and liver transplantation)was performed on R1 maps by positioning three regions of interest(ROI) measuring 10–20 mm2 in the right lobe of the liver far away from vascular structures based on the middle 2 slices, corresponding PDFF,R1,R2* value were calculated,and then averaged all ROIs.For the liver with lesions (HCC, metastatic carcinoma),the ROI was placed on the central three slices of the largest lesion,and then averaged.Then mean of PDFF,R1,R2* value were compared between different types of liver diseases and healthy liver.
Results
PDFF,R1,R2*mapping obtained by this rapid method in approximately 50 seconds illustrated the feasibility for different liver diseases,see Figure 1,Table 1.By comparing quantitative values,We found the difference in the value of PDFF,R1,R2* between different types of liver diseases and healthy liver.All quantitative images show a high signal-to-noise ratio(SNR)and no artifacts from respiratory motion(Figure 2).Discussion
In our study,we confirmed the feasibility of using TXI technique to simultaneously calculate PDFF,R2* and R1 in healthy liver and different types of liver diseases.The change of PDFF was closely related to the fibrosis process and can be directly evaluated for the improvement of the annulus fibrosus2.Therefore,in patients with cirrhosis and HCC,we did not observe changes in PDFF.The highest R1 values were found in healthy livers and transplanted liver,indicating that R1 was very sensitive to liver disease.T1 mapping with Gd-EOB-DTPA-enhanced by TXI technique might be helpful for estimating liver function according to the Child-Pugh score in patients with chronic liver disease3.R2* showed less variation in these liver diseases,perhaps due to that,T2*suggested not only the presence of iron but also fibrotic alterations,liver cell degeneration,necrosis and regeneration4.Conclusion
We used the TXI technique to achieve rapid and accurate quantitative analysis of liver,especially the R1 mapping,which represented interesting imaging biomarkers of liver tissue characterization.Acknowledgements
No acknowledgement found.References
1. Torre LA,Bray F,Siegel RL Ferlay J,Lortet-Tieulent J,Jemal A (2015) Global cancer statistics,2012.CA Cancer J Clin 65:87–108.
2. Tamaki N,Munaganuru N,Jung J,et al.Clinical utility of 30% relative decline in MRI-PDFF in predicting fibrosis regression in non-alcoholic fatty liver disease. Gut.2022;71(5):983-990.
3. Haimerl M,Verloh N,Zeman F,et al.Assessment of clinical signs of liver cirrhosis using T1 mapping on Gd-EOB-DTPA-enhanced 3T MRI.PLoS One. 2013;8(12):e85658.Published 2013 Dec 31.
4. Obmann VC,Marx C,Berzigotti A,et al.Liver MRI susceptibility-weighted imaging(SWI)compared to T2* mapping in the presence of steatosis and fibrosis.Eur J Radiol.2019;118:66-74.
Figures
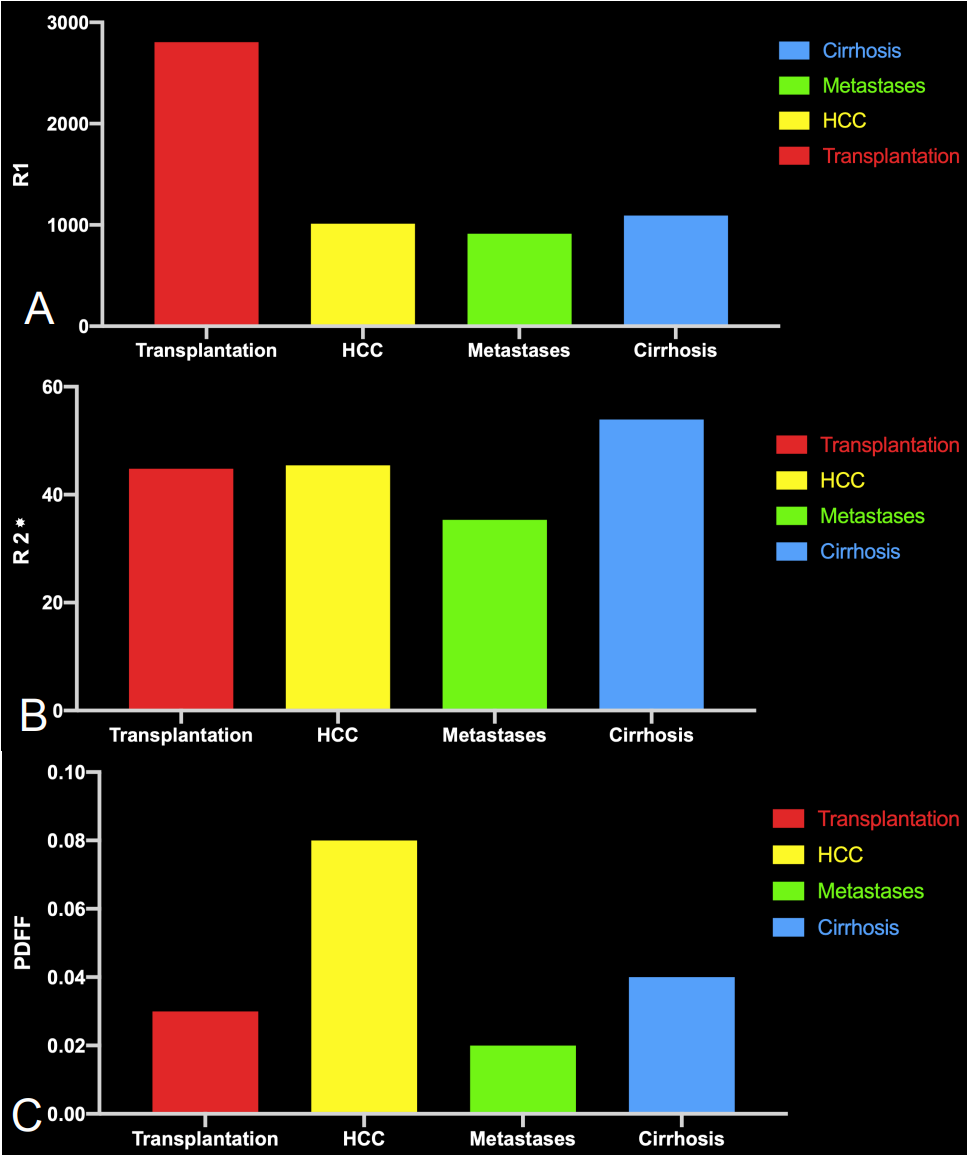
Figure 1. Comparison of mean
PDFF, R2* and R1 values from patients with cirrhosis, HCC, metastatic carcinoma,
and liver transplantation. The highest R1 values were found in transplanted
liver, indicating the healthy state of it.
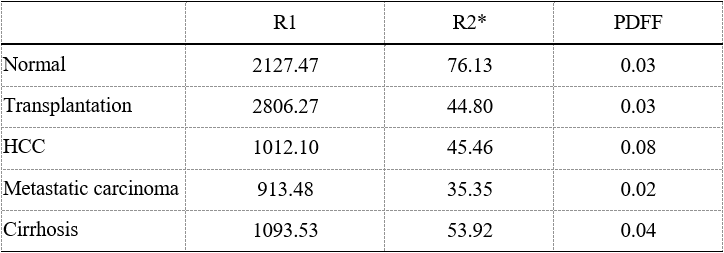
Table
1. Mean PDFF, R2* and R1 values for normal liver and patients with cirrhosis,
HCC, metastatic carcinoma, and liver transplantation. The close proximity of R1
in healthy and transplanted livers indicated that R1 characterizes the normal
metabolic state of the liver. R2* showed less variation between the liver
diseases and the healthy liver.
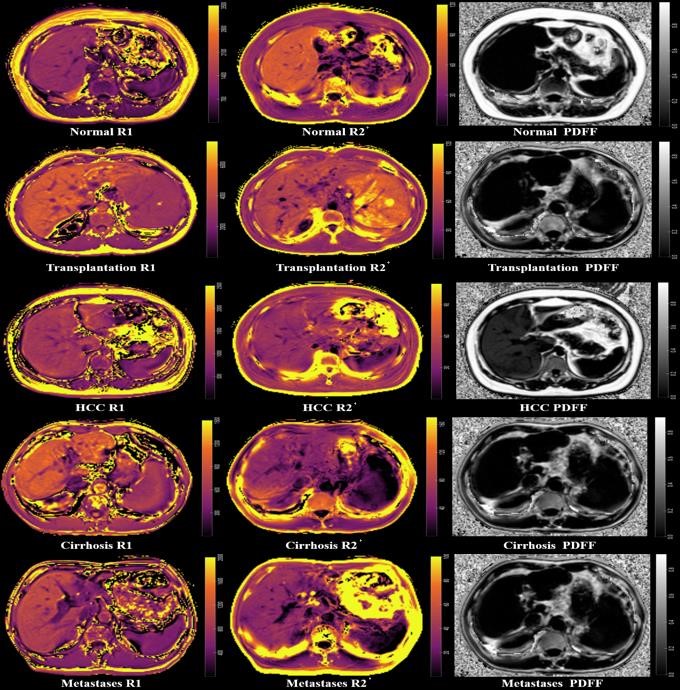
Figure
2. Examples of liver R1, R2* and PDFF mapping in normal liver and patients with
liver transplantation, HCC, cirrhosis and metastatic carcinoma of liver.
The R1 values of transplanted liver was high.
DOI: https://doi.org/10.58530/2023/5190