5185
Deep-learning and feature selection for fast, quantitative and specific CEST imaging1Université Paris-Saclay, CEA, CNRS, MIRCen, Laboratoire des Maladies Neurodégénératives, Fontenay-aux-roses, France
Synopsis
Keywords: Machine Learning/Artificial Intelligence, CEST & MT, Feature selection
We propose an artificial neural network combined with a feature selection scheme for fast, quantitative CEST imaging, designed for specificity. Our NN was evaluated on glucose phantoms and glutamate/glucose mixed phantoms and goes beyond performances of classical fittings approaches.Introduction
CEST (Chemical Exchange Saturation Transfer) has been widely used as a high-resolution contrast imaging method, capable of targeting many different metabolites. Quantification of metabolite concentrations through CEST measurements is possible1,2, but requires well resolved Z-spectrum that are time consuming. In recent years, machine learning approaches3–6 have shown promising results for faster quantitative CEST (qCEST). Here, we investigate the performance of a supervised neural network for in vitro qCEST, and especially its ability to separate contributions in a mix of two fast-exchanging proton metabolites, glucose (Glc) and glutamate (Glu). We also propose a feature selection scheme to reduce acquisition time, by deriving the most relevant acquisition parameters for qCEST schedule.Methods
Phantom imagingFive solutions of D-glucose (Glc) were prepared in physiological serum at concentrations ranging from 3 to 50 mM, at pH close to 7. Additionally, two mixed Glc and L-glutamate (Glu) phantoms were prepared similarly. Phantoms were imaged at room temperature in a Bruker Scanner at 11.7 T. We used a RARE-CEST sequence with a train of block saturation pulses of 100ms each and offsets ranging from -5 ppm to +5 ppm. Z-spectra were acquired at different saturation power B1 ranging from 3 to 7 µT and total saturation time of 1 or 4s.
Curve-fitting
To serve as a comparison standard to NN performance, we performed least-squares Z-spectra curve-fitting for all saturation conditions simultaneously, using analytical Bloch-McConnell CEST modeling7. Lower and upper bounds for the free parameters of the fit are indicated in Fig1.b. This allowed us to estimate exchange rates (kex) and compare the accuracy of glutamate and glucose concentration estimations.
Neural network
In order to train the neural network, a dataset of 5000 CEST simulations was generated. We considered a CEST scenario including glutamate and glucose pools in vitro, and simulated a broad diversity of CEST examples, with CEST pool concentrations and kex varying in a realistic range (Fig1.b) in respect to our phantom results (Fig2.b). To mimic real experimental data, Gaussian noise (std=0.001) was added to the data.
A training subset of 80% of examples was used to train a two-layer neural network (NN) using stochastic gradient descent algorithm with 1e-3 learning rate (Fig1.a and c). Each layer consisted of 300 nodes with batch normalization8 and ReLU activation function9. The NN was trained with mean squared error loss to return glucose and glutamate concentrations, ensured positive with ReLU output function9.
Feature selection
The idea of feature selection is to select the most relevant acquisition points (or “features”) among the NN input to be able to efficiently reduce the dimensionality of the data10. In our case, this means selecting the best subset of [B1, tsat, offset] values to ensure good qCEST while accelerating the acquisition. We implemented a greedy sequential feature selector scheme, using backward elimination. As a criterion, feature importance was evaluated by estimating NN error when shuffling feature value in testing set, averaged on 30 shuffles.
Results
NN Quantitative CEST performanceWe evaluated the NN and curve-fitting algorithm performance on a test set of simulated data (not included in training set). The two methods seemed to offer similar accuracy, but the NN was much faster in data processing (see Fig1.d).
When training the NN only on pure glucose simulations, and confronting it to experimental data (Fig2.a), the NN showed better accuracy than curve-fitting, even if it was less than expected from simulations (Fig2.c/d).
Accelerating acquisition schedule
Using feature selection, we investigated how the NN behaved when reducing the number of features (Fig3.a) and deduced what seemed to be the most relevant acquisition points (see Fig 3.b). We removed 680 out of 707 acquisition points (Fig4.a) and retrained for this optimized schedule of 27 points, recovering very good glucose estimations (Fig4.b and c).
Investigating the specificity of NN-qCEST
We then tested the specificity of NN-qCEST on phantoms of mixed glucose and glutamate (Fig5.a), whose CEST contributions are usually hard to distinguish because of their high kex and close resonance frequencies11. The accuracy of concentration predictions of the NN was rather good for glucose but was decreased for glutamate (Fig5.c). It could probably be improved by refining CEST simulations. In any case, the NN performance was still better than curve-fitting and more robust, since we had to constrain closely the kex to obtain good estimations with curve-fitting.
Conclusion and discussion
We achieved quantitative glucose estimation here with an average error of ±3 mM while shortening the acquisition schedule by 26.NN-qCEST seems promising, as it offers fast data processing and more reliability than Z-spectra fitting, demonstrated here on in vitro studies. Furthermore, using feature selection, we can drastically reduce the acquisition time of CEST data by inferring a custom saturation schedule designed for the specific quantification of our parameters of interest. While computationally longer than other proposed schedule optimization methods5,12, feature selection has the advantage of showing explicitly how many acquisition points can be removed from the original schedule without compromising the accuracy of the quantification.
While its accuracy remains to be tested on in vivo studies, this neural-network based method could be used for quantitative CEST measurements with good temporal resolution, e.g. in metabolic glucoCEST studies.
Acknowledgements
11.7 T scanner was funded by NeurATRIS (“Investissements d'Avenir”, ANR-11-INBS-0011).References
1. Zaiss, M. et al. QUESP and QUEST revisited - fast and accurate quantitative CEST experiments. Magn. Reson. Med. 79, 1708–1721 (2018).
2. Kim, J., Wu, Y., Guo, Y., Zheng, H. & Sun, P. Z. A review of optimization and quantification techniques for chemical exchange saturation transfer MRI toward sensitive in vivo imaging: OPTIMIZATION AND QUANTIFICATION OF CEST MRI. Contrast Media Mol. Imaging 10, 163–178 (2015).
3. Perlman, O., Farrar, C. T. & Heo, H.-Y. MR fingerprinting for semisolid magnetization transfer and chemical exchange saturation transfer quantification. NMR Biomed. n/a, e4710. (2022)
4. Perlman, O. et al. CEST MR-Fingerprinting: Practical considerations and insights for acquisition schedule design and improved reconstruction. Magn. Reson. Med. 83, 462–478 (2020).
5. Perlman, O., Zhu, B., Zaiss, M., Rosen, M. S. & Farrar, C. T. An end-to-end AI-based framework for automated discovery of rapid CEST/MT MRI acquisition protocols and molecular parameter quantification (AutoCEST). Magn. Reson. Med. n/a, (2022).
6. Kang, B., Kim, B., Schär, M., Park, H. & Heo, H.-Y. Unsupervised learning for magnetization transfer contrast MR fingerprinting: Application to CEST and nuclear Overhauser enhancement imaging. Magn. Reson. Med. 85, 2040–2054 (2021).
7. Zaiss, M. & Bachert, P. Exchange-dependent relaxation in the rotating frame for slow and intermediate exchange – modeling off-resonant spin-lock and chemical exchange saturation transfer. NMR Biomed. 26, 507–518 (2013).
8. Ioffe, S. & Szegedy, C. Batch Normalization: Accelerating Deep Network Training by Reducing Internal Covariate Shift. (2015).
9. Nair, V. & Hinton, G. E. Rectified Linear Units Improve Restricted Boltzmann Machines. 8. (2010)
10. Venkatesh, B. & Anuradha, J. A Review of Feature Selection and Its Methods. Cybern. Inf. Technol. 19, 3–26 (2019).
11. Khlebnikov, V., van der Kemp, W. J. M., Hoogduin, H., Klomp, D. W. J. & Prompers, J. J. Analysis of chemical exchange saturation transfer contributions from brain metabolites to the Z-spectra at various field strengths and pH. Sci. Rep. 9, 1089 (2019).
12. Ouri Cohen. MR Fingerprinting SChedule Optimization NEtwork (MRF-SCONE). 4531 in Proc. Intl. Soc. Mag. Reson. Med. 27 (2019)
Figures
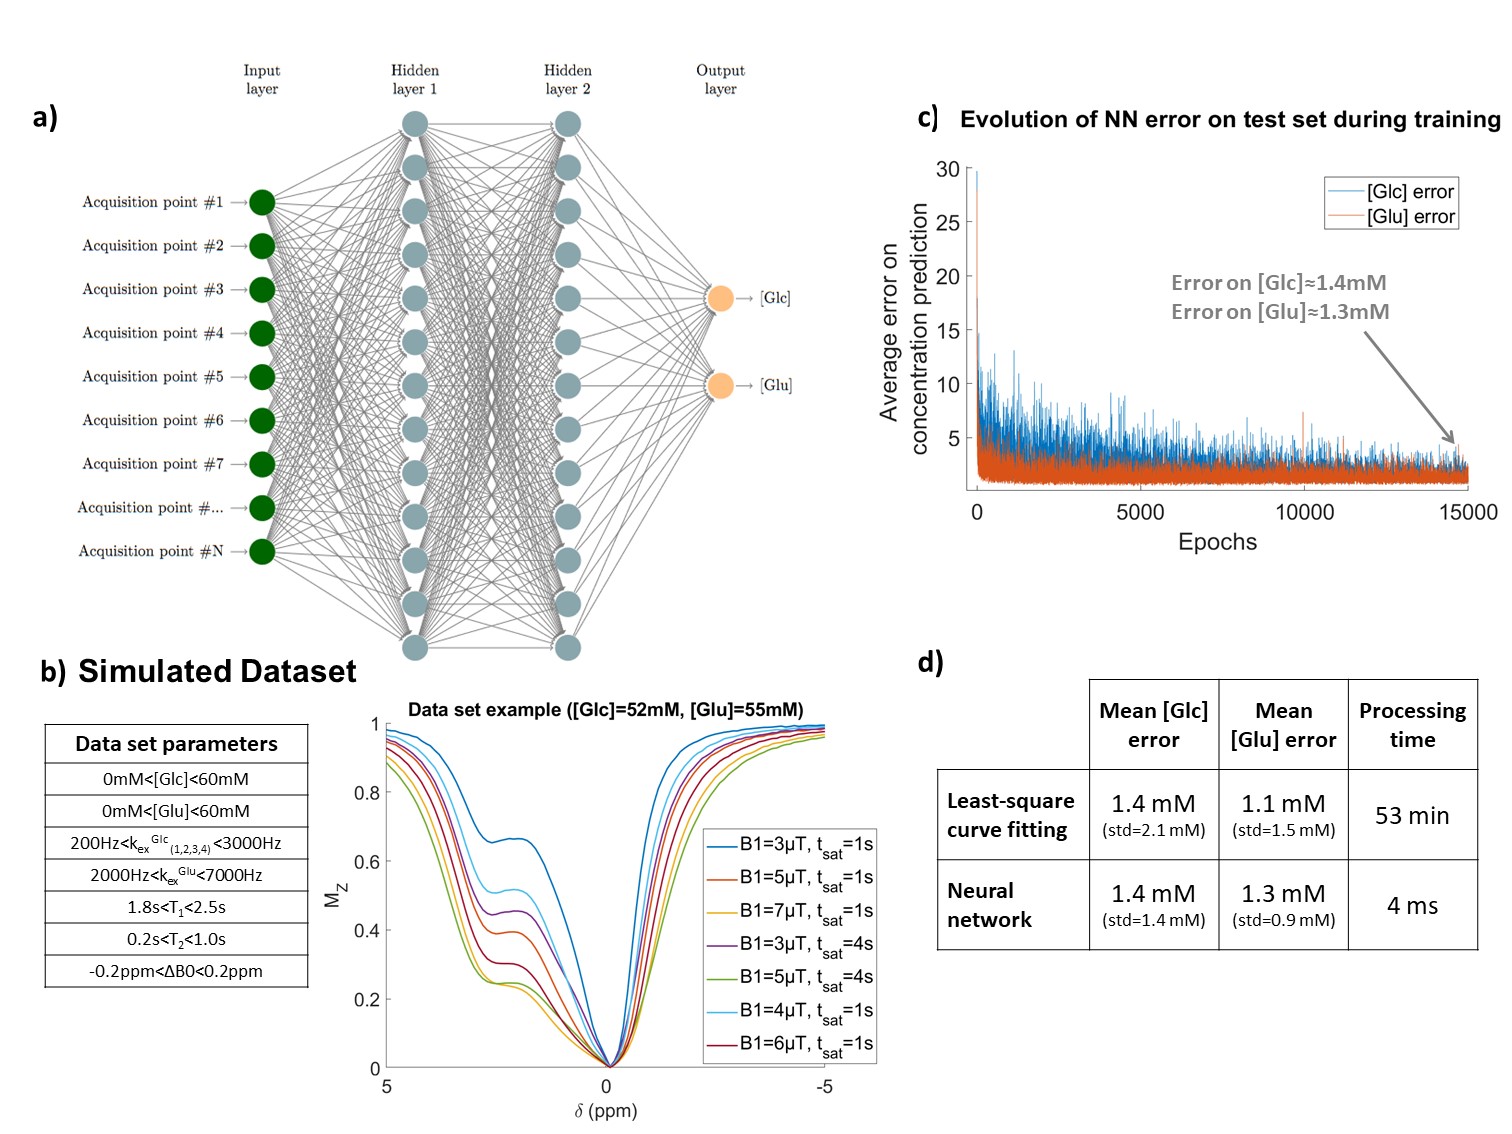
Figure 1: Neural network design.
a) NN architecture, here designed to output glucose and glutamate concentration. Input was designed to be 7 Z-spectra, as shown in b. b) Variability range of CEST parameters in the examples of the training dataset and typical example of simulated CEST data. c) NN error as a function of the number of training epochs. Error was calculated here on a test set of 600 examples, not included in training set. d) Average concentrations estimation errors of both NN and curve-fitting algorithm on the test set, as well as the data processing times for all the 600 examples.
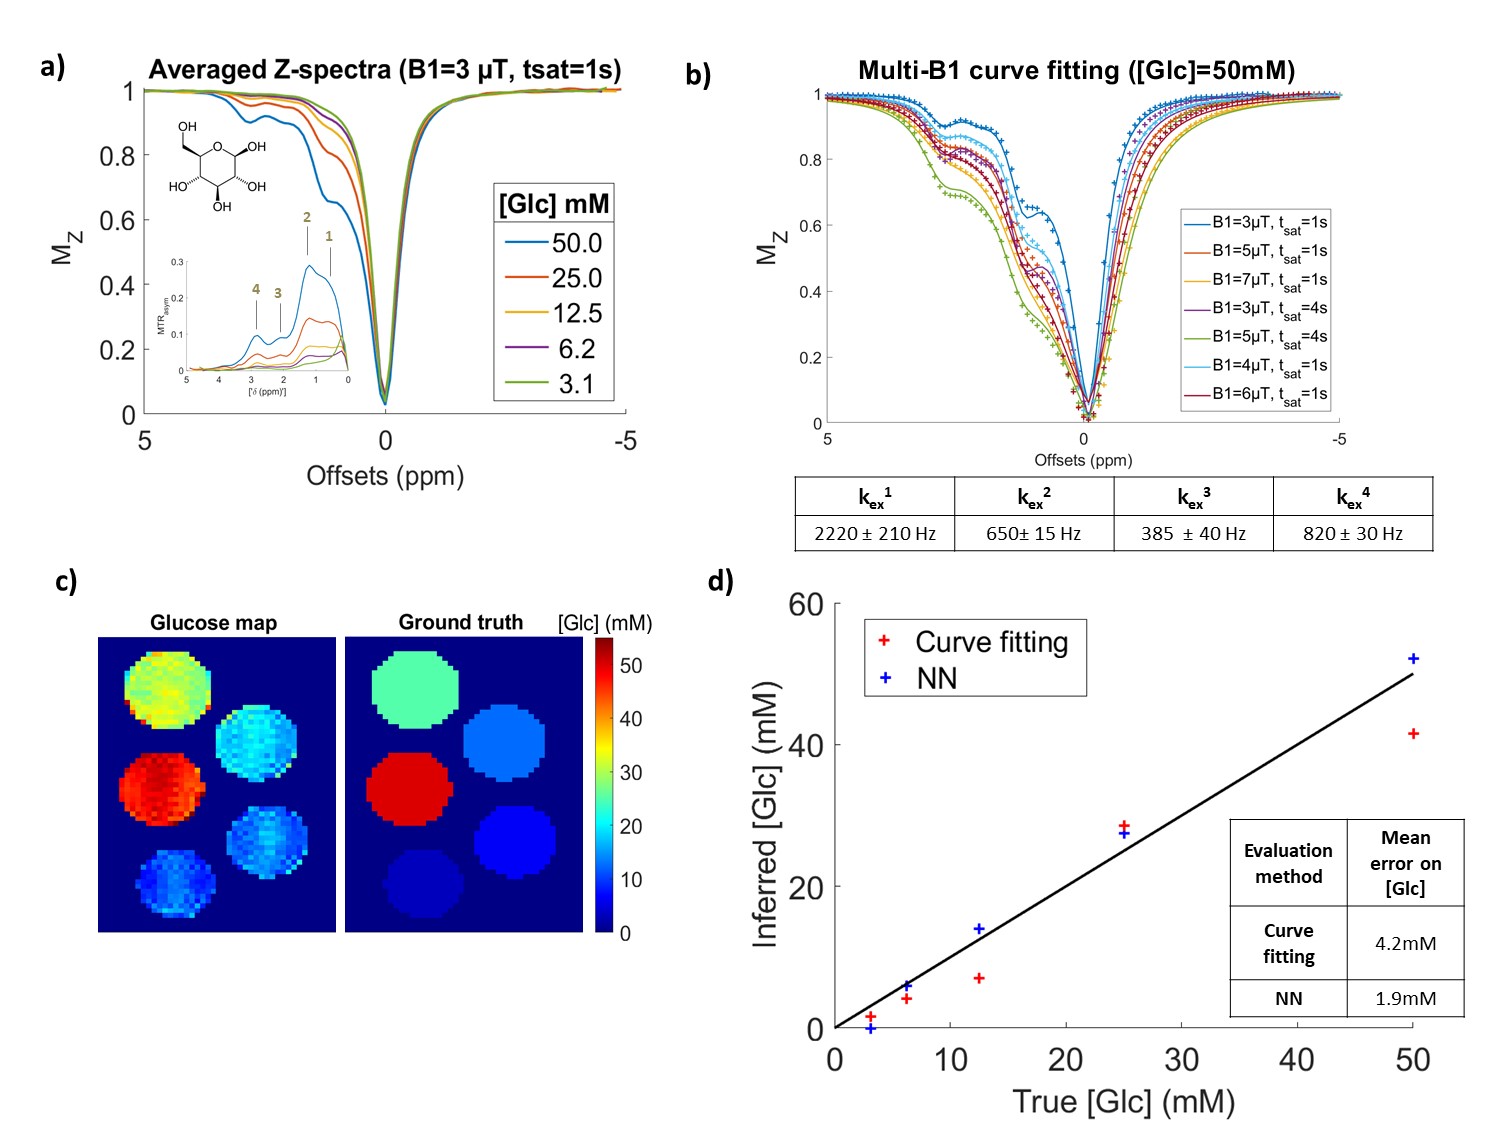
Figure 2: NN performance on pure glucose phantoms.
a) Experimental Z-spectra of 5 glucose phantoms, acquired here at B1=3 µT, tsat=1 s. b) Data and least-square curve fit of the 50 mM [Glc] phantom. Fit was performed simultaneously on all B1 and tsat conditions. Exchange rates obtained with this fit were indicated. c) NN prediction of glucose concentration on the 5 glucose phantoms. Here the NN was trained on pure glucose CEST dataset. d) Comparison of curve-fitting and NN concentration estimations using averaged Z-spectra in each of these glucose phantoms.
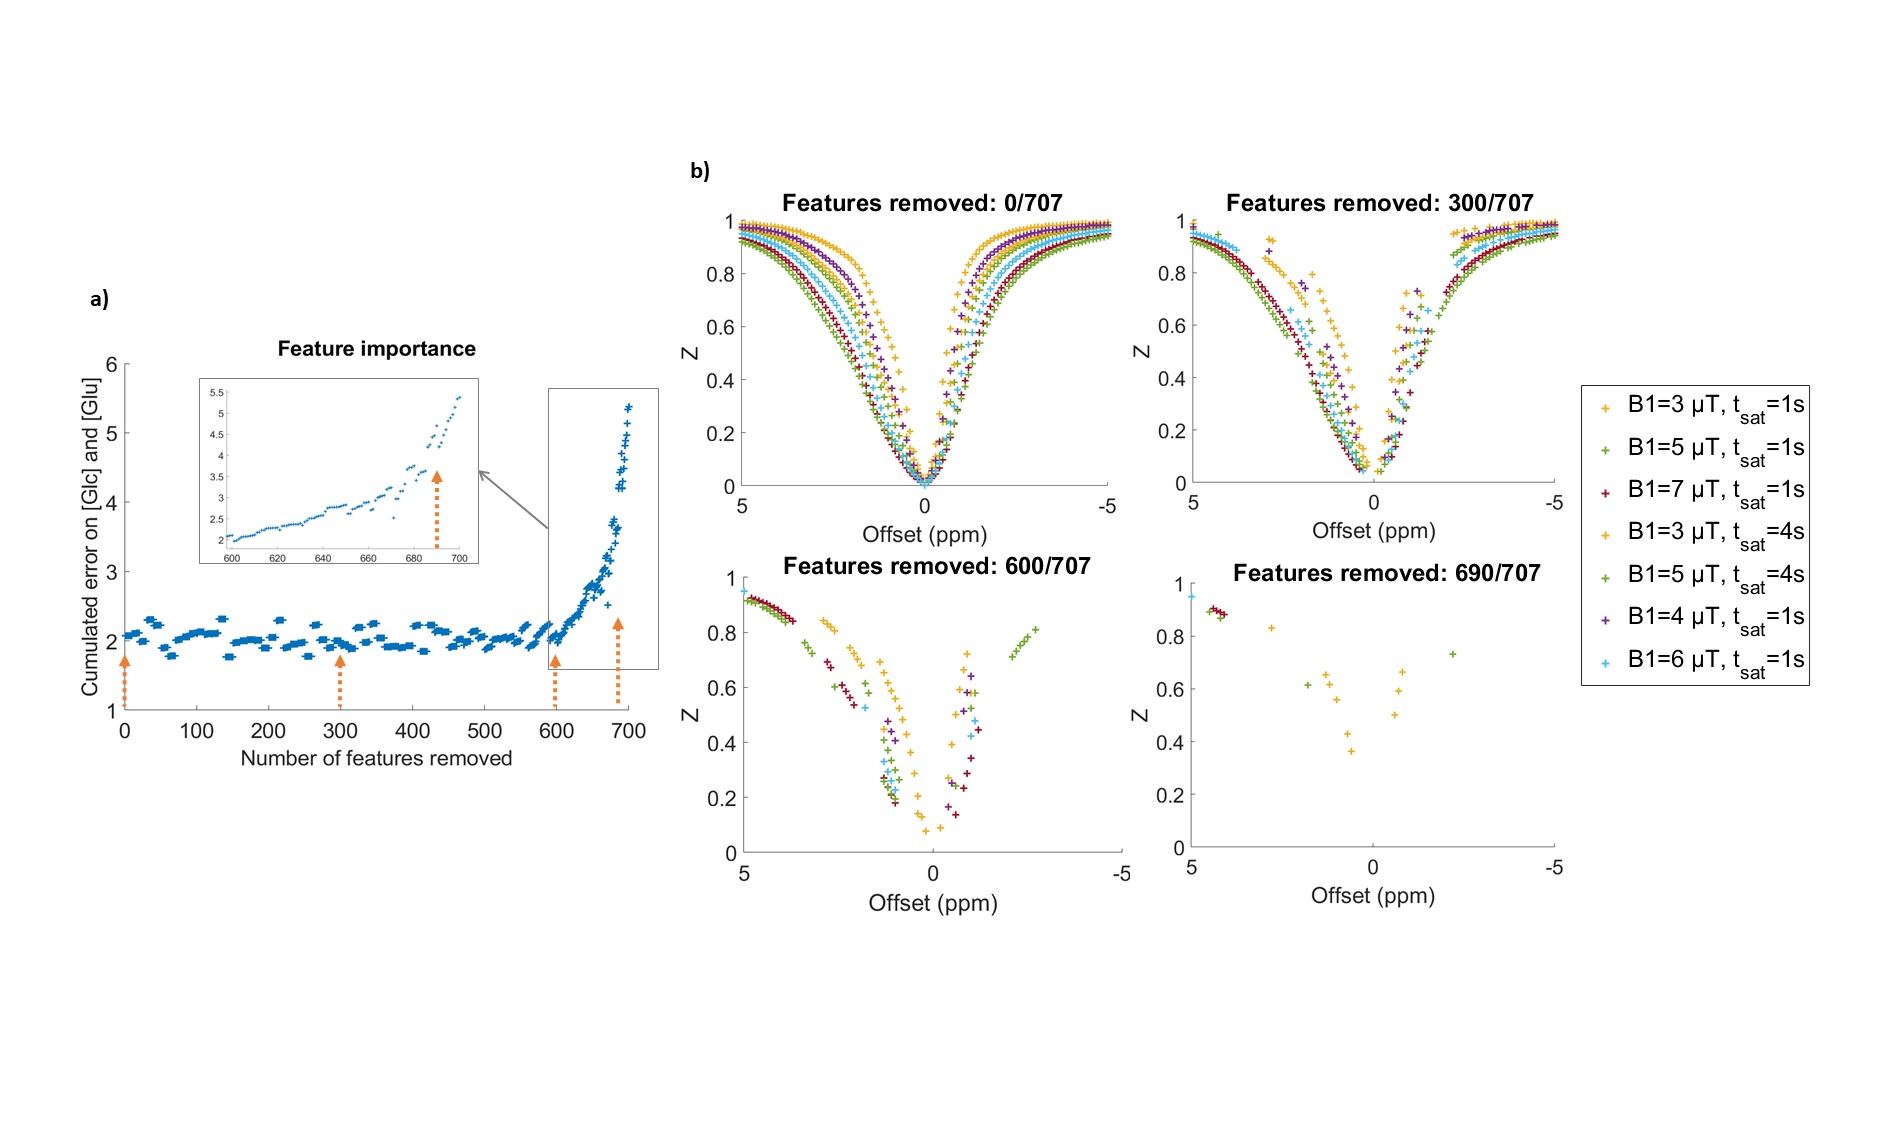
Figure 3: Feature selection process.
a) Evolution of feature importance (estimated by feature permutation induced error) along the backward elimination process. Error plotted is the sum of the error on glutamate and glucose concentrations. Here, features were removed 10 by 10 at each step. b) Remaining features at different stages of feature removal process.
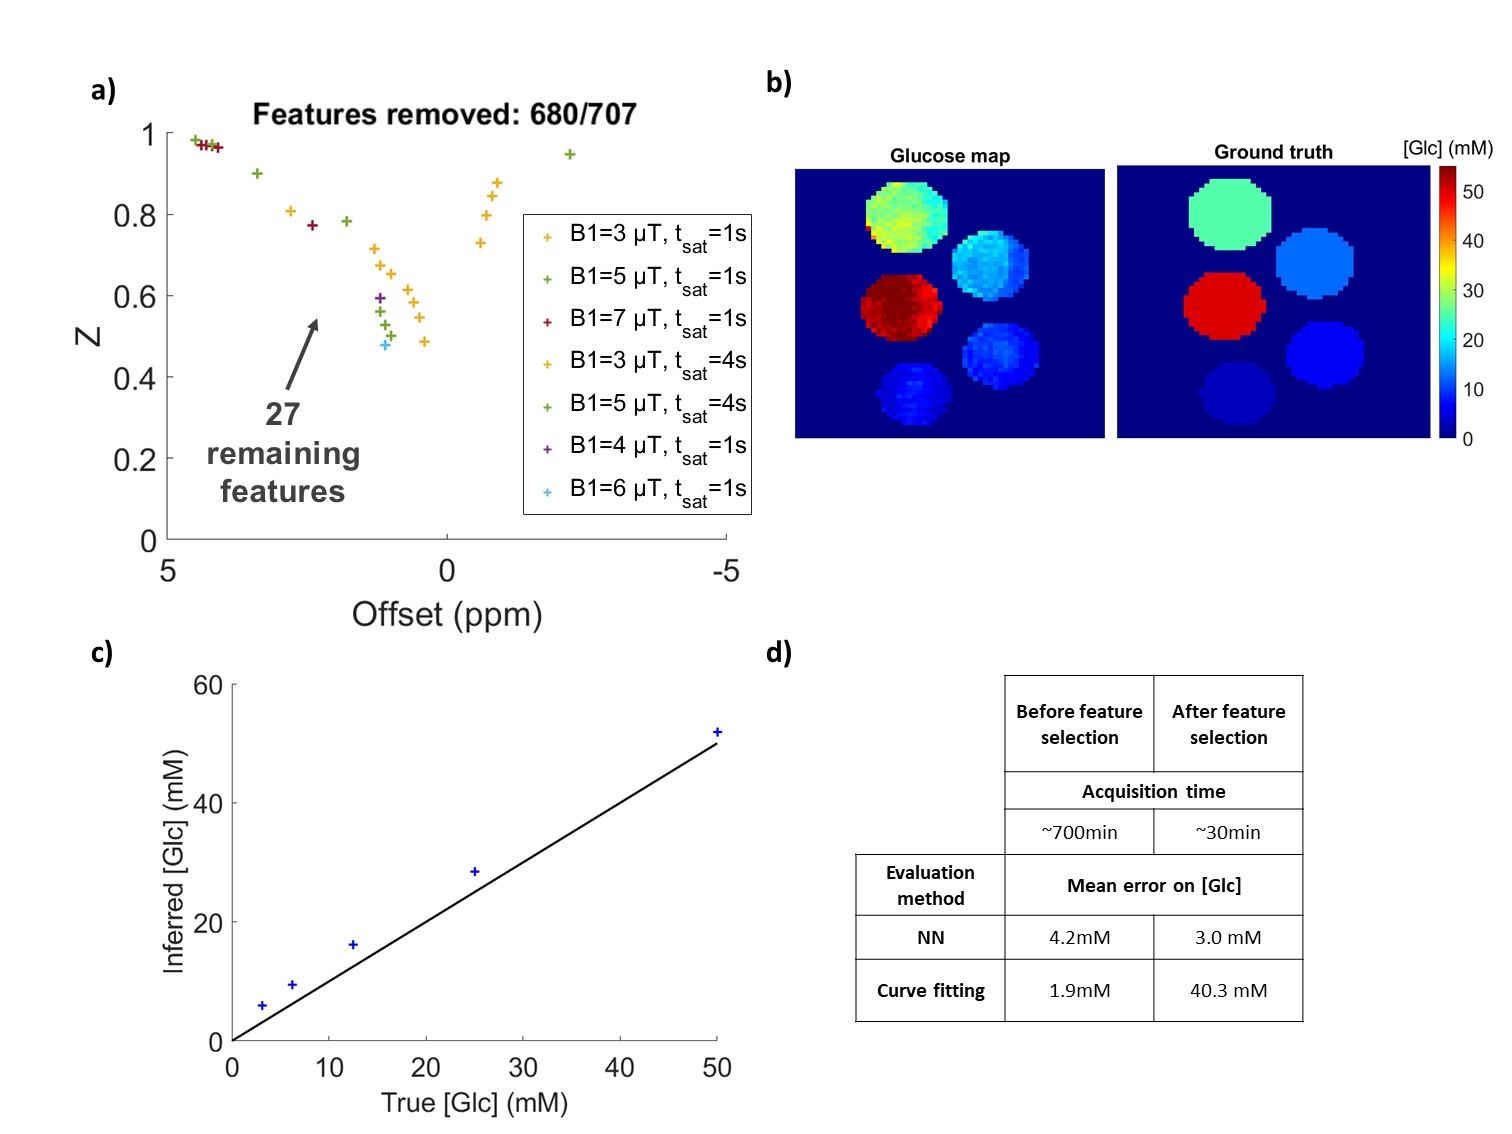
Figure 4: Neural network performance after feature selection.
a) 27 best features retained to retrain the NN. b) Glucose concentrations prediction by the retrained NN on the subset of the 27 acquisition points for these pure glucose phantoms. c) Glucose concentrations prediction using the subset of 27 acquisition points taken out of the averaged Z-spectra of pure glucose phantoms.
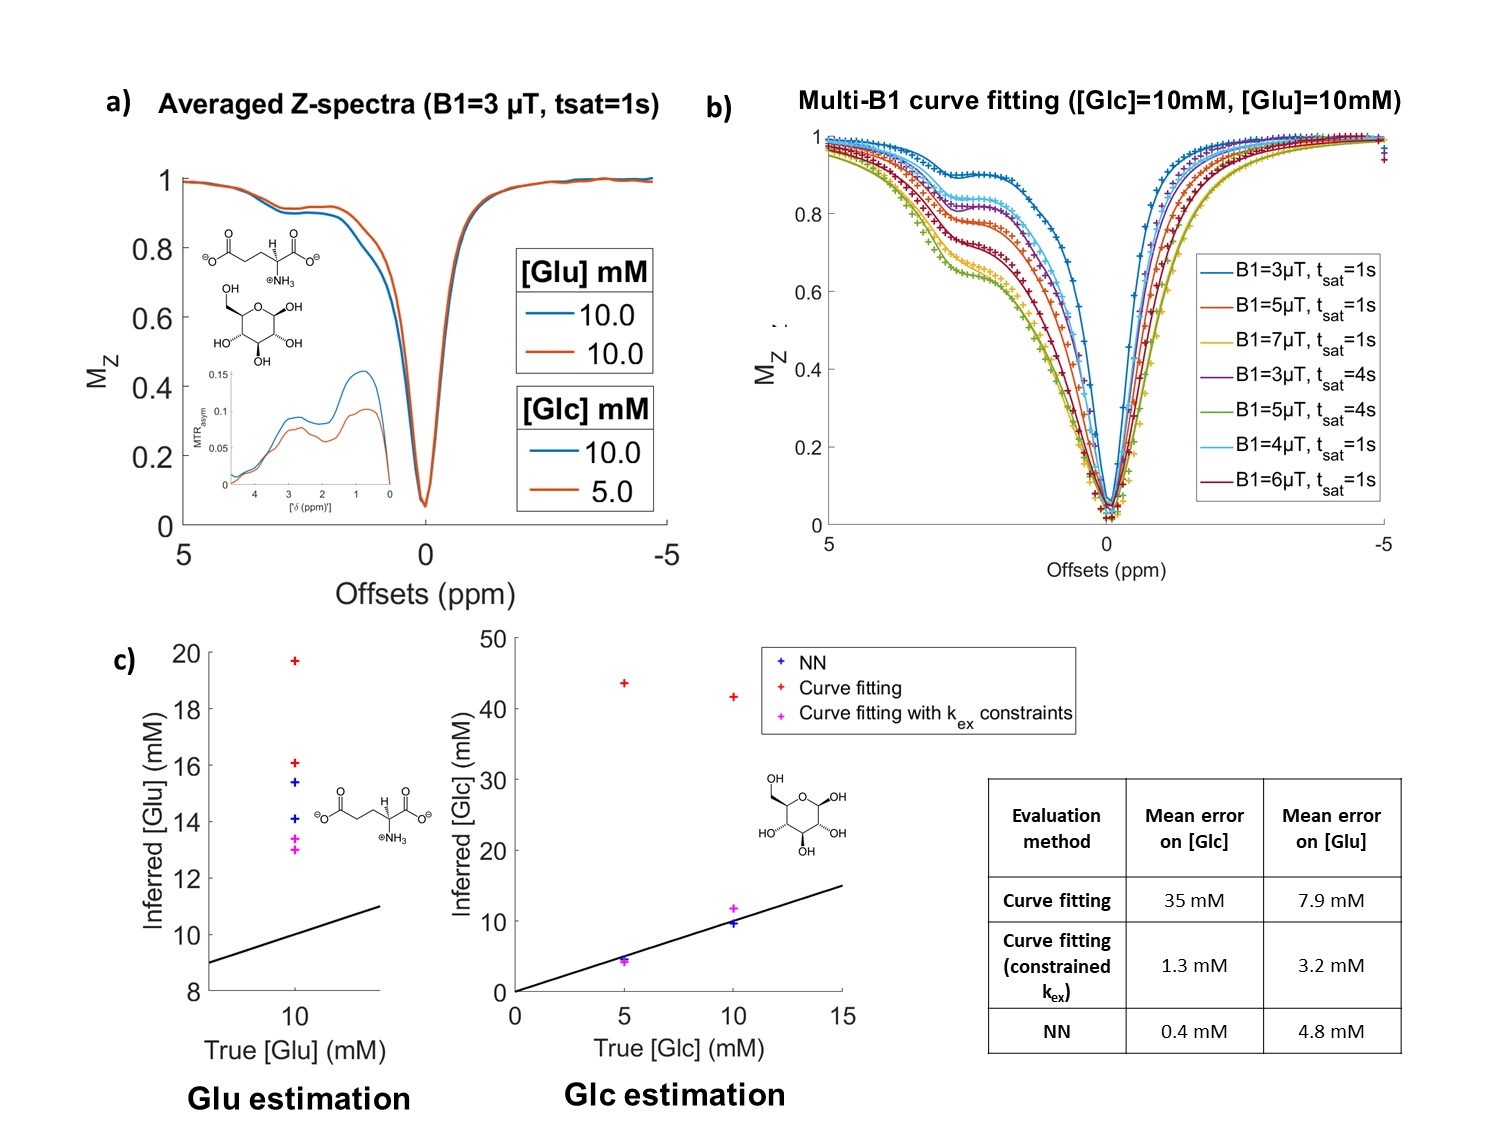
Figure 5: NN performance on mixed glucose and glutamate phantoms.
a) Experimental Z-spectra of the 2 mixed phantoms, measured here at B1=3 µT, tsat=1 s. b) Curve-fitting of the 10 mM/10 mM phantom. All B1 and tsat Z-spectra were fitted simultaneously to search for [Glc] and [Glu] concentrations. c) NN and curve-fitting predictions of glucose and glutamate concentrations using averaged Z-spectra. As initial curve-fitting gave poor results (red crosses), we performed a second curve-fitting while constraining the kex to probable values (obtained with a previous fit estimation of kex).