5182
Single-shot water/fat separation T2* mapping with multiple overlapping-echo detachment imaging1Department of Electronic Science, Xiamen University, Xiamen, China, 2Magnetic Resonance Center, Zhongshan Hospital Afflicated to Xiamen University, Xiamen, China, 3MSC Clinical & Technical Solutions, Philips Healthcare, Shenzhen, China
Synopsis
Keywords: Machine Learning/Artificial Intelligence, Quantitative Imaging, water/fat separation
Most of the water/fat separation techniques need to acquire multiple images with different echo time, which usually take long acquisition time. Multiple overlapping-echo detachment (MOLED) imaging can shorten acquisition time by acquiring multiple MR echo signals in the same k-space. Here, a new method for fast water/fat separation T2* mapping with MOLED technology was proposed, which can obtain quantitative T2* maps and M0 maps of water and fat in a single shot. In vivo experiment demonstrates that the proposed method can obtain accurate quantitative parameter values and accurate separation of water and fat images.Introduction
Water/fat separation is important for MRI applications. Additionally, T2* relaxation time of the water and fat signals can provide valuable information for biomedical research and clinical diagnosis of diseases.1 However, most of the water/fat separation techniques need to acquire multiple images with different echo time, which usually take long acquisition time, and may be susceptible to physiological motions, such as Dixon-based methods.2,3Multiple overlapping-echo detachment (MOLED)4 imaging provides an innovative idea for accelerating MR parametric mapping by acquiring multiple MR echo signals with different signal evolutions in the same k-space. Here, we proposed a new method for fast water/fat separation T2* mapping with MOLED technology. With MOLED technology, water and fat signals with different T2* weightings can be obtained in a single shot, which allows us to obtain quantitative T2* maps and M0 maps of water and fat without additional scans. Experimental results show that the proposed method can obtain accurate quantitative parameter values and accurate separation of water and fat images.
Methods
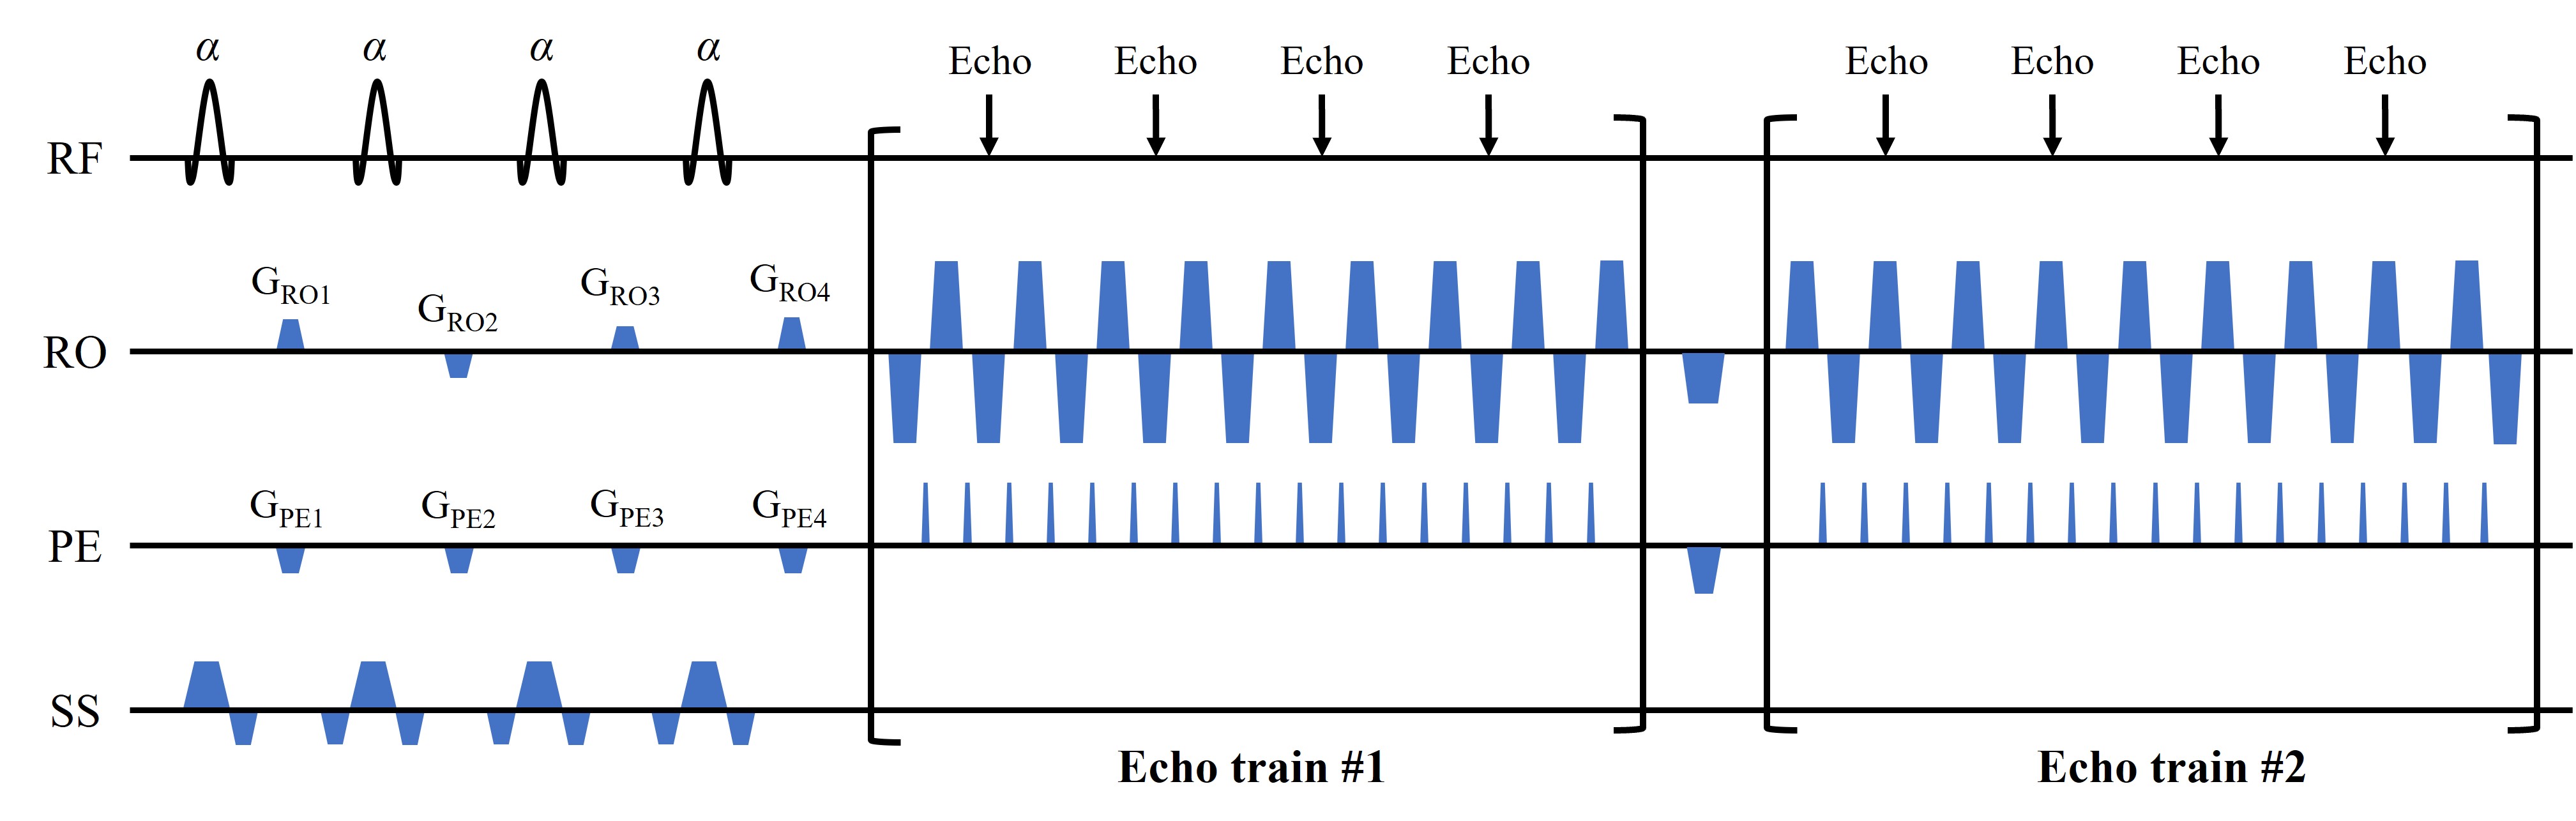
Pulse sequence design: The MOLED sequence is shown in Figure 1. Signals excited by four sequential RF pulses are moved to different locations in k-space by shifting gradients (GROi,GPEi,i=1,2,3,4). Echoes with different evolution time are acquired and overlapped in the k-space. GRE-EPI readout is used in two echo trains. Consequently, these echoes contain different information of water and fat, and convey T2* information with different weights, hence allowing water/fat separation and T2* quantification. There are eight echoes in two echo trains totally, providing enough information for multi-peak water/fat separation. The TEs of these echoes range from 5.45 ms to 43 ms, while the T2* value of water and fat in the leg region is generally distributed within 20-35ms. The appropriate TE range ensures the accurate T2* quantification.Signal model: The nth echo Sn with echo time TEn can be expressed as:
$$S_{n}=(W\times{e^{\frac{-TE_{n}}{T_{2,w}^*}}}+\sum_{m=1}^6\alpha_{m}e^{i2\pi\delta{f_{m}}TE_{n}}\times{F}\times{e^{\frac{-TE_{n}}{T_{2,f}^*}}})e^{i2\pi\phi{TE_{n}}}$$
where W and F represent the complex water and fat signals. A six-peak fat model is used in this work, and the relative amplitude αm of each peak as well as their frequency shift δfm are taken as a prior.5 φ(Hz) is off-resonance frequency induced by main magnetic field inhomogeneity. $$$T_{2,w}^*$$$is the T2* of water and $$$T_{2,f}^*$$$ is the T2* of fat. Here, we assume all fat peaks have equal T2*.
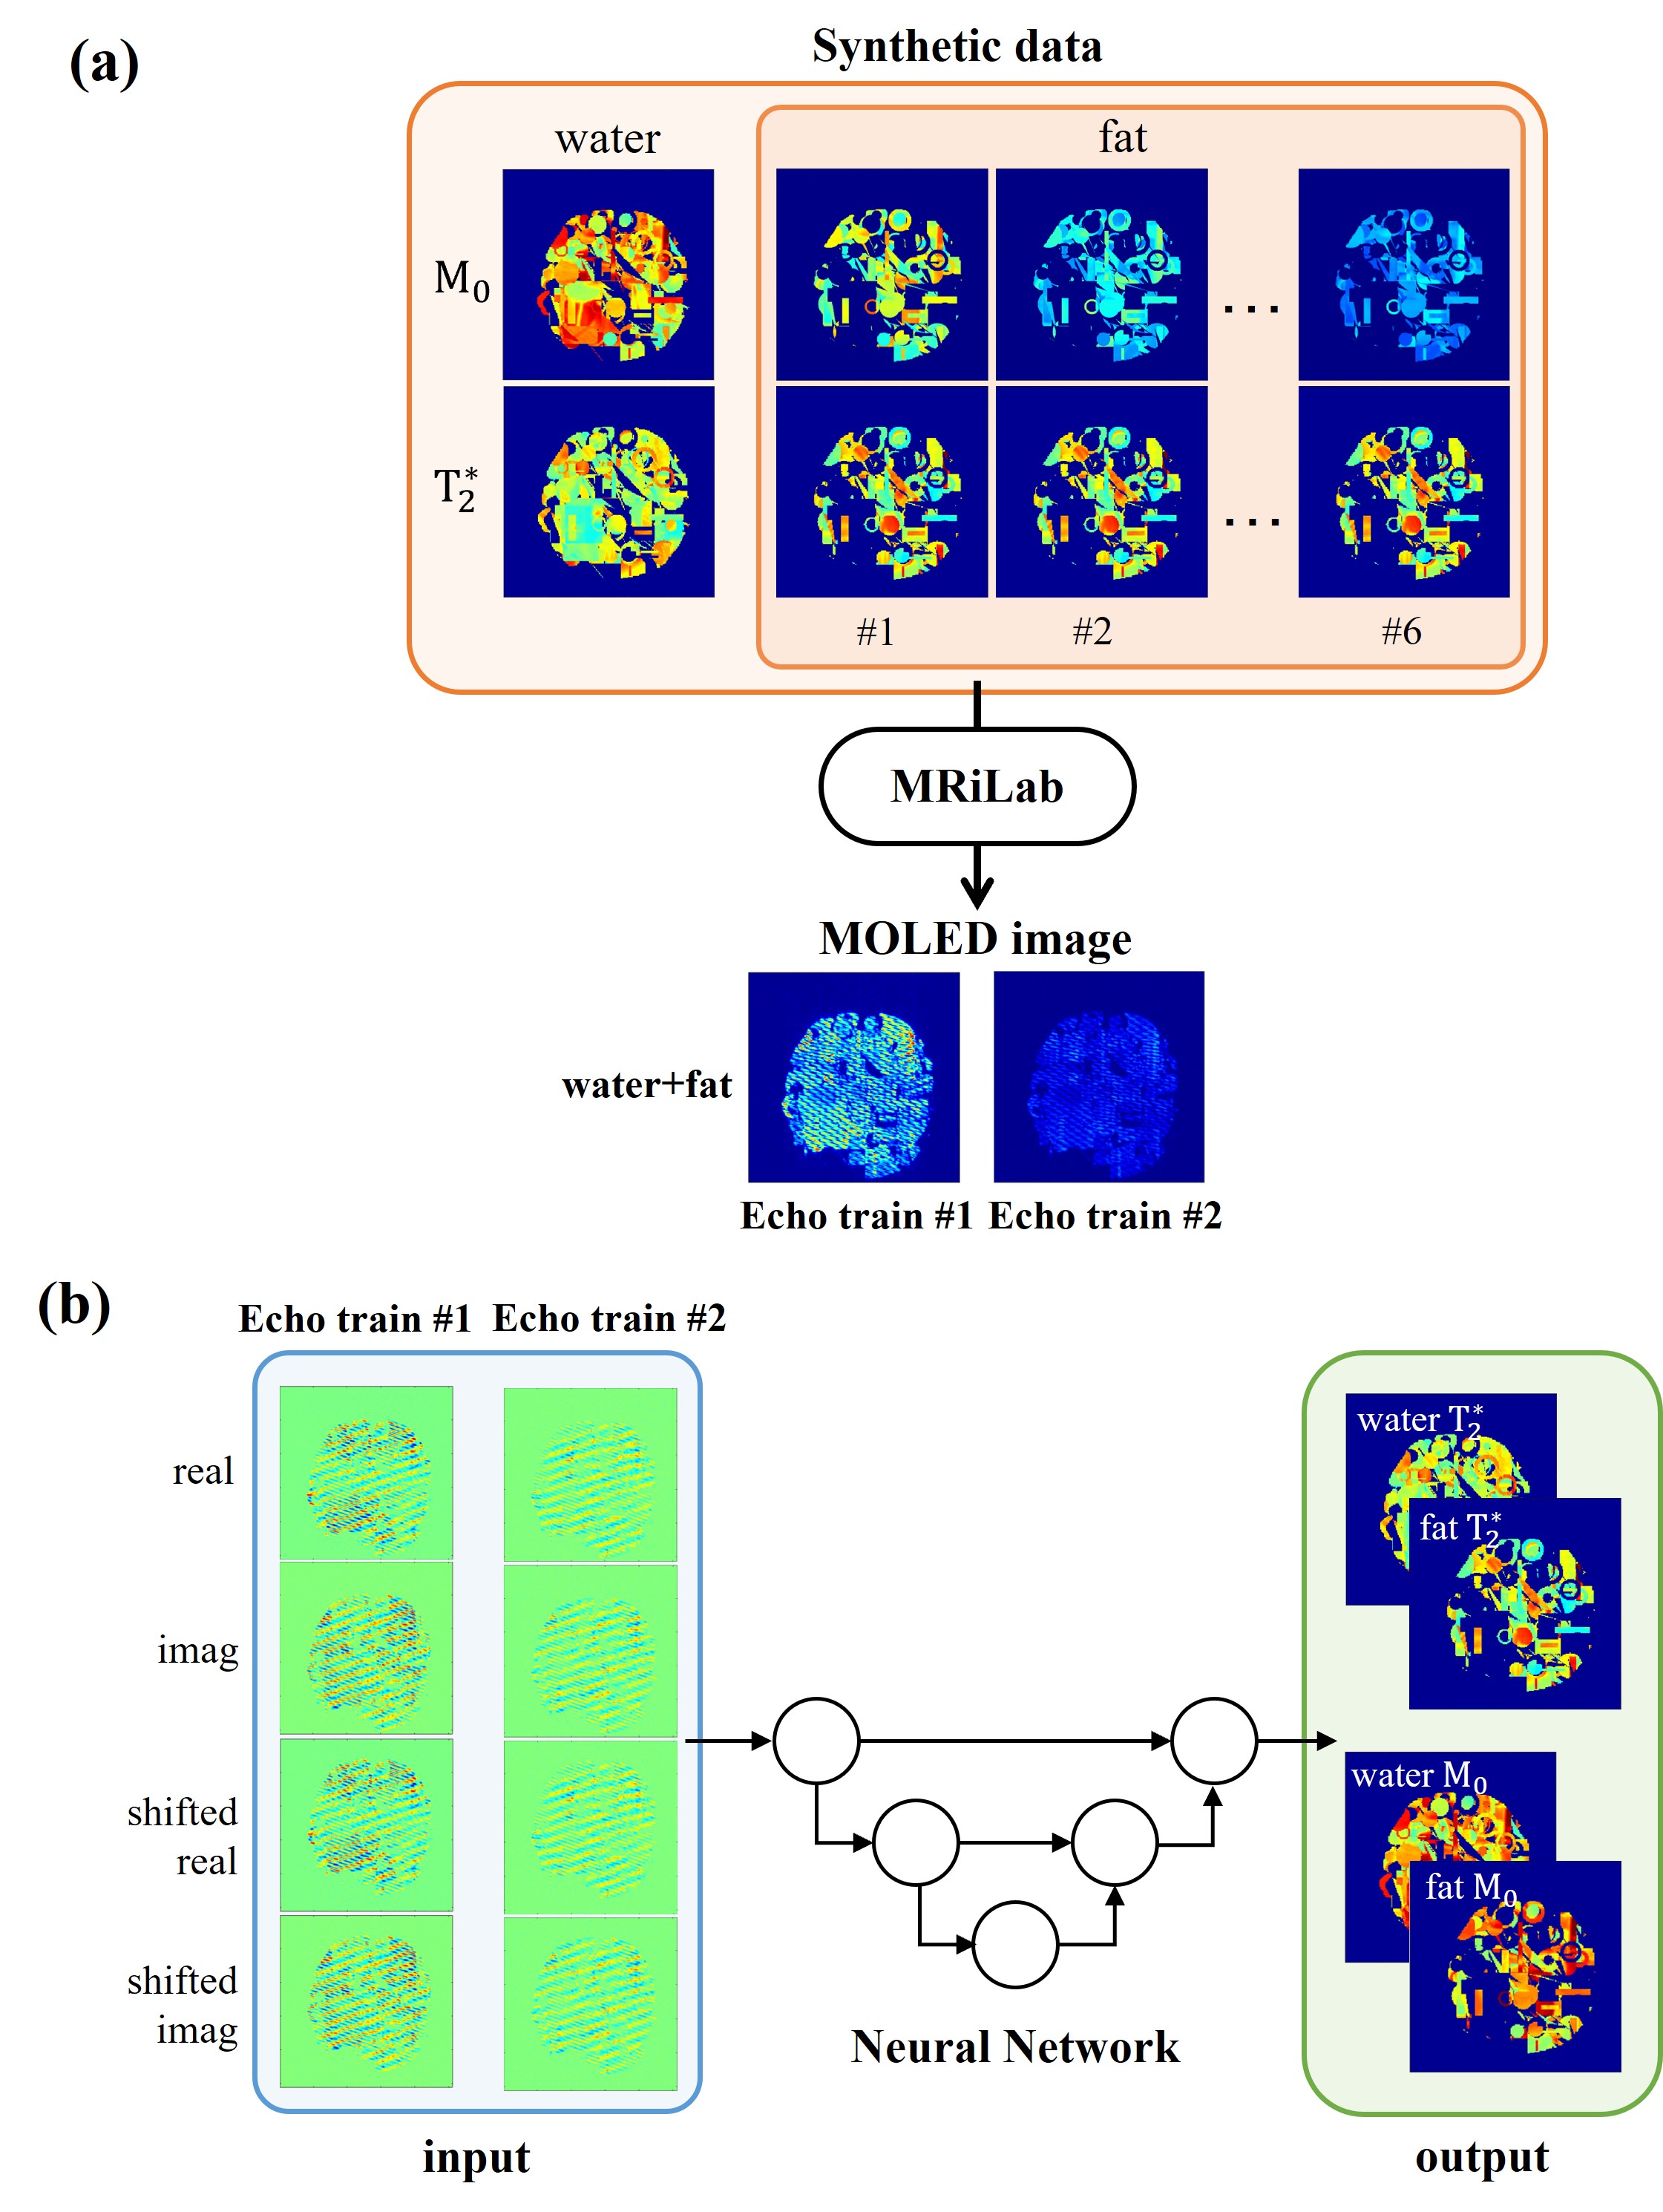
Water/Fat separation using neural network: The training data were generated using synthetic data and MRiLab software, as shown in Figure 2a. The MOLED sequence was used to stimulate water and six fat peak components to get their respective MR signals. The image of each component was obtained and added together to get the final MOLED image. U-Net was employed, as shown in Figure 2b. The inputs of U-Net are the real and imaginary parts of original MOLED image as well as shifted MOLED image to correct chemical shift artifact along the PE dimension, and the outputs are T2* maps and M0 maps of water and fat, respectively.
Experiments: This study was approved by the IRB at Zhongshan Hospital of Xiamen University. MOLED sequence was performed in the leg region on a 3T scanner (Ingenia CX, Philips Healthcare), using a 32-channel abdomen receive coil. Imaging parameters were as follows: flip angle of excitation pulse = 30°, TR = 6000 ms, ESP = 0.664 ms, FOV = 22×22 cm2, slice thickness = 5 mm, imaging matrix size= 128×124. The traditional mDixon-Quant technique and GRE sequence were used to obtain reference images. Single slice scan time of MOLED, mDixon-Quant and GRE were 65, 448 and 5514 ms, respectively.
Results
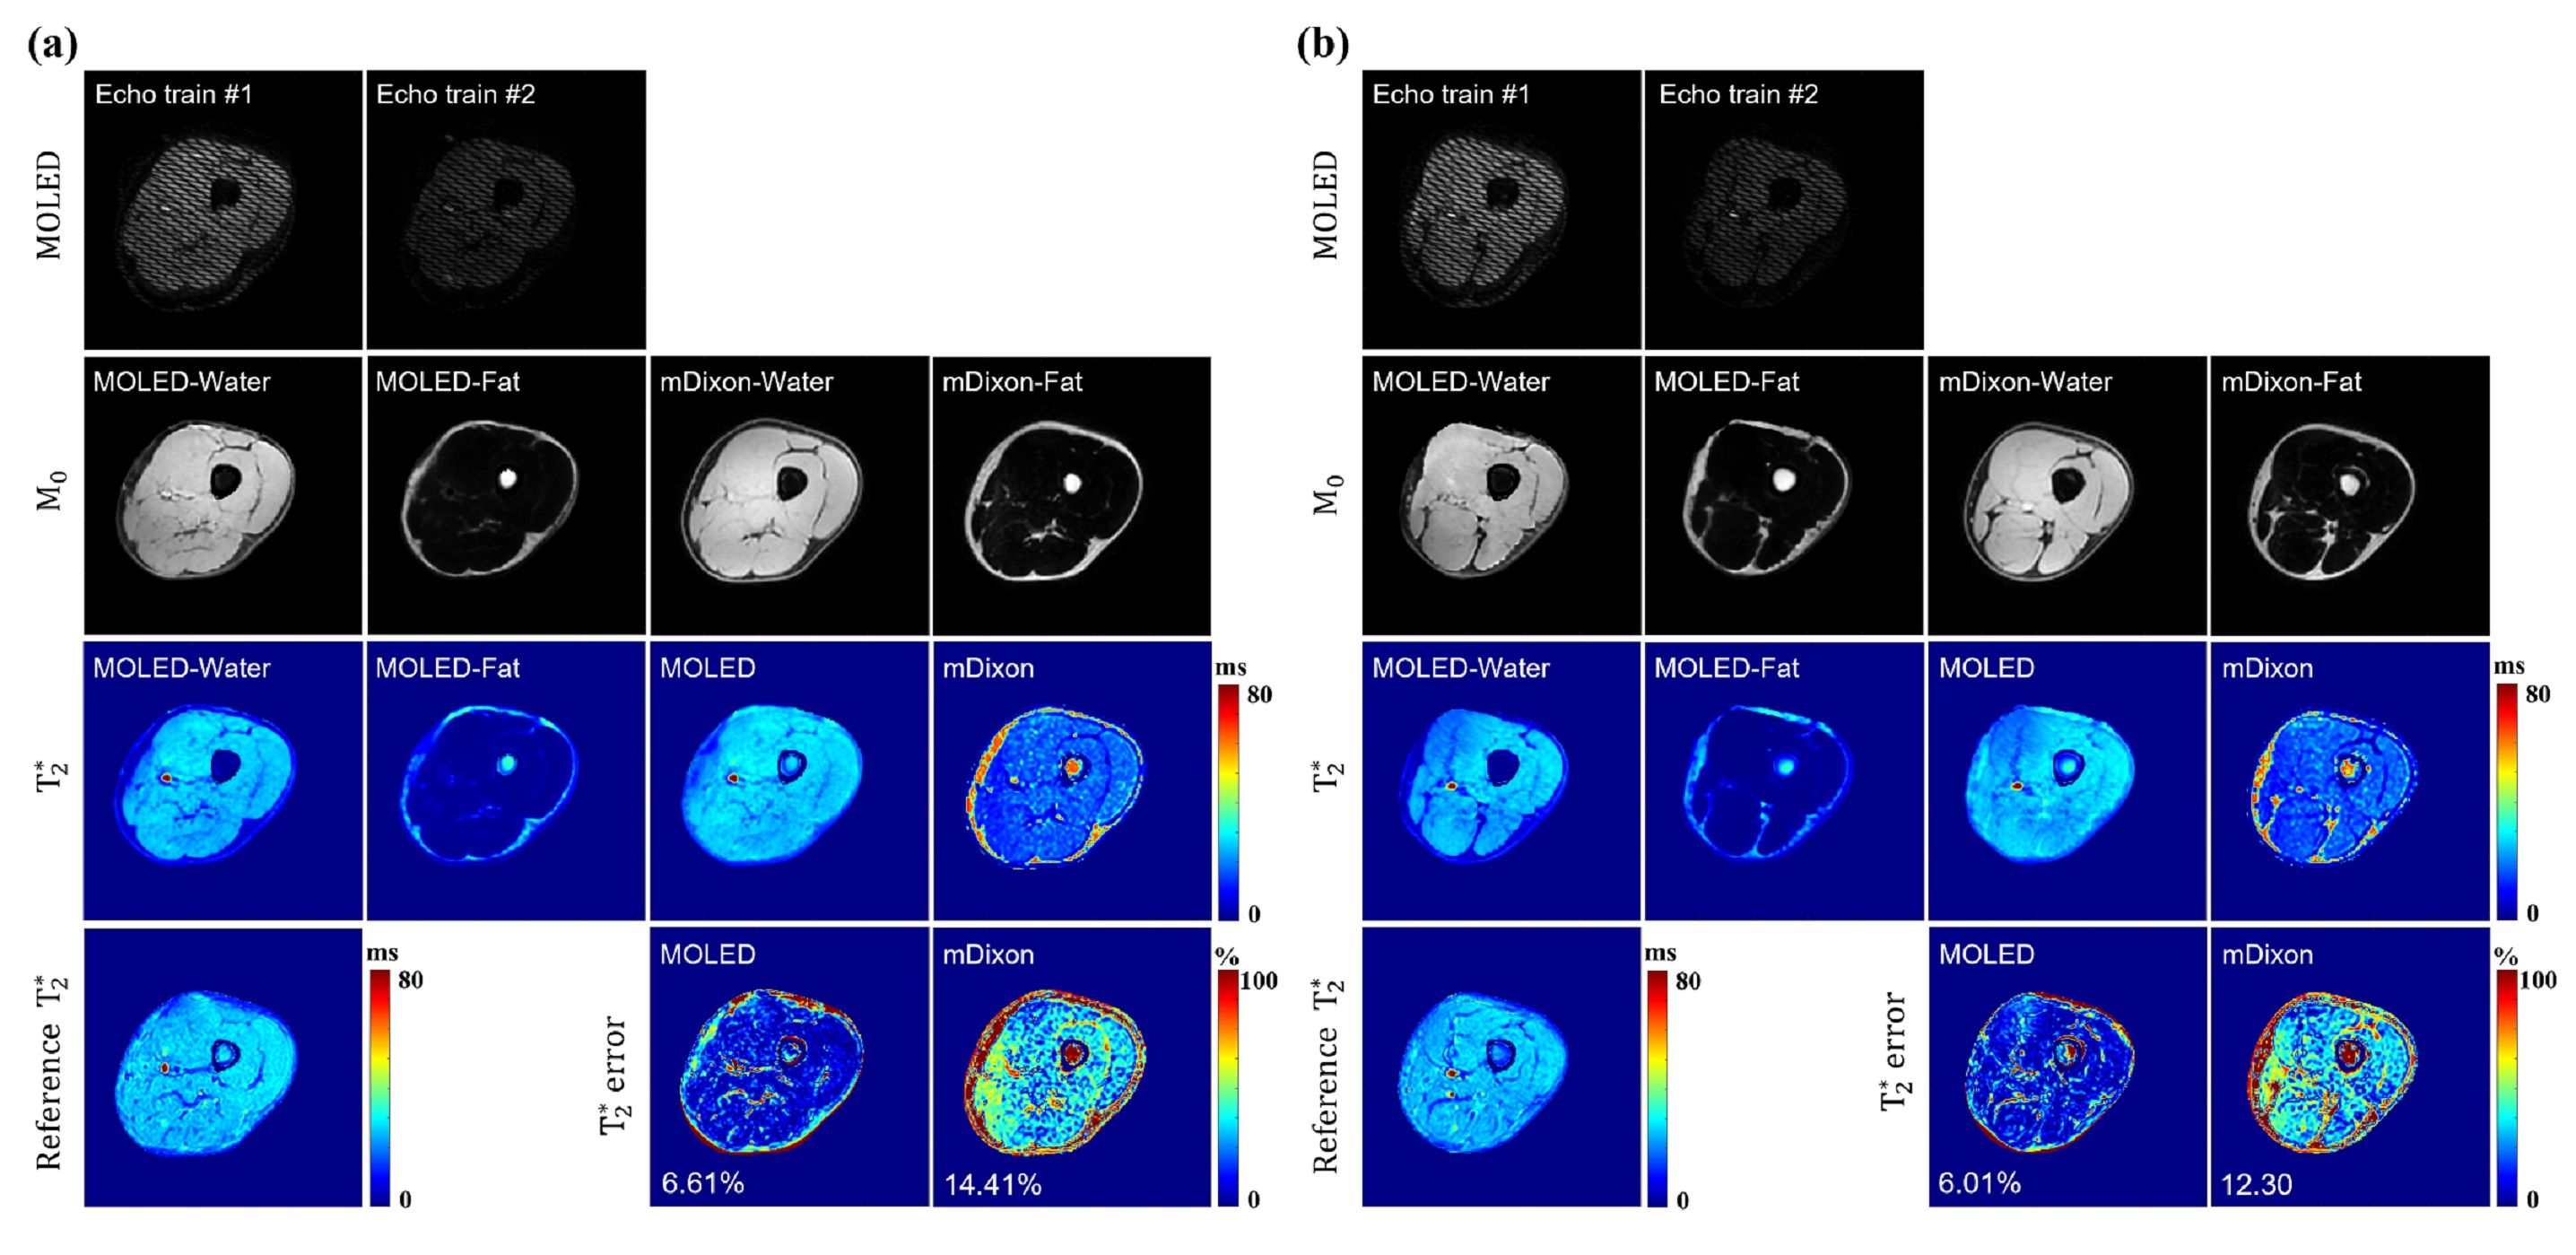
Figure 3 shows the water/fat separation results of two different slices (a and b). The second row shows the M0 mapping results. The water/fat separation results of MOLED are accurate and show clear texture, matching well with mDixon. Besides, the chemical shift artifacts along the PE dimension are corrected. The third row displays the T2* mapping results. Especially, the third image in the third row is the T2* map of MOLED obtained by adding the T2* maps of water and fat. The fourth row shows the reference T2* map obtained by GRE sequence and the T2* error maps. In slice #1 (Figure 3a), the average errors of the maps of MOLED and mDixon are 6.61%, 14.41%, respectively, and in slice #2 (Figure 3b), the corresponding values are 6.01%, 12.30%, respectively. This indicates that MOLED can obtain more accurate T2* maps of water and fat than mDixon.Discussion and conclusion
In this work, we proposed a new method for fast water/fat separation T2* mapping based on MOLED technology, which allows us to obtain T2* maps and M0 maps of water and fat in a single shot. Multi-peak fat model, synthetic data, and U-Net were used in image reconstruction. The proposed method can obtain accurate quantitative parameter values and accurate separation of water and fat images.Acknowledgements
This work was supported by the National Natural Science Foundation of China under grant numbers 82071913 and 11775184.References
1. Ster C L, Gambarota G, et al. Breath-hold MR measurements of fat fraction, T1, and T2* of water and fat in vertebral bone marrow. Journal of magnetic resonance imaging, 2016, 44(3):549-555.
2. Dixon WT. Simple proton spectroscopic imaging. Radiology, 1984, 153:189-194.
3. Fuller S, Reeder S, et al. Iterative decomposition of water and fat with echo asymmetry and least-squares estimation (IDEAL) fast spin-echo imaging of the ankle: initial clinical experience. Ajr Am J Roentgenol, 2006, 187(6):1442-1447.
4. Ma LC, Wu J, et al. Single-shot multi-parametric mapping based on multiple overlapping-echo detachment (MOLED) imaging. Neuroimage, 2022, 263:119645.
5. Yu H, Shimakawa A, et al. Multiecho water-fat separation and simultaneous R2* estimation with multifrequency fat spectrum modeling. Magnetic resonance in medicine, 2008, 60(5):1122-1134.
Figures