5179
Reproducible DL-based approach for liver PDFF quantification1Biomedical Imaging Center, Pontificia Universidad Católica de Chile, Santiago, Chile, 2i-Health Millennium Institute for Intelligent Healthcare Engineering, Santiago, Chile, 3Department of Electrical Engineering, Pontificia Universidad Católica de Chile, Santiago, Chile, 4Institute for Biological and Medical Engineering, Pontificia Universidad Católica de Chile, Santiago, Chile, 5Radiology Department, School of Medicine, Pontificia Universidad Católica de Chile, Santiago, Chile, 6Institute for Mathematical & Computational Engineering, Pontificia Universidad Católica de Chile, Santiago, Chile
Synopsis
Keywords: Machine Learning/Artificial Intelligence, Quantitative Imaging, Convolutional Neural Network
Liver PDFF is a biomarker correlated with hepatic pathologies. Recently, several Deep Learning (DL) methods have been proposed to accelerate the necessary post-processing to estimate PDFF. However, none of these techniques had been assessed in terms of bias and precision, as suggested by the ISMRM quantitative MR study group. We propose a two-stages framework denoted Variable Echo Times neural Network (VET-Net), which considers multi-echo MR images and their echo times to estimate PDFF. VET-Net showed a bias of -1.35% when tested over a multi-site phantom dataset, and a within-standard deviation of 0.81% over liver MR images with different TEs.Introduction
Non-Alcoholic Fatty Liver Disease (NAFLD) is a pathology that has been declared as an epidemic, with an estimated global prevalence of 25%1. Proton density fat fraction (PDFF), which could be estimated using chemical shift encoded (CSE) MR images, is a biomarker that has already demonstrated a significant correlation to NAFLD2.Recently, several Deep Learning (DL)-based methods have been proposed to estimate PDFF, and they have demonstrated shorter post-processing times and promising results using fewer data than standard protocols3–5. In this work, we propose a novel two-stages DL-based approach to estimate liver PDFF from CSE-MR images obtained with any combination of echo times (TE).
Theory
The pixelwise physical model that describes the CSE-MR signal at each echo could be described in the following matrix form: $$\mathbf{s}=\mathbf{W}(\xi)\mathbf{M}\mathbf{\rho}$$Where, $$$\mathbf{s}=[I_1,...,I_n]^T$$$ contains the MR signal at each echo, $$$\mathbf{W}(\xi)=\hbox{diag}\left([e^{j2\pi\xi\cdot t_1},...,e^{j2\pi\xi\cdot t_n}]\right)$$$ contains the non-linear effects of R2* and Δf, which are merged in a single complex variable $$$\xi=\Delta f+jR_{2}^{*}/2\pi$$$, $$$\mathbf{M}$$$ describes the spectral behavior of each chemical specie (water, fat), $$\mathbf{M}=\begin{bmatrix}1&\sum_{p=1}^{P}\alpha_p\cdot e^{j2\pi f_{F,p}\cdot t_1} \\\vdots & \vdots \\1 & \sum_{p=1}^{P}\alpha_p\cdot e^{j2\pi f_{F,p}\cdot t_n} \end{bmatrix}$$ and, finally, $$$\mathbf{\rho}=[\rho_W,\rho_F]^T$$$ contains both water and fat proton densities.
Considering the matrix formulation described in (1), if R2* and Δf are determined first, it is possible to separate the MR signal into its water and fat components using the Least Squares Method (LSM): $$\mathbf{\rho}=\mathbf{W}(-\xi)\mathbf{M}^+\mathbf{s}$$
Finally, PDFF is computed considering the pixelwise ratio of fat signal: $$\hbox{PDFF}=\frac{\rho_F}{\rho_W+\rho_F}$$
Methods
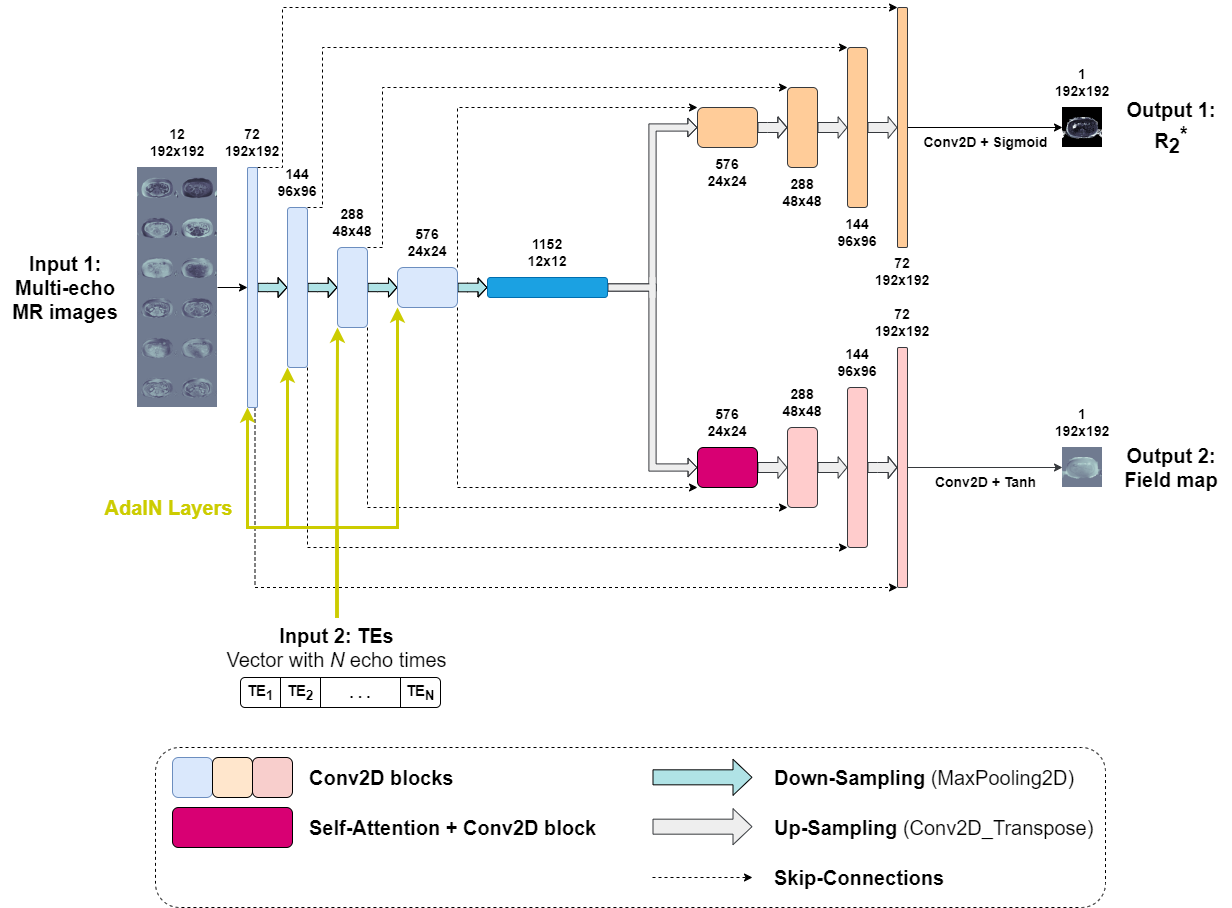
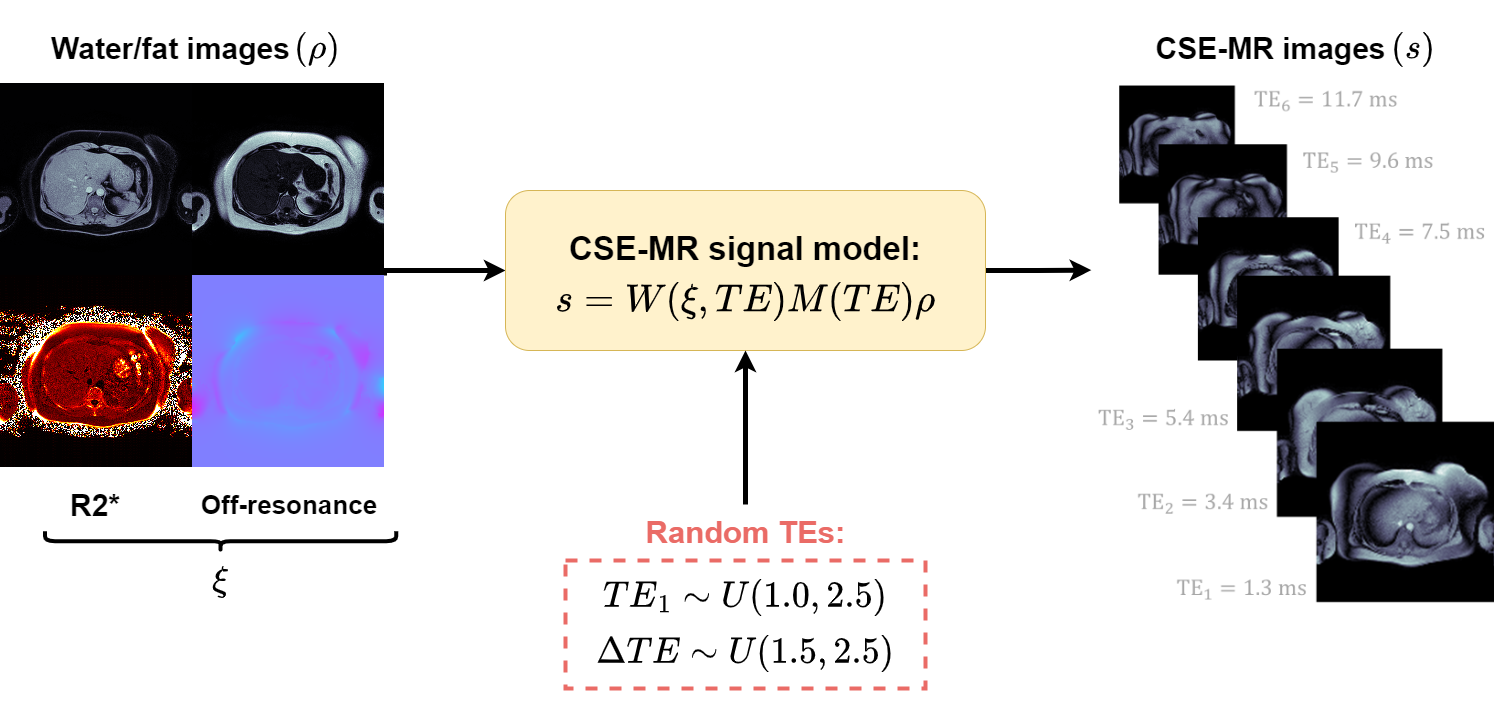
We implemented a Convolutional Neural Network (CNN) denoted as Variable Echo-Times Neural Network (VET-Net) to estimate PDFF with a two-stages procedure. First, R2* and Δf maps were estimated by a two-decoder U-Net using 6-echoes CSE-MR images as input. Additionally, a VET-Net also received a second input, which corresponds to a vector with the TE values that was incorporated to the encoder features using Adapting Instance Normalization (AdaIN) layers6 (Figure 1). Finally, PDFF map was estimated using (3) and (4).For VET-Net learning to estimate R2* and Δf maps at any feasible echo time combination, we developed a data augmentation scheme to generate synthetic CSE-MR images from ground-truth results, which were obtained using Graph Cuts7 and standard protocol images (Figure 2). The considered loss function was the mean absolute error of R2* and Δf with respect to reference results.
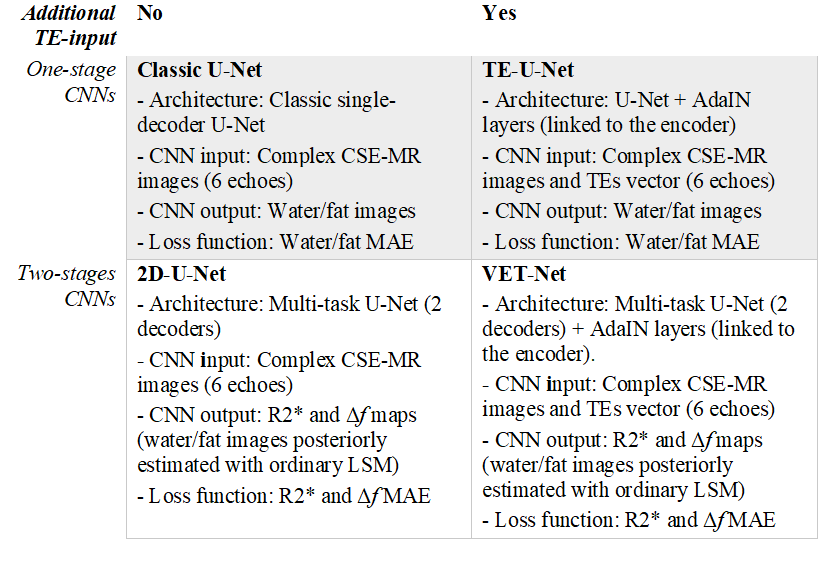
To assess VET-Net, we compared it to: 1) A classic U-Net that directly estimated water/fat images from multi-echo images without TE input; 2) A U-Net that considered TE values to estimate water/fat images (TE-U-Net); 3) a two-decoder U-Net to estimate R2* and Δf without an extra TE input (2D-U-Net). All these models were trained considering the same data and hyperparameter configuration (200 epochs, unitary batch-size, LR=1×10⁻⁴, Adam optimizer). Every model was assessed considering bias and precision, using a Multi-Site Multi-Vendor Phantom Dataset8 and repeated CSE-MR scans with different TEs over a subset of 20 volunteers, respectively (Table 1). Considering CSE-MR images acquired with different TEs, we estimated a within standard deviation (wSD) and a reproducibility coefficient (RDC=2.77×wSD) for two different liver ROIs of the testing subjects.
Results
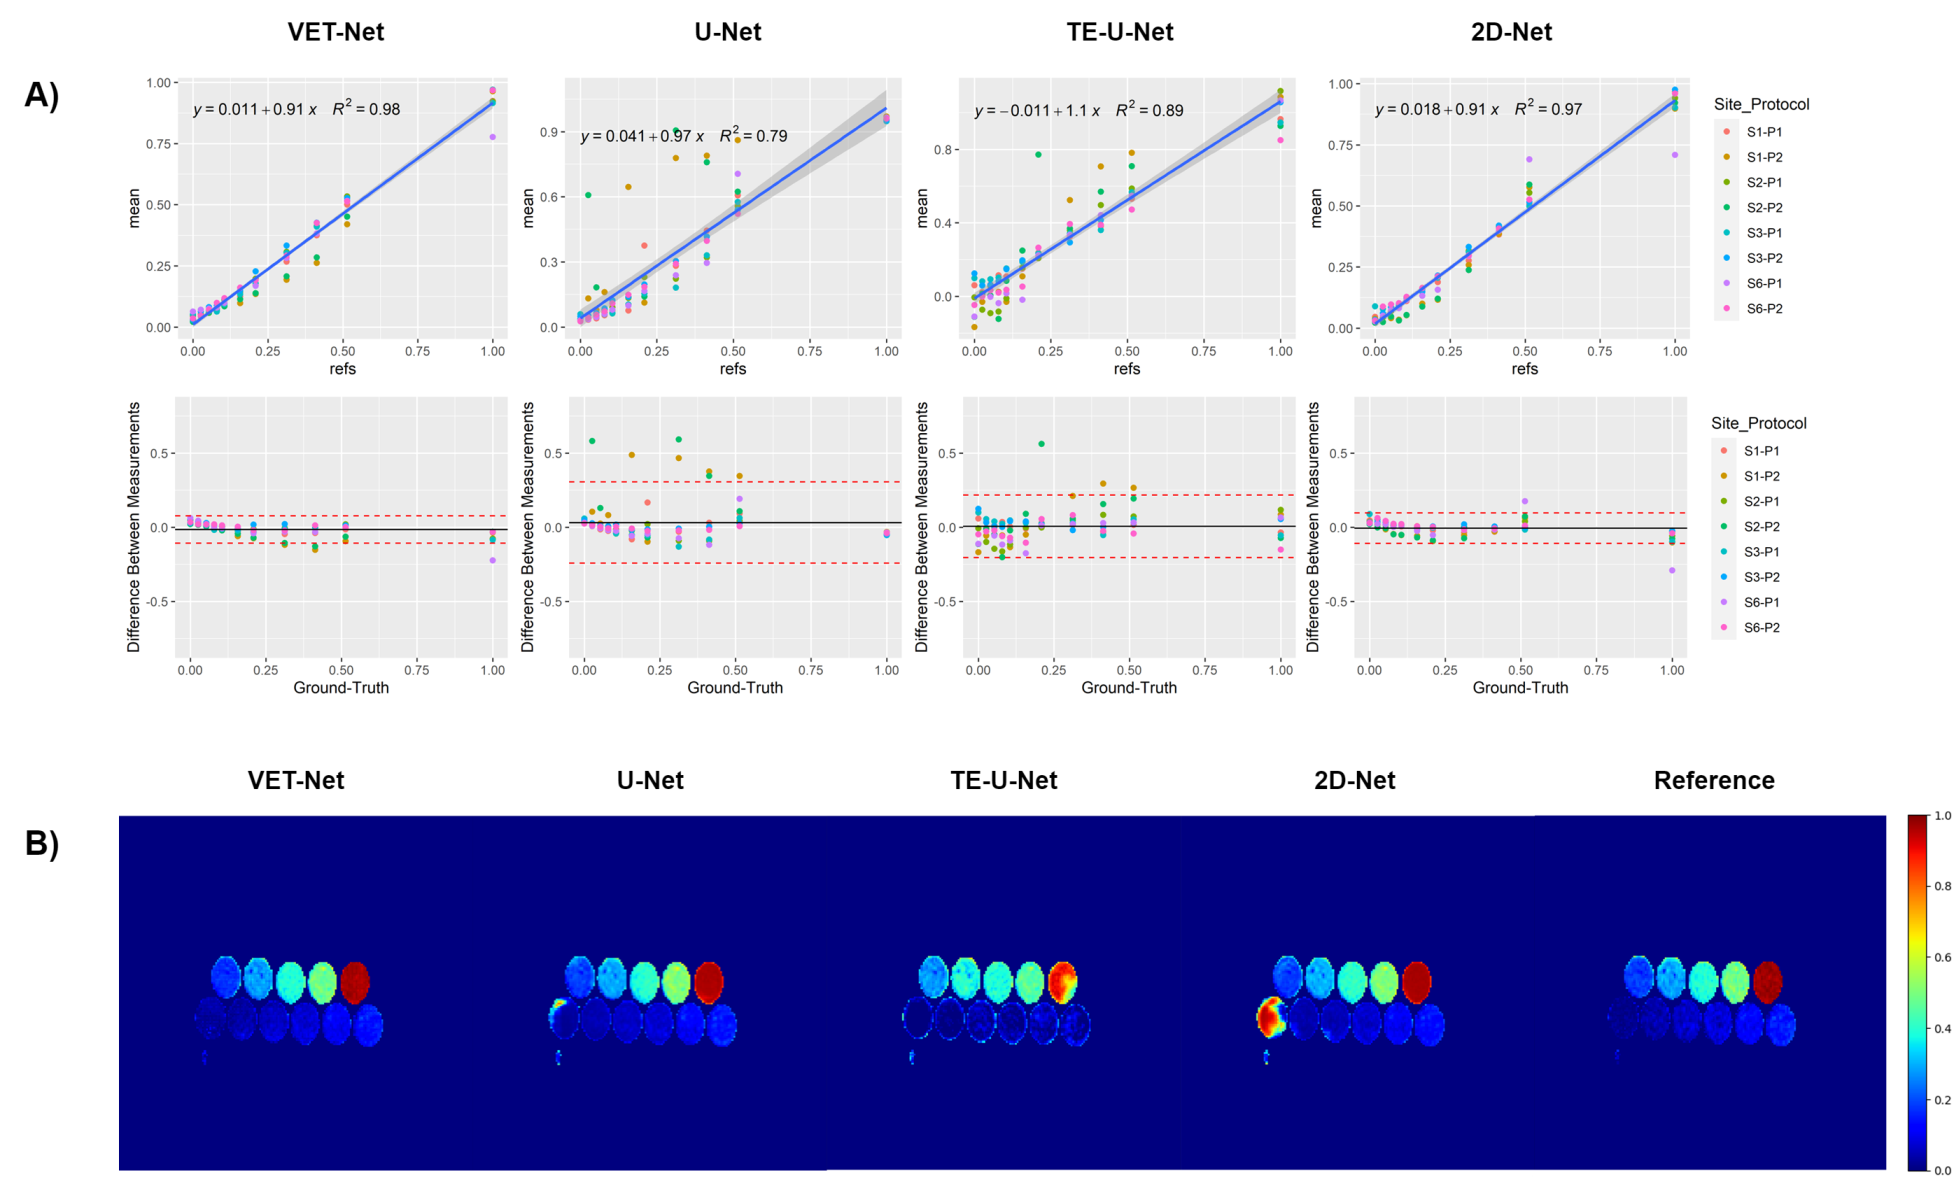
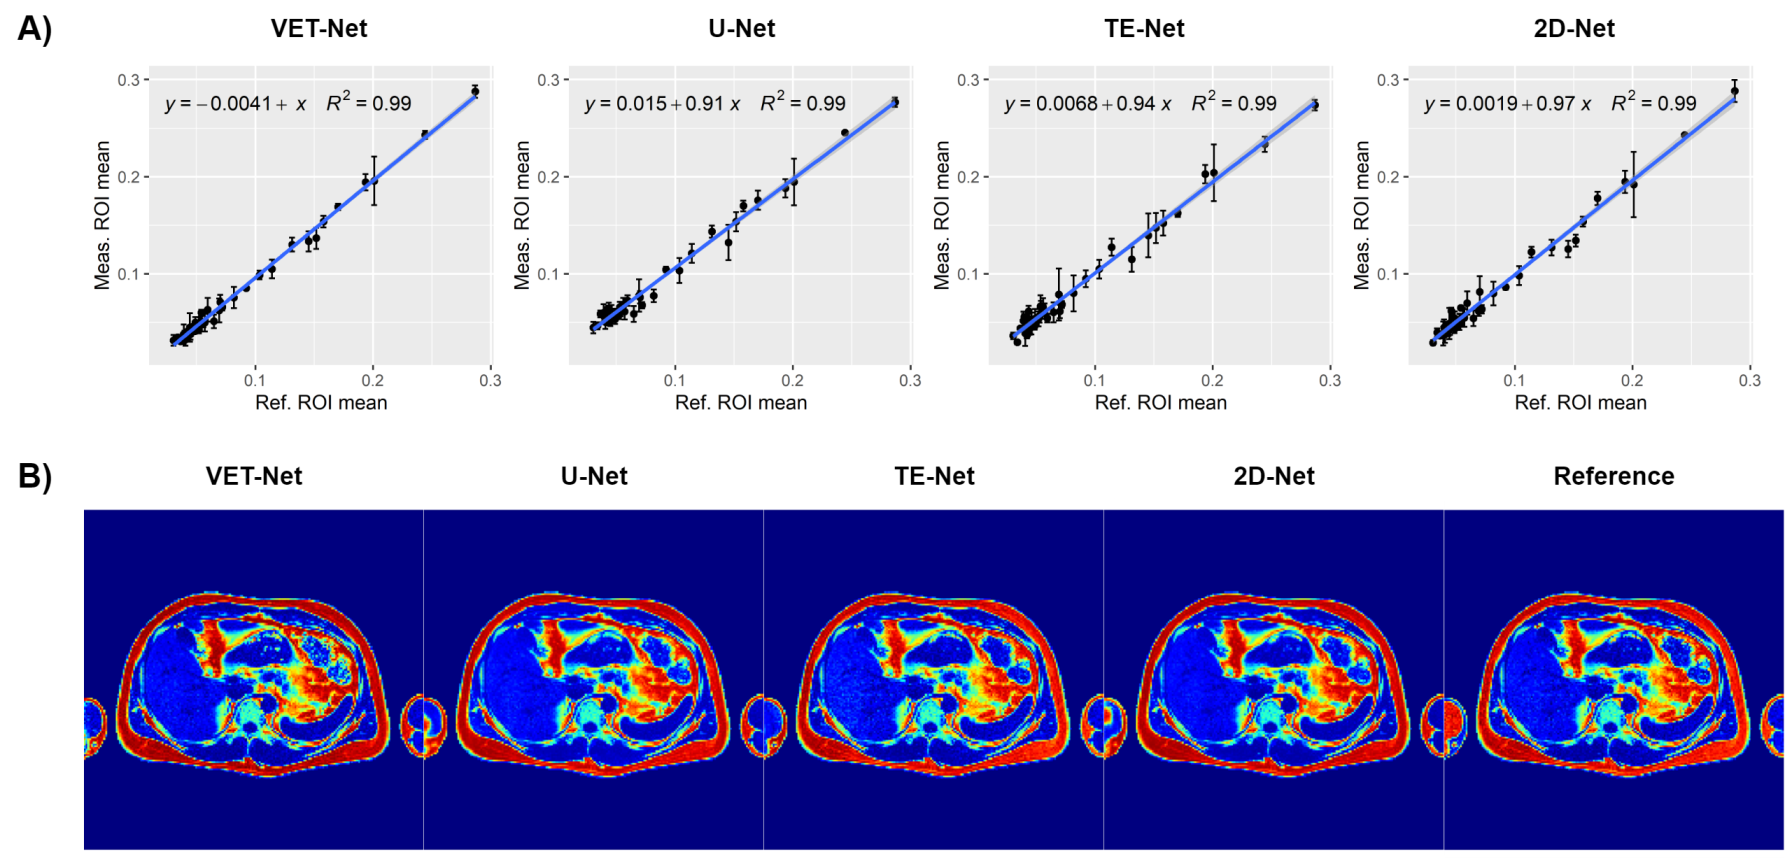
Ordinary least-squares regression analysis of PDFF measurements at each phantom vial showed the following correlation slope (CS) and overall bias (OB) with respect to ground-truth values: 1) CS=0.91 (R2=0.98) and OB=-1.35% for VET-Net; 2) CS=0.97 (R2=0.79) and OB=3.26% for U-Net; 3) CS=1.10 (R2=0.89) and OB=0.79% for TE-U-Net; 4) CS=0.91 (R2=0.97) and OB=0.43% for 2D-U-Net.The least-squares correlation and Bland-Altman plots of each implemented method are showed in Figure 3A. For a visual assessment, results obtained for CSE-MR images acquired in the first site of the phantom dataset are showed in Figure 3B.
Mean wSD ($$$\widehat{\hbox{wSD}}$$$) and RDC ($$$\widehat{\hbox{RDC}}$$$) for each method were: 1) $$$\widehat{\hbox{wSD}}=0.81\pm1.92\%$$$ ($$$\widehat{\hbox{RDC}}=2.25\pm4.42\%$$$) for VET-Net; 2) $$$\widehat{\hbox{wSD}}=0.83\pm2.02\%$$$ ($$$\widehat{\hbox{RDC}}=2.31\pm4.52\%$$$) for U-Net; 3) $$$\widehat{\hbox{wSD}}=1.09\pm2.64\%$$$ ($$$\widehat{\hbox{RDC}}=3.02\pm5.93\%$$$) for TE-U-Net; 4) $$$\widehat{\hbox{wSD}}=0.94\pm2.63\%$$$ ($$$\widehat{\hbox{RDC}}=2.61\pm5.12\%$$$) for 2D-U-Net.
Each subject wSD is showed in the correlation plot of Figure 4A. For a visual comparison, results obtained with each method for a sample liver MR image are showed in Figure 4B.
Discussion
The introduction of two novel features (two-stages water-fat separation, incorporation of TE values as a second input) improved the performance of VET-Net in terms of bias and precision, both performance metrics suggested by the ISMRM quantitative MR study group9.We observed that U-Net, implemented as is frequently done, showed an excessive and highly uncertain bias, which suggested that this framework has the tendency to overfit the training data. Conversely, the incorporation of two-stages framework significantly decreased the bias, and the incorporation of TE values as a second input additionally improved the precision.
Conclusion
The bias and precision showed by VET-Net confirmed that this method has a greater potential to become of feasible use in clinical practice, with a high robustness and reproducibility. However, there is still room for improvement, as actual reference techniques for PDFF estimation have reported correlation slopes of 0.98 (R2=0.96), overall bias lower than 0.2% and RDCs (across different hardware systems) of 4.3% have been reported for reference methods10.Acknowledgements
This work was funded by ANID – Millennium Science Initiative Program – ICN2021_004 and PUENTE grant 2022-14 VRI, PUC. J.M. was funded by the National Agency for Research and Development (ANID) / Scholarship Program / DOCTORADO BECAS CHILE/2020 – 21210665. C.T was funded by Fondecyt 1191710 and 1231535, Anillo PIA-ACT192064. CSL was funded by ANID – FONDECYT – 1211643” y a “Centro Nacional de Inteligencia Artificial CENIA, FB210017, BASAL, ANID.References
1. Loomba, R. & Sanyal, A. J. The global NAFLD epidemic. Nat Rev Gastroenterol Hepatol 10, 686–690 (2013).
2. Idilman, I. S. et al. Hepatic steatosis: Quantification by proton density fat fraction with MR imaging versus liver biopsy. Radiology 267, 767–775 (2013).
3. Andersson, J., Ahlström, H. & Kullberg, J. Separation of water and fat signal in whole-body gradient echo scans using convolutional neural networks. Magn Reson Med 82, 1177–1186 (2019).
4. Jafari, R. et al. Deep neural network for water/fat separation: Supervised training, unsupervised training, and no training. Magn Reson Med (2021) doi:10.1002/mrm.28546.
5. Liu, K. et al. Robust water–fat separation based on deep learning model exploring multi-echo nature of mGRE. Magn Reson Med 1–14 (2020) doi:10.1002/mrm.28586.
6. Huang, X. & Belongie, S. Arbitrary Style Transfer in Real-Time with Adaptive Instance Normalization. Proceedings of the IEEE International Conference on Computer Vision 2017-Octob, 1510–1519 (2017).
7. Hernando, D., Kellman, P., Haldar, J. P. & Liang, Z. P. Robust water/fat separation in the presence of large field inhomogeneities using a graph cut algorithm. Magn Reson Med 63, 79–90 (2010).
8. Hernando, D. et al. Multisite, multivendor validation of the accuracy and reproducibility of proton-density fat-fraction quantification at 1.5T and 3T using a fat–water phantom. Magn Reson Med 77, 1516–1524 (2017).
9. Weingärtner, S. et al. Development, validation, qualification, and dissemination of quantitative MR methods: Overview and recommendations by the ISMRM quantitative MR study group. Magn Reson Med 87, 1184–1206 (2022).
10. Yokoo, T. et al. Linearity, bias, and precision of hepatic proton density fat fraction measurements by using MR imaging: A meta-analysis. Radiology 286, 486–498 (2018).
Figures