5177
Does MADI Detect Temporal Brain Metabolic Activity Changes?1Advanced Imaging Research Center, Oregon Health & Science University, Portland, OR, United States
Synopsis
Keywords: Molecular Imaging, Metabolism, Activity
Metabolic Activity Diffusion Imaging [MADI] maps on-going sodium pump metabolic flux. Here, we investigate the question as to whether MADI can detect temporal changes of this activity in sequential acquisitions from the healthy human brain.
INTRODUCTION
Metabolic Activity Diffusion Imaging [MADI] is a novel non‑invasive, high-resolution DWI method for mapping sodium pump, Na+,K+-ATPase [NKA], metabolic activity.1-3 It is based on active trans‑membrane water cycling [AWC], a phenomenon discovered previously.4 With AWC, the homeostatic cellular water efflux rate constant, kio, is proportional to MRNKA/V, where MR is metabolic rate and V is the average cell volume. MADI disentangles kio and V changes in order to estimate MRNKA. Accordingly, it was shown the awake, resting human brain kioV map correlates [qualitatively and quantitatively] with the 18FDG-PET glucose uptake metabolic rate [MRglu] map.2 This is consistent with homeostatic ATP production by central carbon metabolism and ATP consumption by NKA.2METHODS
A healthy 67 year-old male volunteer subject, who frequently sleeps during MRI, was recruited under a local IRB-approved protocol. A signed informed consent was obtained beforehand. Multi-slice DWI, with a Siemens [SMS] Prisma 3T instrument, used a single-shot spin‑echo echo-planar imaging sequence. The Prisma whole-body coil set produces bipolar [twice-refocused] pulsed field gradients [PFGs]. Three orthogonal PFG directions were applied sequentially. A 20‑channel head RF coil matrix [SMS] was employed. Sixteen evenly-spaced b values [0 to 5000 s/(mm)2 were acquired by incrementing PFG strengths. The ~31,000 voxels/slice had nominal dimensions [0.80x0.80x3.2 (mm)3; 2.0 μL], arising from a 192x256 (mm)2 FOV, and [TR/TE: 9500 ms/92 ms]. With SMS software zero-filling, the effective resolution is (1.60 mm)2. Thus, the effective voxel volume is [1.60x1.60x3.2] 8.2 μL/voxel. Six sequential DWI data sets were acquired. Though these required 7.8 minutes each, there were 10.5 minute intervals between them [with T1-w acquisitions not used here]. The entire imaging session lasted 115 minutes.RESULTS
Figure 1A shows the axial DWI obtained at b = 335 s/(mm)2 in the third acquisition. Panels A-D show the MADI parametric maps: B) the voxel cell density (ρ, [105 cells/μL]) image; C) the voxel-mean cell volume (<V> [pL]) map; and D) the voxel-mean (<kio> [s-1]) image. These exhibit magnitudes and patterns consistent with the pathology and MADI literature: ρGM < ρWM; <V>GM > <V>WM, and <kio>GM < <kio>WM.2For a different slice, Figure 2 shows the axial voxel-mean <kioV> maps, in [pL/s], for: A) the first DWI acquisition; B) the fourth DWI acquisition; and C) the sixth DWI acquisition. These each also exhibit the pattern consistent with the prior MADI result: <kioV>GM > <kioV>WM.2 Though the parenchymal-averaged <kioV>parenchyma values are essentially constant for the three acquisitions, there are interesting regional differences evident. For the Fig. 2 slice, Figure 3 shows pixel-by-pixel <kioV> difference maps: A) 1st minus 3rd; and B) 1st minus 6th co‑registered DWI acquisitions.
DISCUSSION
Each GM and WM voxel has ~106 cells and ~6x10⁶ cells, respectively.2 Every neural cell has high and low MRNKA bursts, very short5 compared with the 7.8 minute MADI acquisition time. Thus, there is a great deal of MRNKA averaging, <MRNKA>. In the Fig. 3 <kioV> difference [Δ<kioV>] maps, individual pixels [or adjacent pixel groups] for which DWI-to-DWI <kioV> is truly identical are black: ventricle and subarachnoid spaces. Individual pixels [or small groups] with color could represent random, intrinsic MADI noise,2 experimental imperfections [e.g., incomplete fat suppression], and/or minor miss-registration. This may be the case for Fig. 3 red single voxels or small clusters, and for Δ<kioV> values between ‑ 5.5 and 5.5 pL/s [green to yellow]. We do note there are some green regions of significant extent. Red hues signify <kioV>earlier > <kioV>later, blue <kioV>earlier < <kioV>later. Red pixels on tissue boundaries may reflect partial volume averaging changes.However, there are rather extensive parenchymal regions with correlated positive [red] or, particularly, negative [blue] <kioV> changes. As anticipated, the subject related afterward that he fell asleep early in the session. His heart rate [plethysmometry] did exhibit a 20% decrease by the fifth DWI acquisition. We talked with him before the sixth DWI acquisition – so he was awake for that scan. The red inner ventricle borders in Fig. 3A likely reflect the ventricle volume change evident in Fig. 2B. [kio approaches + infinity for acellular water.1,2]. Such changes during sleep have been reported.6 18FDG‑PET studies do show MRglu changes during sleep.7,9 Also, there are good reasons to expect different regions of decreased and of increased brain activity during sleep.9,10
The changes we see beg for rigorous pursuit. Different protocols to distinguish random MADI noise and miss‑registrations from the more meaningful changes are required. A deliberate visual stimulation study is a top priority. Also, it is possible to electrophysiologically monitor and characterize the various sleep stages during MRI acquisition.11
Acknowledgements
No acknowledgement found.References
1. Springer CS, Baker EM, Li X, Moloney B, Wilson GJ, Pike MM, Barbara TM, Rooney WD, Maki JH. Metabolic Activity Diffusion Imaging [MADI]: I. Metabolic, cytometric modeling and simulations. NMR Biomed. 2022; e4781.
2. Springer CS, Baker EM, Li X, Moloney B, Wilson GJ, Anderson VC, Sammi MK, Pike MM, M. G. Garzotto MG, R. P. Kopp RP, Coakley FV, Rooney WD, Maki JH. Metabolic activity diffusion imaging [MADI]: II. Non-invasive, high-resolution human brain imaging of sodium pump flux and cell metrics. NMR Biomed. 2022; e4782.
3. Neil JJ, Ackerman JJH. Metabolic activity diffusion imaging (MADI): A new paradigm. NMR Biomed. 2022; in press.
4. Zhang Y, Poirier-Quinot M, Springer CS, Balschi JA. Active Trans-Plasma Membrane Water Cycling in Yeast is Revealed by NMR. Biophys. J. 2011; 101: 2833-2842. [DOI:10.1016/j.bpj.2011.10.035]
5. Kim JH, Sizov I, Dobretsov M, von Gersdorff H. Presynaptic Ca2+ Buffers Control the Strength of a Fast Post-tetanic Hyperpolarization Mediated by the a3 Na+/K+-ATPase. Nature Neurosci. 2007; 10: 196-205.
6. Reeves BC, Karimy JK, Kundishora AJ, Mestre H, Cerci HM, Matouk C, Alper SL, Lundgaard I, Nedergaard M, Kahle KT. Glymphatic System Impairment in Alzheimer’s Disease and Idiopathic Normal Pressure Hydrocephalus. Trends Mol. Med. 2020; 26: 285-295.
7. Kay DB, Karim HT, Soehner AM, Hassler BP, Wickens KA, James JA, Alzenstein HJ, Price JC, Rosario BL, Kupfer DJ, Germain A, Hall MH, Franzen PL, Nofzinger EA, Buysse DJ. Sleep-Wake Differences in Relative Regional Cerebral Metabolic Rate for Glucose Among Patients with Insomnia Compared with Good Sleepers. SLEEP 2016; 39: 1779-1794.
8. Nofzinger EA, Buysse DJ, Miewald JM, Meltzer CC, Price JC, Sembrat RC, Ombao H, Reynolds CF, Monk TH, Hall M, Kupfer DJ, Moore RY. Human Regional Cerebral Glucose Metabolism During Non-Rapid Eye Movement Sleep in Relation to Waking. Brain 2002; 125: 1105-1115.
9. Dworak M, McCarley RW, Kim T, Kalinchuk AV, Basheer R. Sleep and Brain Energy Levels: ATP Changes During Sleep. J. Neurosci. 2010; 30: 9007-9016.
10. Saper CB, Chou TC, Scammell TE. The Sleep Switch: Hypothalamic Control of Sleep and Wakefulness. TRENDS Neurosci. 2001; 24: 726-731.
11. Czisch M, Wehrle R, Kauffmann C, Wetter TC, Holsboer F, Pollmacher T, Auer DP. Functional MRI During Sleep: BOLD Signal Decreases and Their Electrophysiological Correlates. Eur. J. Neurosci. 2004; 20: 566-574.
Figures
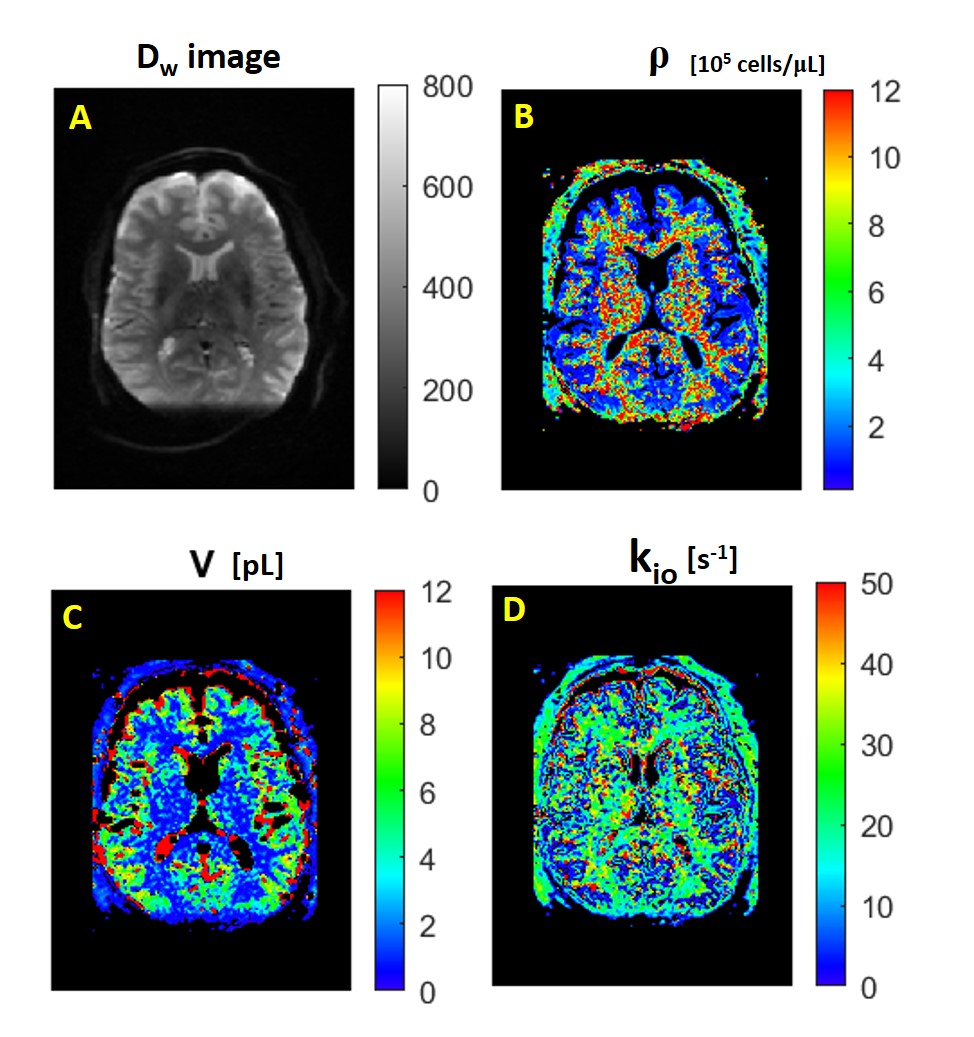
Figure 1. Axial images from the third DWI acquisition. A) The Dw-image at b = 335 s/(mm)2. The MADI parametric maps: B) voxel cell density ρ [(105 cells)/μL], C) voxel-mean cell volume áVñ [pL], and D) voxel-mean homeostatic cellular water efflux rate constant ákioñ [s-1]. The patterns seen are as expected.
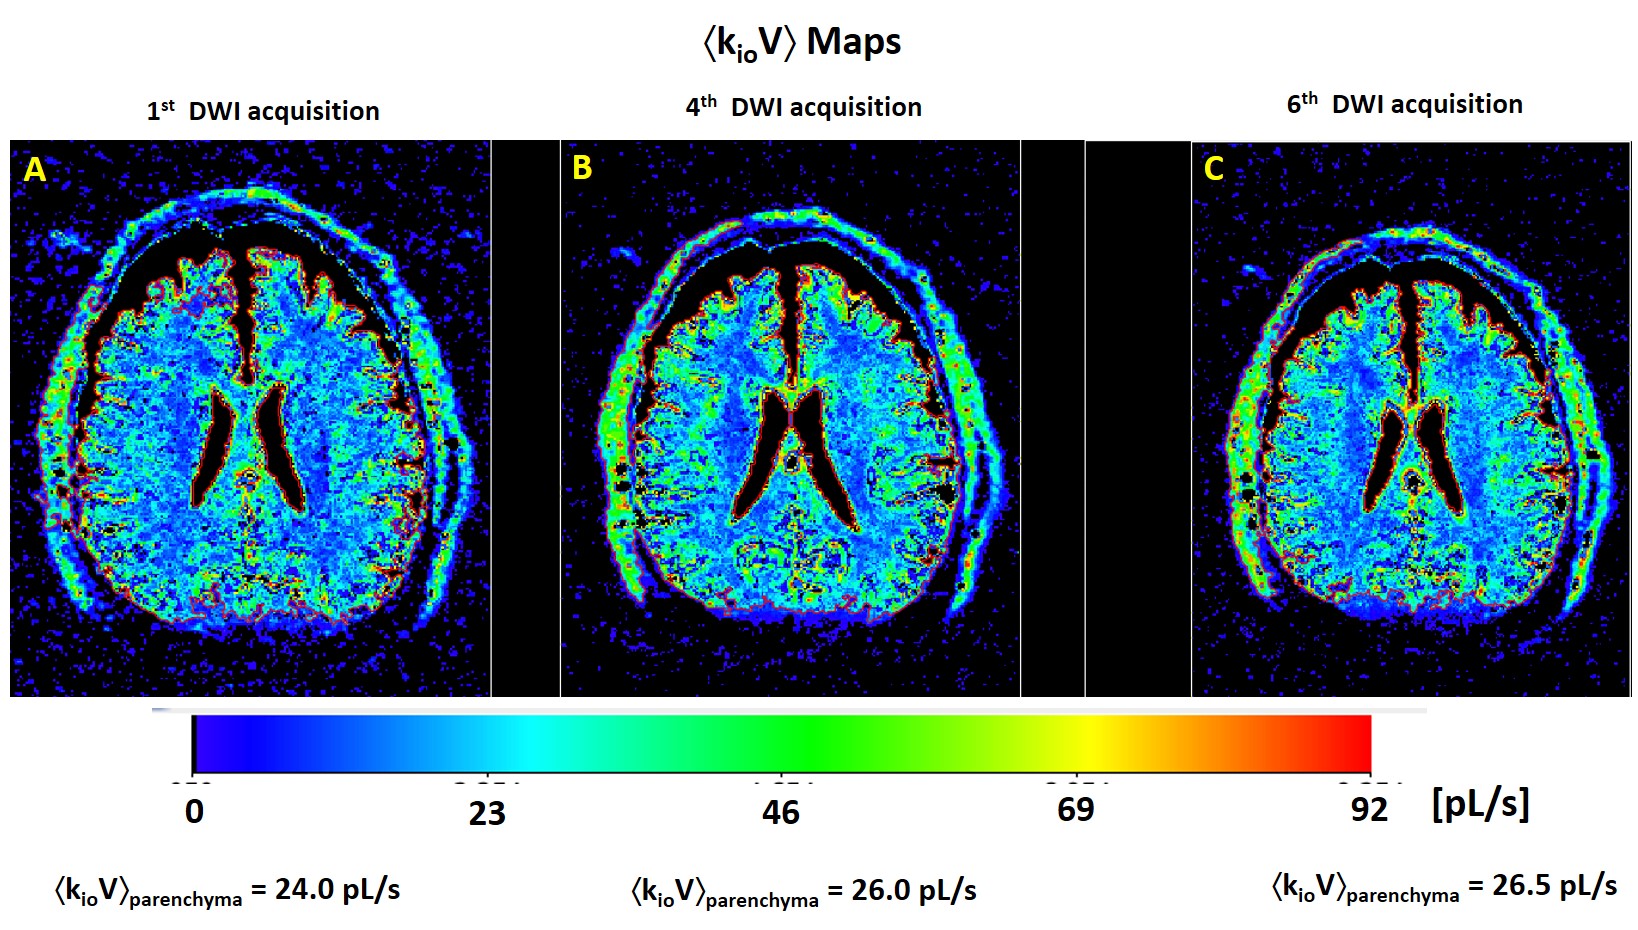
Figure 2. Axial voxel-mean ákioVñ maps for: A) the first, B) the fourth, and C) the sixth DWI acquisitions. The kioV product [pL/s] is proportional to on-going Na+,K+-ATPase [NKA] metabolic flux. As expected, <kioV>GM > <kioV>WM.
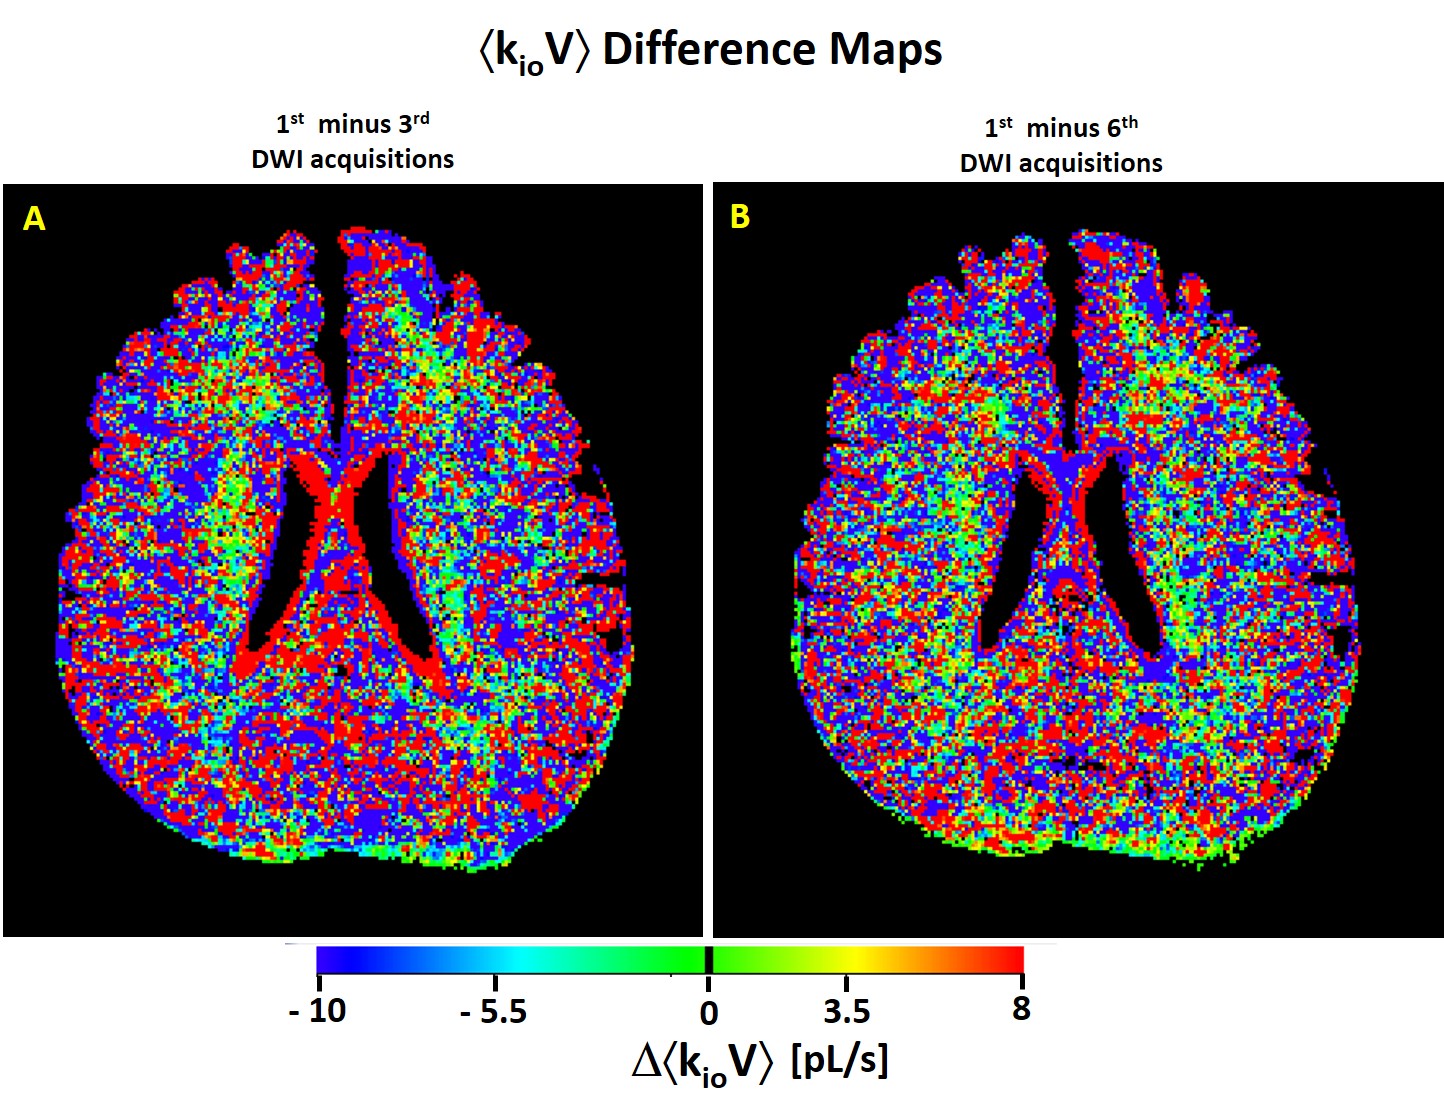
Figure 3. Axial ákioVñ difference maps, DákioVñ, for: A) the first minus the third DWI acquisitions, and B) the first minus the sixth DWI acquisitions. Some regions appear to experience considerable MRNKA changes.