5176
Soft-Tissue Sarcomas demonstrate Fractional Anisotropy in Diffusion Tensor Imaging and Fractional Anisotropy Values Change After Treatment1The Institute of Cancer Research, London, United Kingdom, 2The Royal Marsden NHS Foundation Trust, London, United Kingdom
Synopsis
Keywords: Diffusion/other diffusion imaging techniques, Diffusion Tensor Imaging, Cancer, Fractional Anisotropy, DWI, ADC
In previous studies average values of Apparent Diffusion Coefficient (ADC) have been shown to change significantly after radiotherapy in Soft-Tissue Sarcomas (STS). In this study we evaluate the Fractional Anisotropy (FA) of STS before and after treatment and demonstrate that (i) tumours can exhibit significant diffusion anisotropy, and (ii) changes in FA are inversely correlated with ADC change. Diffusion-Tensor Imaging (DTI) may therefore provide important microstructural information when interpreting change in STS after radiotherapy, and that diffusion anisotropy should be accounted for when optimising diffusion-weighted imaging (DWI) protocols for STS.
Introduction
Soft Tissue Sarcomas (STS) are rare and heterogeneous solid tumours that develop in the connective tissues. Current radiological measures of treatment response using size-based criteria (RECIST 1.1) do not correlate well with histopathological response, and there is an urgent need for new imaging biomarkers that reflect the underlying biology1,2,3. A previous study has shown that the average Apparent Diffusion Coefficient (ADC) of STS tumours changes significantly following radiotherapy (RT) and is thus a potential response biomarker4. ADC has demonstrated an inverse relationship with tumour cellularity5 and diffusion in tumours is often considered to be isotropic6. However, recent studies in breast and prostate cancers have demonstrated that tumours may exhibit significant fractional anisotropy (FA) and therefore the directionality of diffusion should be considered when developing a response biomarker7-9. In STS, measurement of the FA by diffusion-tensor imaging (DTI) has shown value in assessing invasion of surrounding tissue10. In an effort to understand the mechanism behind the apparent ADC increase we investigate the FA in limb STS tumours and compare the changes in ADC and FA, before and after RT.Materials and Methods
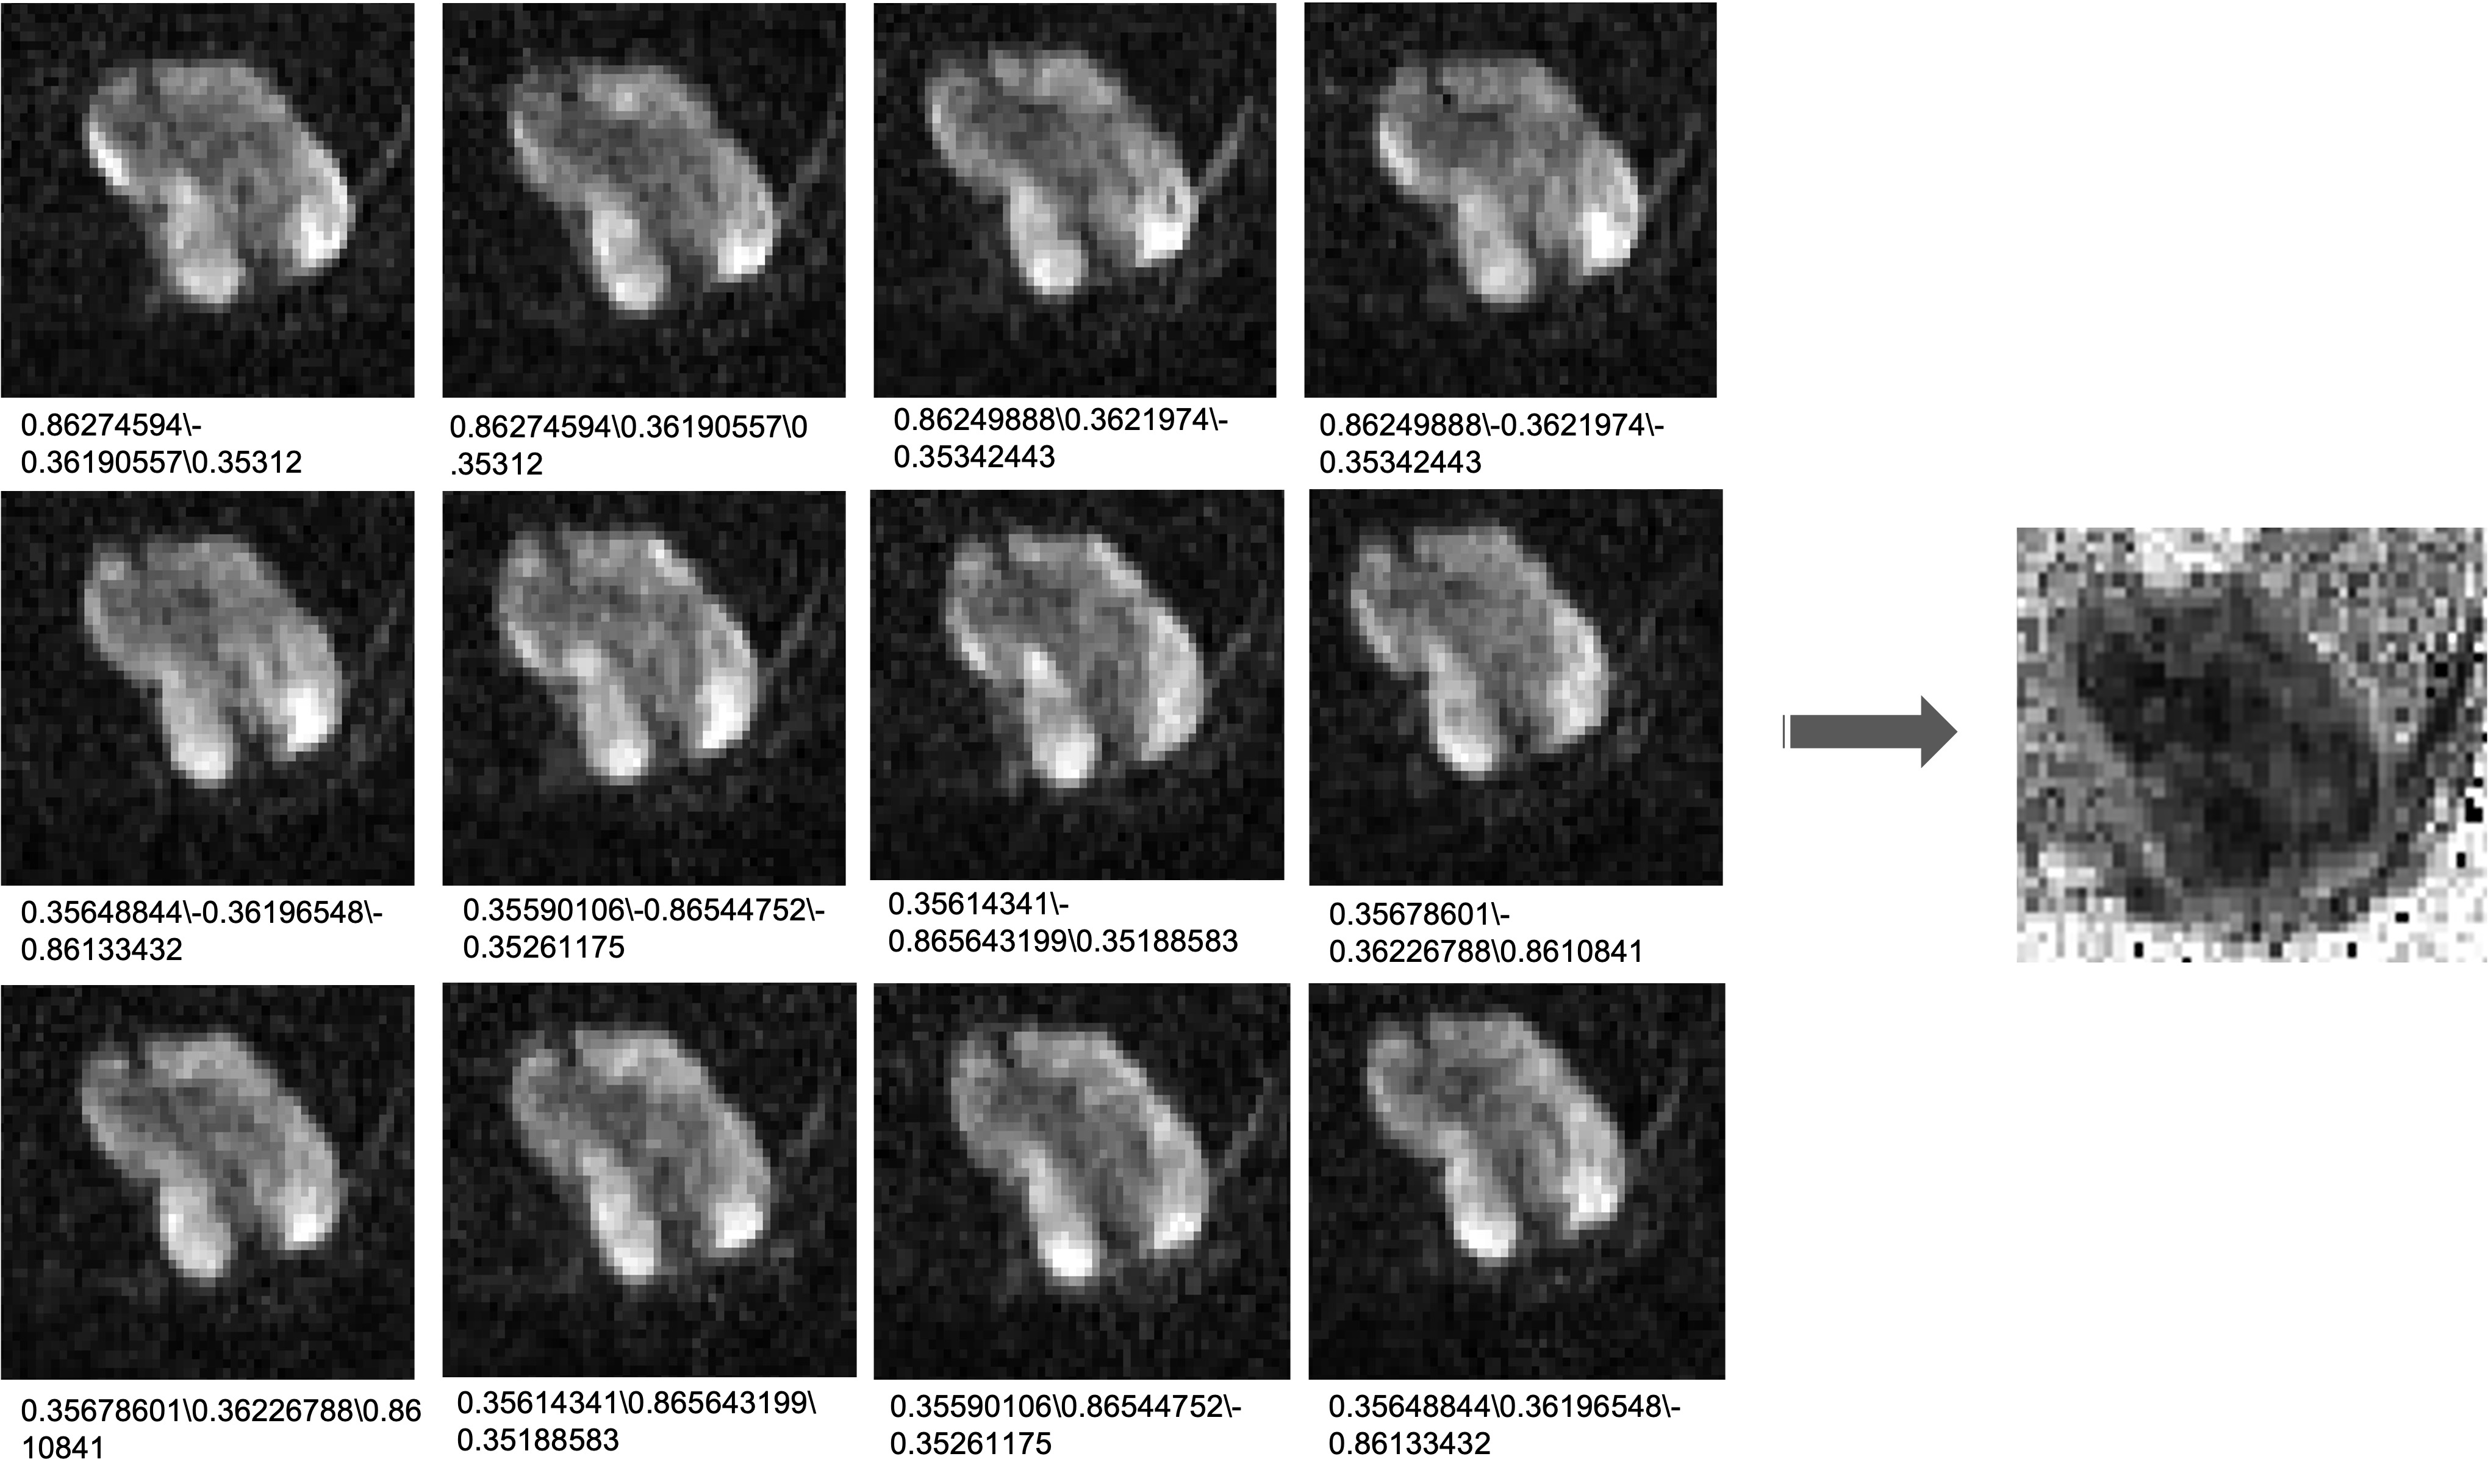
Sixteen patients with extremity STS receiving RT were recruited as part of an ongoing clinical imaging trial. All patients gave written informed consent to participate in this study, which was approved by a research ethics committee. Axial DTI was acquired using a 1.5T MR Scanner (MAGNETOM, Aera, Siemens Healthcare, Erlangen, Germany) with 3 b-values (b = 50,600,900 s/mm2) and 12 diffusion directions (vendor sequence, see Figure 1). Patients received a scan before (PreRT) and after treatment (PostRT). Positions of post-treatment images were matched to pre-treatment images as closely as possible by comparison with pre-treatment images and anatomical landmarks. DTI data was fit and FA values extracted using DIPY11, and a monoexponential model was used to extract ADC estimates.Regions-of-interest (ROIs) were drawn around the whole tumour on every slice in which the tumour appeared on b=50 s/mm2 images using HOROS12 and transferred to the FA and ADC maps. The volume-mean ADC and FA values were extracted at each time point (xADCpre/post and xFApre/post respectively), and the Pearson correlation between baseline values xADCpre and xFApre was calculated. The same was measured for changes in the mean values (δADCpost = xADCpost - xADCpre versus δADCpost = xADCpost - xADCpre), and lastly, in a single patient, we calculated the Pearson correlation between voxel values of both parameters (denoted yADCpre and yFApre).
Results
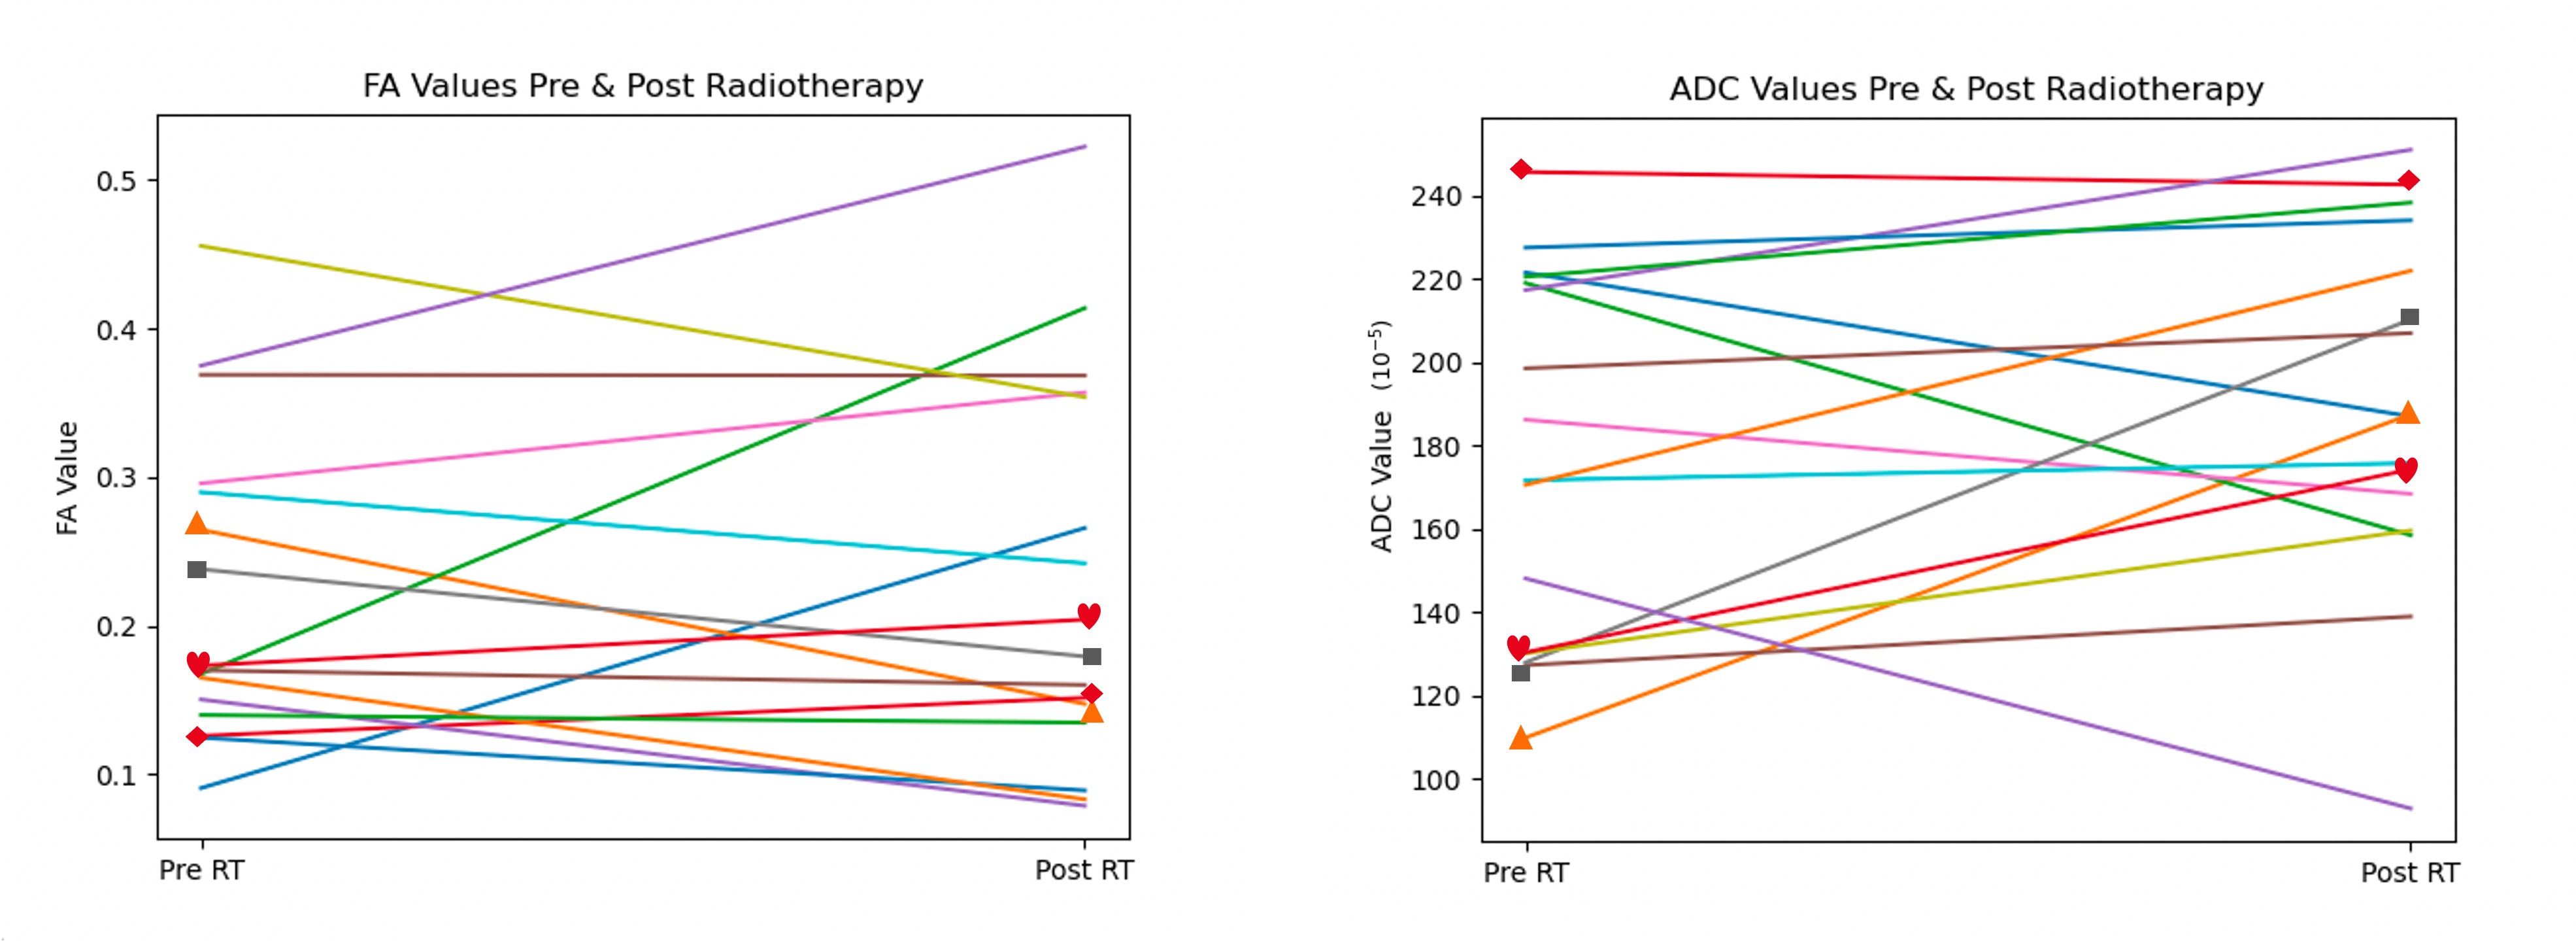
Demonstrated in Figure 2 are ladder plots indicating the change in ADC and FA for each patient after treatment. The tumour mean values of FA are greater than zero for many tumours before and after treatment.Correlation plots of (xADCpre, xFApre) and (δ FApost, δ ADCpost) are illustrated in Figure 3.
The correlation between (xADCpre, xFApre) was moderate and negative (r=-0.711, p=0.002), whilst the correlation between (δ FApost, δ ADCpost) was strong and negative (r=-0.856, p=2e-5). The correlation between voxel-wise estimates (yADCpre, yFApre) was weak and negative (r=-0.372, p=0.0 [3sf]) providing confidence that the correlation between volume-mean results was not due to covariance in FA and ADC fitting when estimating both parameters.
Figure 4 shows exemplar ADC and FA maps from the central imaging slice for a subset of 4 patients before and after treatment. For patients A and B we observe an increase in volume-mean ADC and a corresponding decrease in volume-mean FA. Furthermore, for patients A, B and D, we see a reduction in the heterogeneity within FA maps following treatment, which may suggest a change in overall tissue structure and more isotropic diffusion. In patient C both the FA and ADC are highly homogeneous at both time-points and little change is seen following treatment. In patient D both the volume-mean ADC and FA increase following treatment. However, the increase in FA may be driven by an area of particularly low FA before treatment that is no longer present afterwards.
Discussion
Our results demonstrate that STS tumours can exhibit diffusion anisotropy and thus multiple diffusion directions should be acquired to produce ADC estimates. We have also demonstrated that DTI can be used to provide a deeper interpretation of the changes in ADC seen after treatment: ADC and FA were strongly negatively correlated suggesting that as the tumour diffusivity increases, this is associated with a decrease in tumour anisotropy. This could be interpreted as radiation-induced disruption of stromal structure, though confirmatory histopathological analysis would be needed to verify this.We also demonstrate that tumour-wide statistics, such as whole-volume mean, may fail to capture more complex treatment changes and tumour environments due to the particularly heterogenous nature of STS tumours. Further analyses could consider a region-based approach that captures the heterogeneous changes following treatment.
Conclusion
STS demonstrate diffusion anisotropy and thus diffusion imaging should contain multiple diffusion directions to account for this. FA in STS changes following RT treatment and post-treatment changes were negatively correlated with the ADC changes, suggesting that as diffusion levels increase the diffusion becomes more isotropic, and conversely a reduction in ADC following treatment may be explained by an increase in diffusion anisotropy.Acknowledgements
We acknowledge The David and Ruth Lewis Family Trust and Sarcoma UK. This study represents independent research supported by the National Institute for Health and Care Research (NIHR) Biomedical Research Centre and the Clinical Research Facility in Imaging at The Royal Marsden NHS Foundation Trust and the Institute of Cancer Research, London. The views expressed are those of the author(s) and not necessarily those of the NIHR or the Department of Health and Social Care.References
1. Canter R, Martinez S, Tamurian R, et al. Radiographic and histologic response to neoadjuvant radiotherapy in patients with soft tissue sarcoma. Ann Surg Oncol. 2010;17:2578-2584.
2. Roberge D, Skamene T, Nahal A, et al. Radiological and pathological response following pre-operative radiotherapy for soft tissue sarcoma. Radiother Oncol. 2010;97:404-407.
3. Messiou C, Bonvalot S, Gronchi A, et al. Evaluation of response after pre-operative radiotherapy in soft tissue sarcomas; The European Organisation for Research and Treatment of Cancer - Soft Tissue and Bone Sarcoma Group (EORTC - STBSG) and Imaging Group recommendations for radiological examination and reporting with an emphasis on magnetic resonance imaging. Eur J Cancer. 2016;56:37-44.
4. Winfield JM, Miah AB, Strauss D, Thway K, Collins DJ, DeSouza NM, et al. Utility of Multi-Parametric Quantitative Magnetic Resonance Imaging for Characterization and Radiotherapy Response Assessment in Soft-Tissue Sarcomas and Correlation With Histopathology. Front Oncol (2019) 9:280. doi: 10.3389/fonc.2019.00280
5. Koh DM, Collins DJ. Diffusion-Weighted MRI in the Body: Applications and Challenges in Oncology. Am J Roentgenol (2007) 188:1622–35. doi: 10.2214/AJR.06.1403
6. Padhani AR, Liu G, Koh DM, Chenevert TL, Thoeny HC, Takahara T, Dzik-Jurasz A, Ross BD, Van Cauteren M, Collins D, Hammoud DA, Rustin GJ, Taouli B, Choyke PL. Diffusion-weighted magnetic resonance imaging as a cancer biomarker: consensus and recommendations. Neoplasia. 2009 Feb;11(2):102-25. doi: 10.1593/neo.81328.
7. Partridge SC, Ziadloo A, Murthy R, White SW, Peacock S, Eby PR, DeMartini WB, Lehman CD. Diffusion tensor MRI: preliminary anisotropy measures and mapping of breast tumors. J Magn Reson Imaging. 2010 Feb;31(2):339-47. doi: 10.1002/jmri.22045. PMID: 20099346.
8. Gürses B, Tasdelen N, Yencilek F, Kılıckesmez NO, Alp T, Fırat Z, Albayrak MS, Uluğ AM, Gürmen AN. Diagnostic utility of DTI in prostate cancer. Eur J Radiol. 2011 Aug;79(2):172-6. doi: 10.1016/j.ejrad.2010.01.009. Epub 2010 Feb 6. PMID: 20138721.
9. Teruel JR, Cho GY, Moccaldi Rt M, Goa PE, Bathen TF, Feiweier T, Kim SG, Moy L, Sigmund EE. Stimulated echo diffusion tensor imaging (STEAM-DTI) with varying diffusion times as a probe of breast tissue. J Magn Reson Imaging. 2017 Jan;45(1):84-93. doi: 10.1002/jmri.25376. Epub 2016 Jul 21. PMID: 27441890.
10. Wu G, Liu L, Mei Z, Li X. Diffusion-weighted MR is useful to assess peripheral nerve invasion of soft tissue tumor. Medicine (Baltimore). 2022 Jul 1;101(26):e29779. doi: 10.1097/MD.0000000000029779.
11. Garyfallidis E, Brett M, Amirbekian B, Rokem A, van der Walt S, Descoteaux M, Nimmo-Smith I; Dipy Contributors. Dipy, a library for the analysis of diffusion MRI data. Front Neuroinform. 2014 Feb 21;8:8. doi: 10.3389/fninf.2014.00008. PMID: 24600385; PMCID: PMC3931231.
12. Horosproject.org
Figures
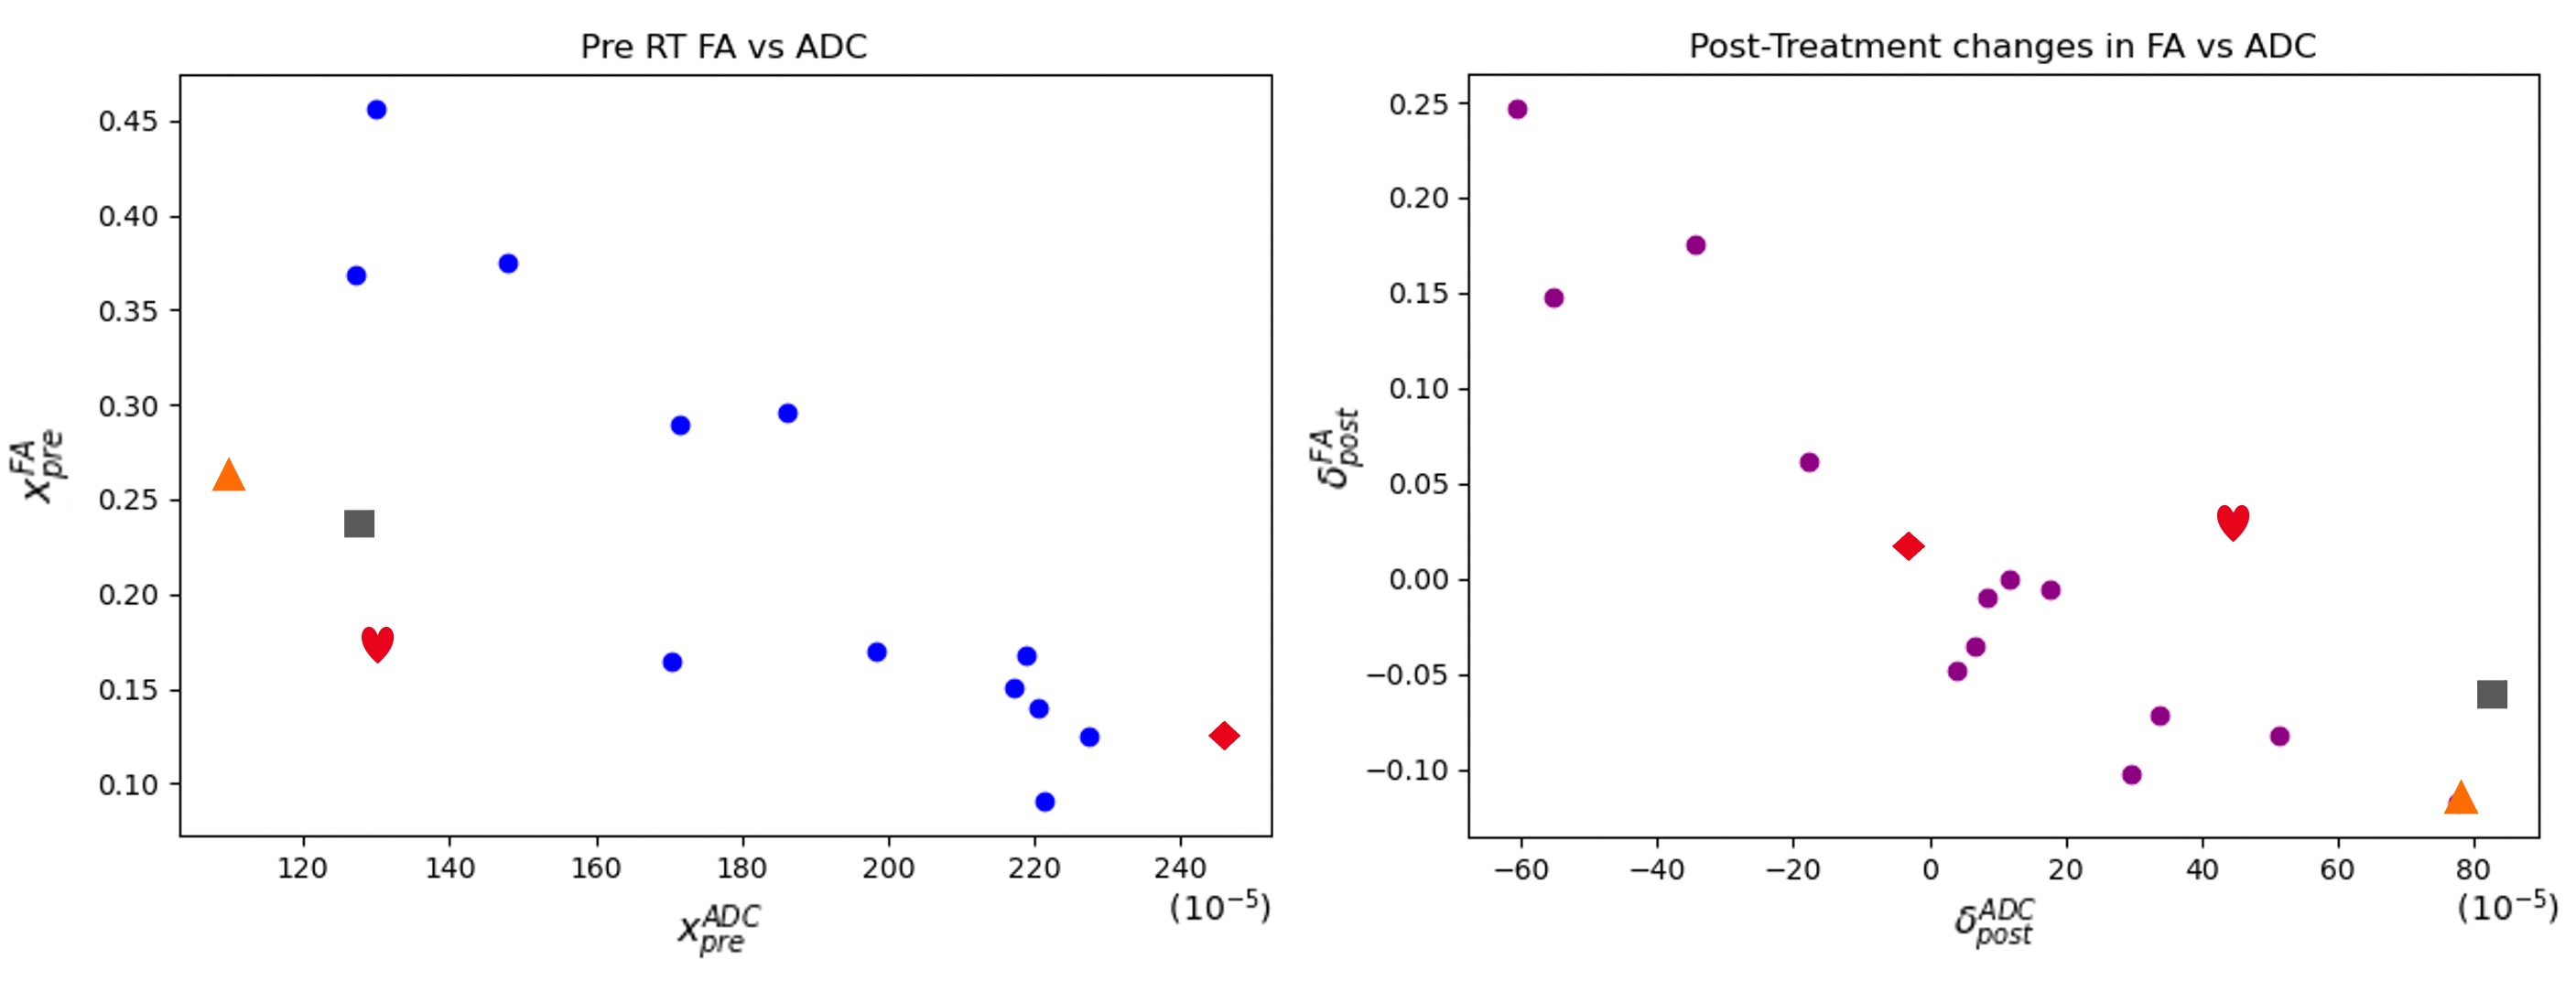
The correlation plots (xADCpre, xFApre) [left] and (δ FApost, δ ADCpost) [right]. Patients A – D are indicated by the square, triangle, diamond and heart shapes respectfully.
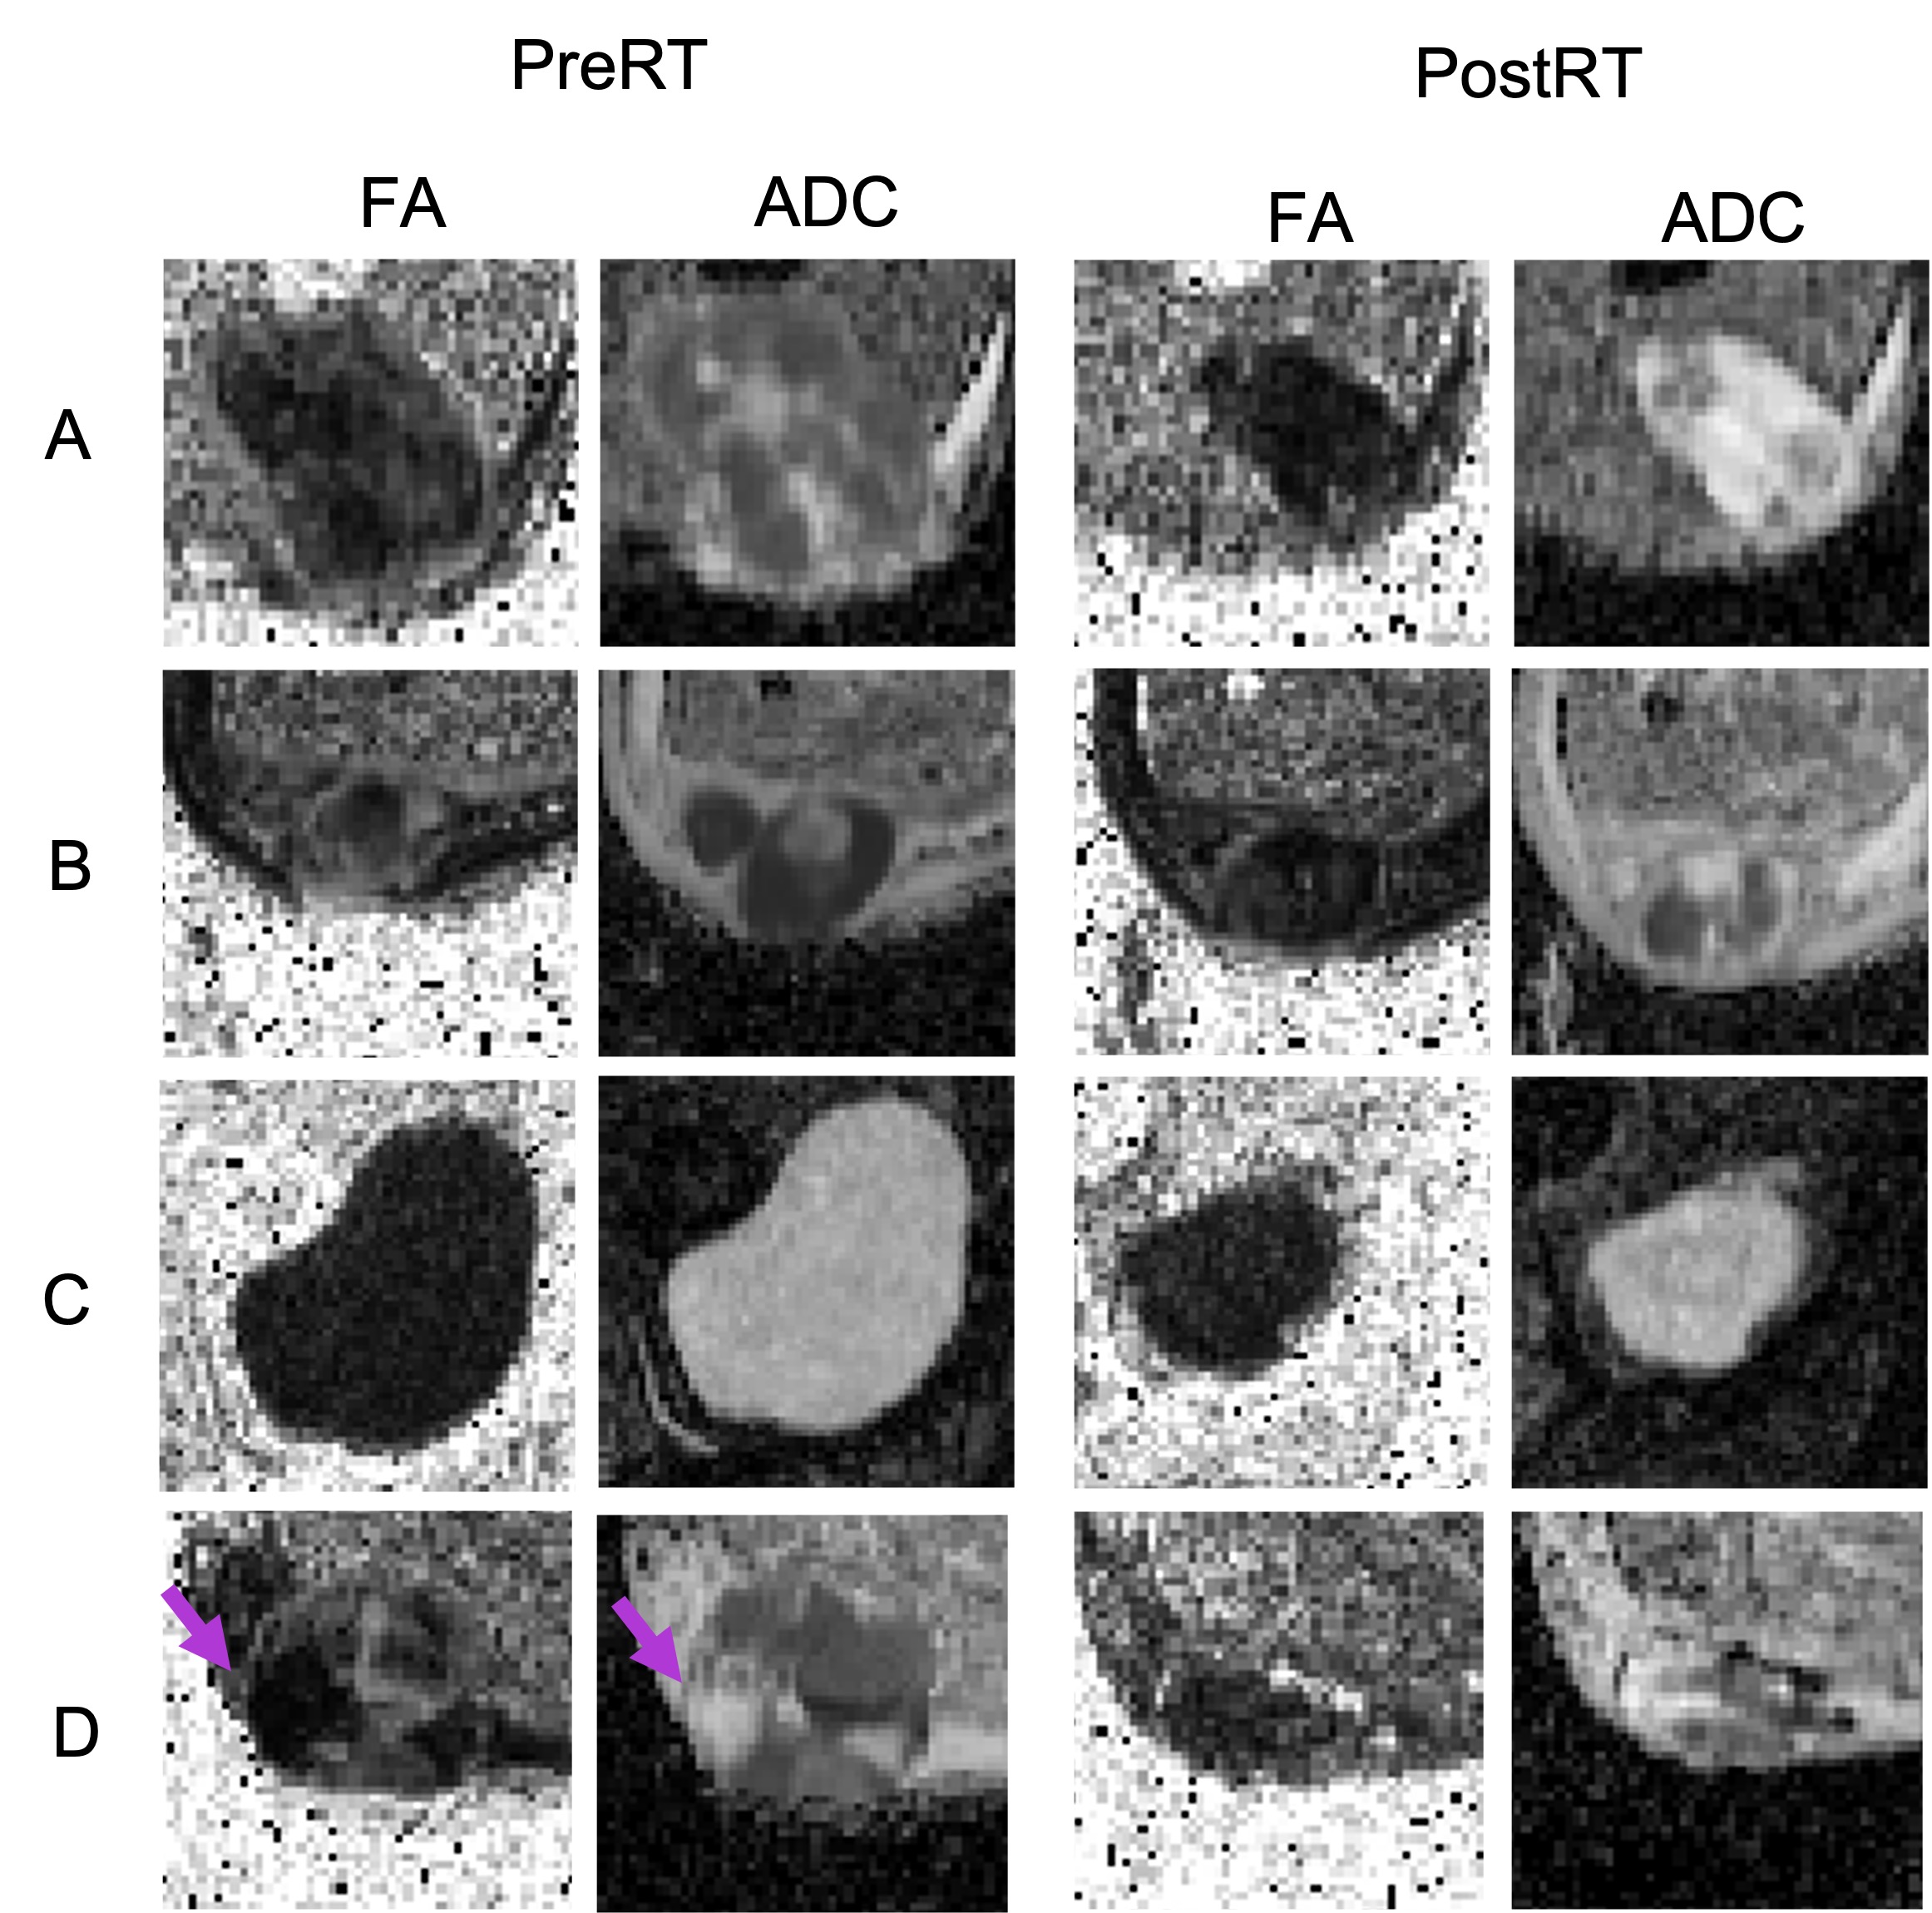
[LHS]: The FA (left) and ADC (right) maps from the central imaging slice (cropped to the tumour) for a subset of 4 patients (A-D) at PreRT.
[RHS]: The FA (left) and ADC (right) maps from the central imaging slice (cropped to the tumour) for a subset of 4 patients (A-D) at PostRT. The arrow in patient D at PreRT indicates an area of particularly low FA before treatment that is no longer present afterwards.