5174
Diffusion imaging on a 0.35 T MRI-guided linear accelerator providing accurate in vivo apparent diffusion coefficient maps
Joseph Weygand1, Tess Armstrong2, J.M. Bryant1, Jacqueline Andreozzi1, Ibrahim M. Oraiqat1, Casey L. Liveringhouse1, Kujtim Latifi1, Kosj Yamoah1, James R. Costello3, Eduardo G. Moros1, Issam M. El Naqa4, Arash O. Naghavi1, Stephen A. Rosenberg1, and Gage Redler1
1Department of Radiation Oncology, Moffitt Cancer Center, Tampa, FL, United States, 2Department of Product Development, ViewRay, Oakwood Village, OH, United States, 3Department of Radiology, Moffitt Cancer Center, Tampa, FL, United States, 4Department of Machine Learning, Moffitt Cancer Center, Tampa, FL, United States
1Department of Radiation Oncology, Moffitt Cancer Center, Tampa, FL, United States, 2Department of Product Development, ViewRay, Oakwood Village, OH, United States, 3Department of Radiology, Moffitt Cancer Center, Tampa, FL, United States, 4Department of Machine Learning, Moffitt Cancer Center, Tampa, FL, United States
Synopsis
Keywords: Diffusion/other diffusion imaging techniques, Radiotherapy
Diffusion weighted imaging (DWI) allows for the evaluation of tumor cellularity. Its application on a 0.35 T MRI-guided linear accelerator (MRL) would facilitate integration of this information into radiotherapy planning and potentially allow for online biologically-guided plan adaption. This study demonstrates the capability of a DWI protocol both in phantom and in vivo. In particular, it is demonstrated that quantitively accurate, repeatable, and geometrically precise ADC maps can be produced in phantom on the 0.35 T MRL. Additionally, this technique was applied in vivo on one sarcoma patient receiving same-day diagnostic diffusion scans before, during, and after radiotherapy.Introduction
Diffusion weighted imaging (DWI) allows for the noninvasive interrogation of tissue cellularity1, which is a surrogate for cellular proliferation. Its integration into adaptive MRI-guided radiotherapy on a 0.35 T (ViewRay MRIdian) MRI-guided linear accelerator2 (MRL) through the production of apparent diffusion coefficient (ADC) maps would allow for the identification of cellular subpopulations with restricted diffusion for which dose escalation strategies and/or biologically-guided plan adaptation may be clinically advantageous. In this study, the accuracy, repeatability, and geometric precision of ADC maps produced using an echo planar imaging (EPI)-based DWI protocol on the MRL system is illustrated, and its in vivo potential for longitudinal patient imaging is demonstrated in an 82 year-old female sarcoma patient receiving same-day diagnostic diffusion scans before, during, and after radiotherapy.Methods
Images were acquired of a National Institute of Standards and Technology (NIST)-traceable diffusion phantom (CaliberMRI) containing differing amounts of polyvinylpyrrolidone (PVP) which controls the ADC in each vial. Images were acquired using a multi-slice EPI sequence (matrix size=100x100x21, FOV=350x350x190 mm3, TR=3200 ms, TE=120 ms, BW=1352 Hz, α=90°, 6 averages). The gantry of the linear accelerator was kept at 0° for all scans to minimize eddy current-induced geometric distortion. The b-values of 0, 200, 300, 500, and 800 s/mm2 were used with diffusion weighting applied along each of the three principal directions. ADC maps were produced by fitting an exponential in each voxel along each diffusion direction in MATLAB Version R2021a (The Mathworks, Inc) and then averaging over all three directions. ADC accuracy was assessed by measuring ADC values in each vial at two timepoints and comparing these values to their known NIST-traceable ADC. Repeatability of the measurement was assessed by measuring the mean repeatability coefficient, averaged over each vial in the phantom. System-dependent geometric distortion was interrogated by measuring the spatial distance between 93 pairs of phantom features in both a central slice and a slice 5.4 cm off-center and comparing these distances to those measured in a spatially precise CT scan of the same phantom. This analysis was performed by three independent observers on both ADC maps taken on the 0.35 T MRL system and on a 3 T MAGNETOM Vida (Siemens Healthineers). DWI on the 3 T system was performed using the institution’s clinical protocol which utilized b-values of 100 and 1000 s/mm2. Additionally, for a sarcoma patient receiving radiotherapy on the MRL, same-day in vivo ADC maps were acquired on both systems at three timepoints: prior to treatment (day 0), mid-treatment (day 21), and 3 weeks post-treatment (day 69).Results
In the phantom experiments, ADC quantification was accurate with discrepancies beyond measurement uncertainty only seen in vials approaching free diffusion (see Figure 1). ADC quantification was constant over repeat measurements with small discrepancies only seen at high ADC. A mean repeatability coefficient of 0.068 mm2/s was measured on the MRL compared to 0.057 mm2/s on the diagnostic scanner. In the central slice, average geometric distortions of 0.35 (±0.02) mm and 0.85 (±0.02) mm were noted for the MRL and the diagnostic system, respectively. Similarly, in the slice 5.4 cm off-center, average geometric distortions of 0.66 (±0.04) mm and 2.14 (±0.07) mm were noted on the two systems, respectively (see Figure 2). In the sarcoma patient images, comparable image quality was observed on both systems at both timepoints. Additionally, the general region of enhanced ADC signal on the images acquired with the 0.35 T MRL demonstrates marked conformity with the tumor contours delineated on the anatomical True FISP (TRUFI) images and similarity with tumor ADC features visualized in the diagnostic ADC map (see Figure 3).Discussion
Although DWI using an integrated 0.35 T MRL has been studied in the past3, until now, the accuracy and repeatability has been lacking. The work presented here demonstrates vastly superior accuracy and repeatability in quantifying ADC. Performing DWI on the 0.35 T MRL has the obvious inherent limitation of lower sensitivity than DWI at diagnostic field strengths. This limited the acquisition to lower b-values than typical diagnostic scans and slightly degraded the repeatability relative to 3 T. However, these minor limitations are greatly outweighed by the following advantages. Particularly, in radiation oncology, where geometric precision is extremely important, ADC maps produced on the 0.35 T MRL demonstrated greater than two-fold improvement in spatial precision compared to ADC maps acquired on a 3 T scanner. Additionally, the ability to acquire accurate ADC maps on the same system that the patient is being treated with is logistically beneficial, enables a more geometrically reproducible setup, and will potentially allow for on-line biologically-guided adaptation and dose escalation for personalized radiotherapy.Conclusion
The acquisition of accurate, repeatable, and geometrically precise (sub-millimeter distortion; >2x improvement over 3T) ADC maps is possible at 0.35 T with an EPI approach. This enables tracking of longitudinal changes in tumor cellular density during MRL treatment and will facilitate personalization/adaptation not only to patient anatomy but dynamic tumor physiology as well.Acknowledgements
*Dr. Rosenberg and Dr. Redler contributed equally as senior authors.References
1. White NS, McDonald C, Farid N, et al. Diffusion-weighted imaging in cancer: Physical foundations and applications of restriction spectrum imaging. Cancer Research. 2014; 74(17): 4638-4652.
2. Klüter S. Technical design and concept of a 0.35 T MR-linac. Clinical and Translational Radiation Oncology. 2019; 18: 98-101.
3. Lewis B, Guta A, Mackey S, et al. Evaluation of diffusion-weighted MRI and geometric distortion on a 0.35T MR-LINAC at multiple gantry angles. Journal of Applied Clinical Medical Physics. 2021; 22(2): 118‐125.
Figures
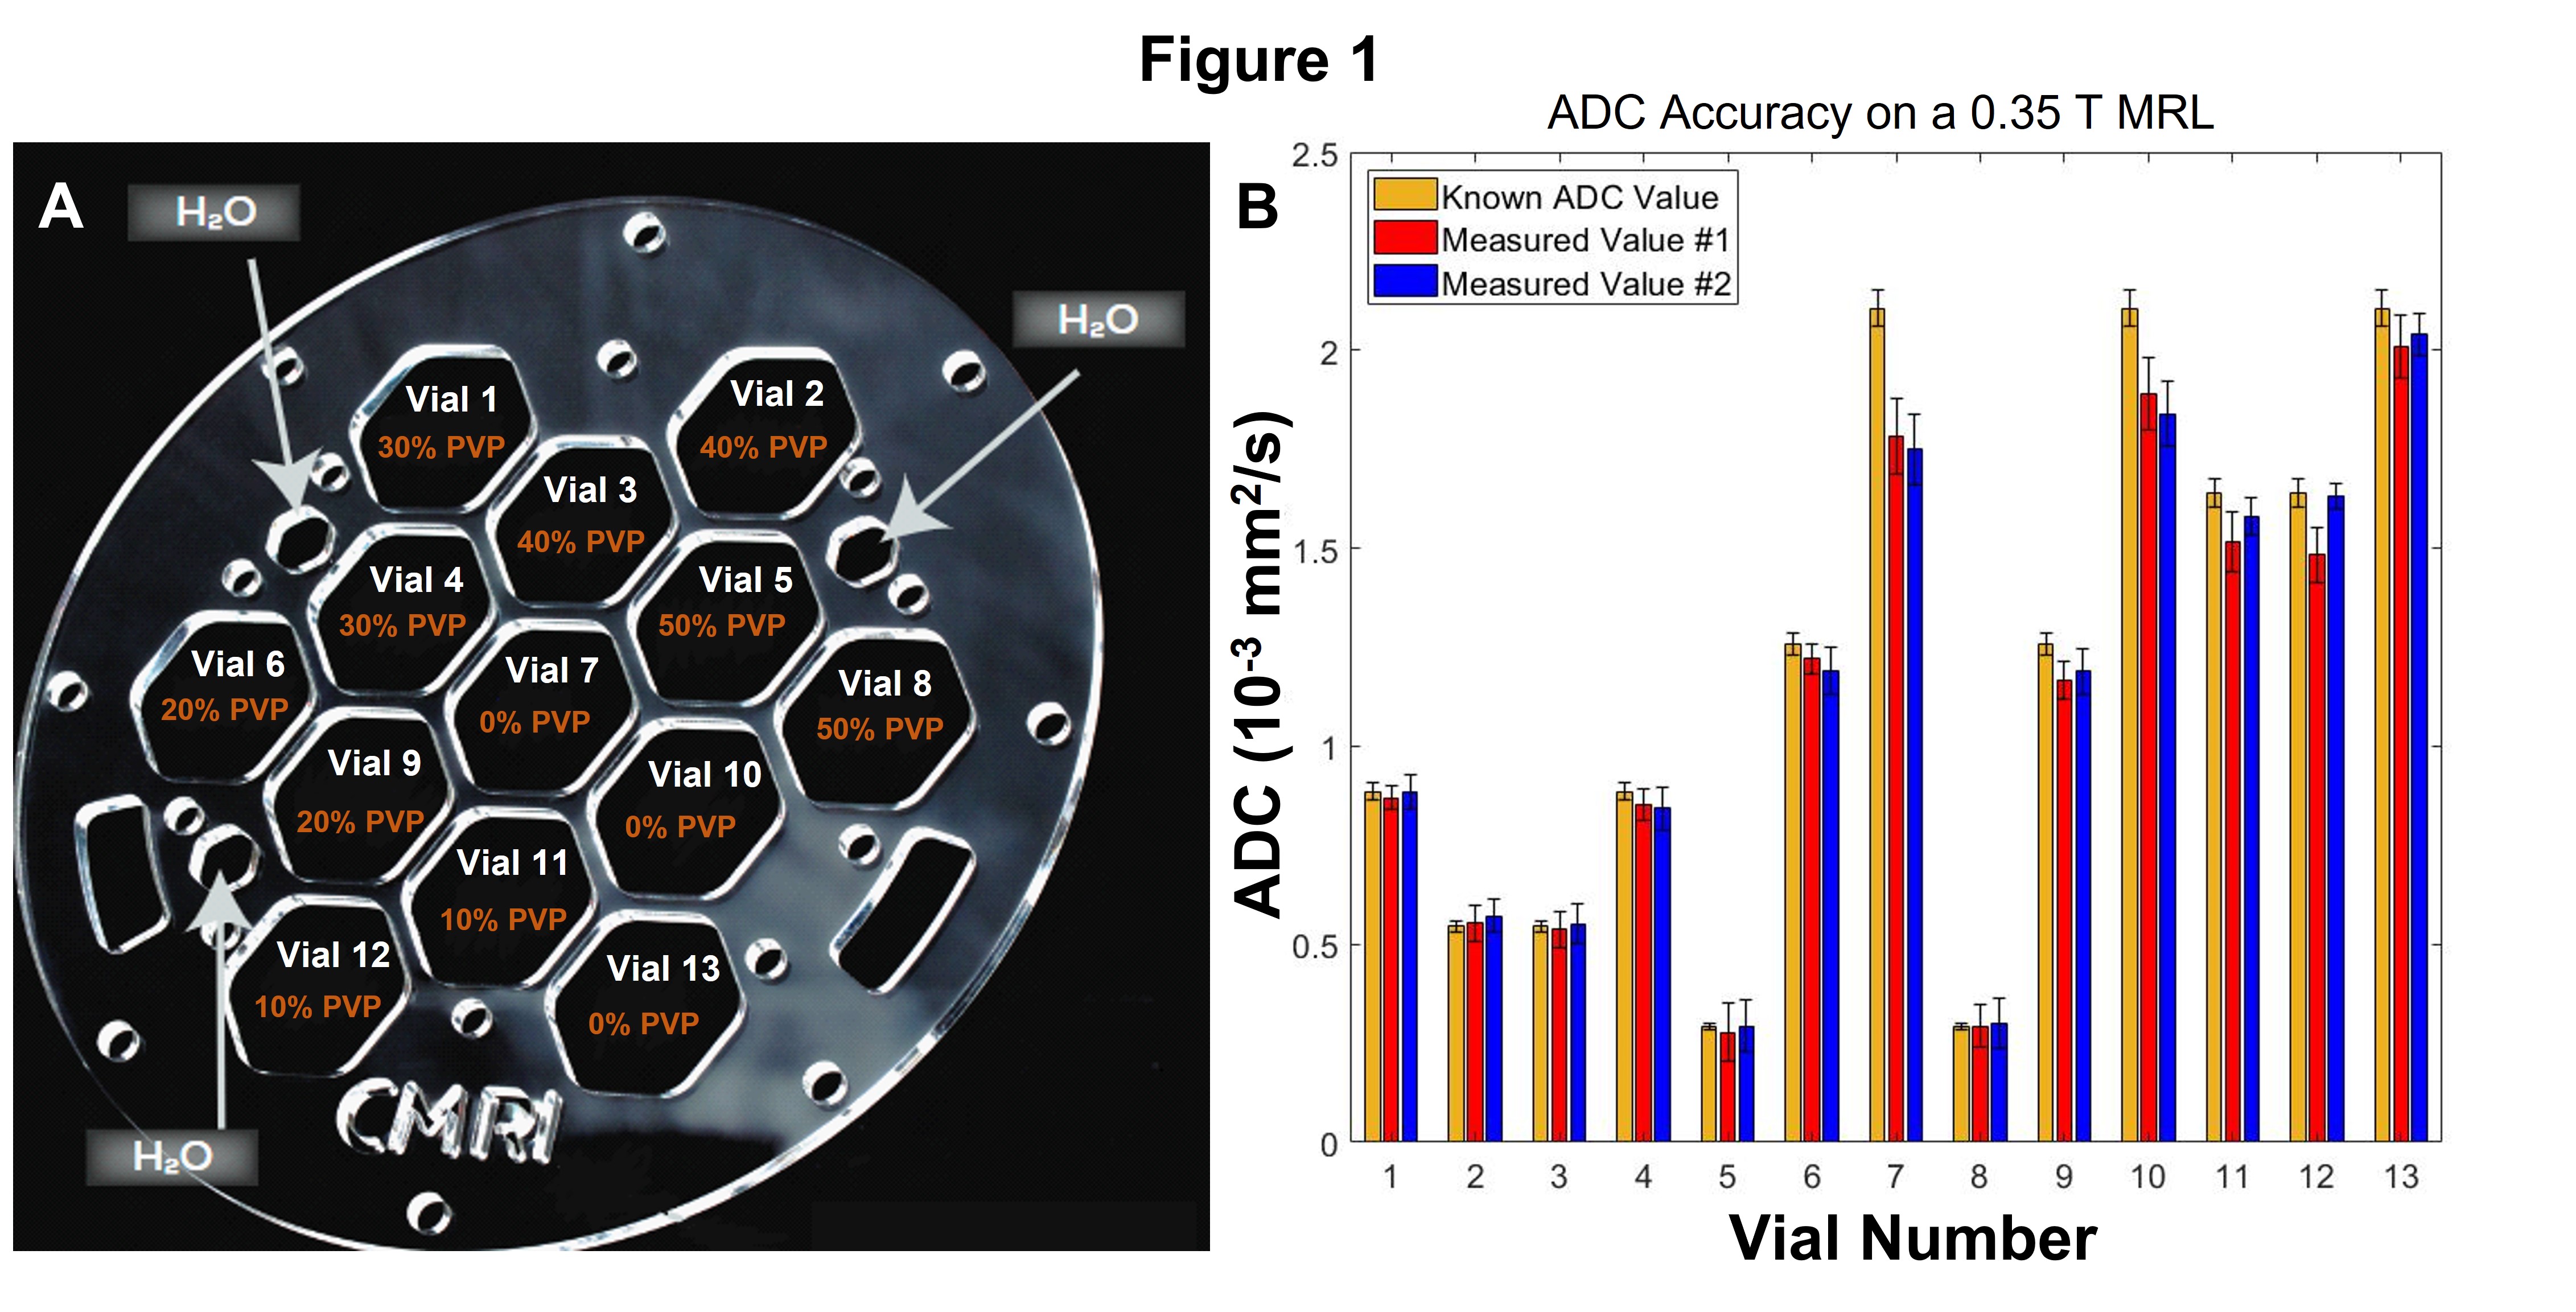
In Figure 1, the accuracy and repeatability of ADC quantification
performed on a 0.35 T MRL is depicted. 1.A shows a schematic for the diffusion
phantom used which contains thirteen vials of differing concentrations of PVP.
1.B demonstrates the measured values of ADC in each vial over two separate measurements
(red and blue) compared to the known ADC in the relevant vial. Here, ADC
quantification is accurate and repeatable with only minor discrepancies seen in
vials approaching free diffusion.
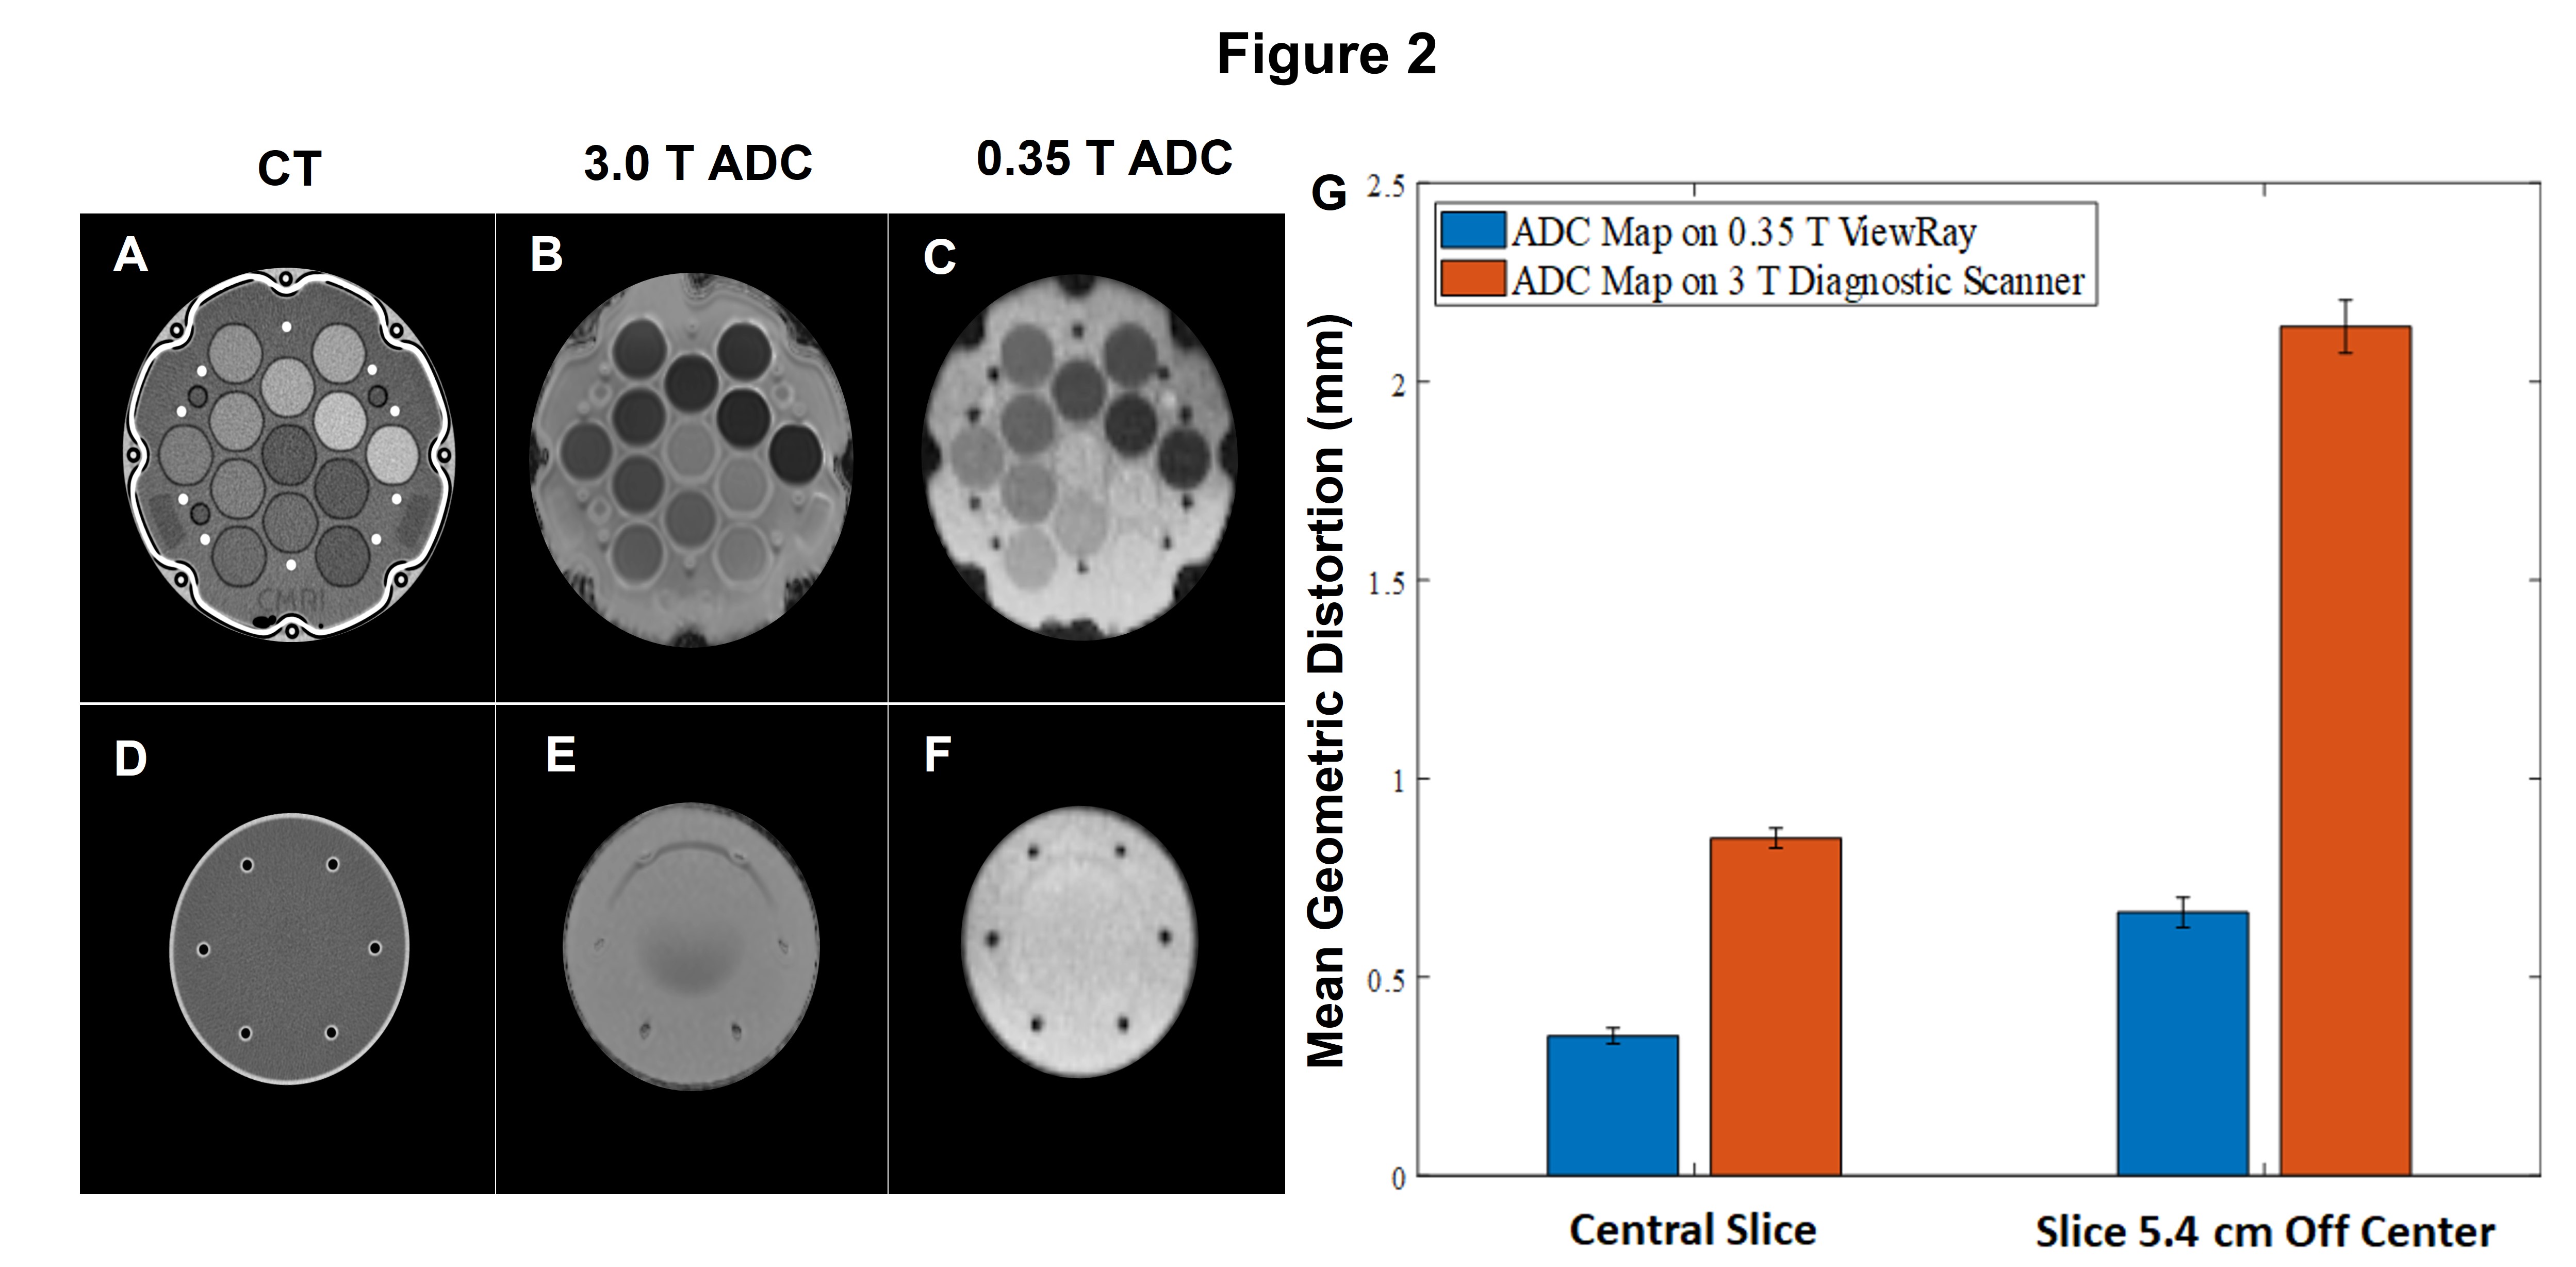
In Figure 2, the geometric accuracy of ADC maps
produced on a 0.35 T MRL and 3.0 T diagnostic scanner are compared. The
distance between 93 pairs of phantom structures were measured on each system
and compared to their distances measured on a CT. Mean geometric accuracy is
shown to be superior relative to the 3 T diagnostic scanner and submillimeter on
the 0.35 T MRL in both a central slice and a slice that is displaced by 5.4 cm
from the central slice.
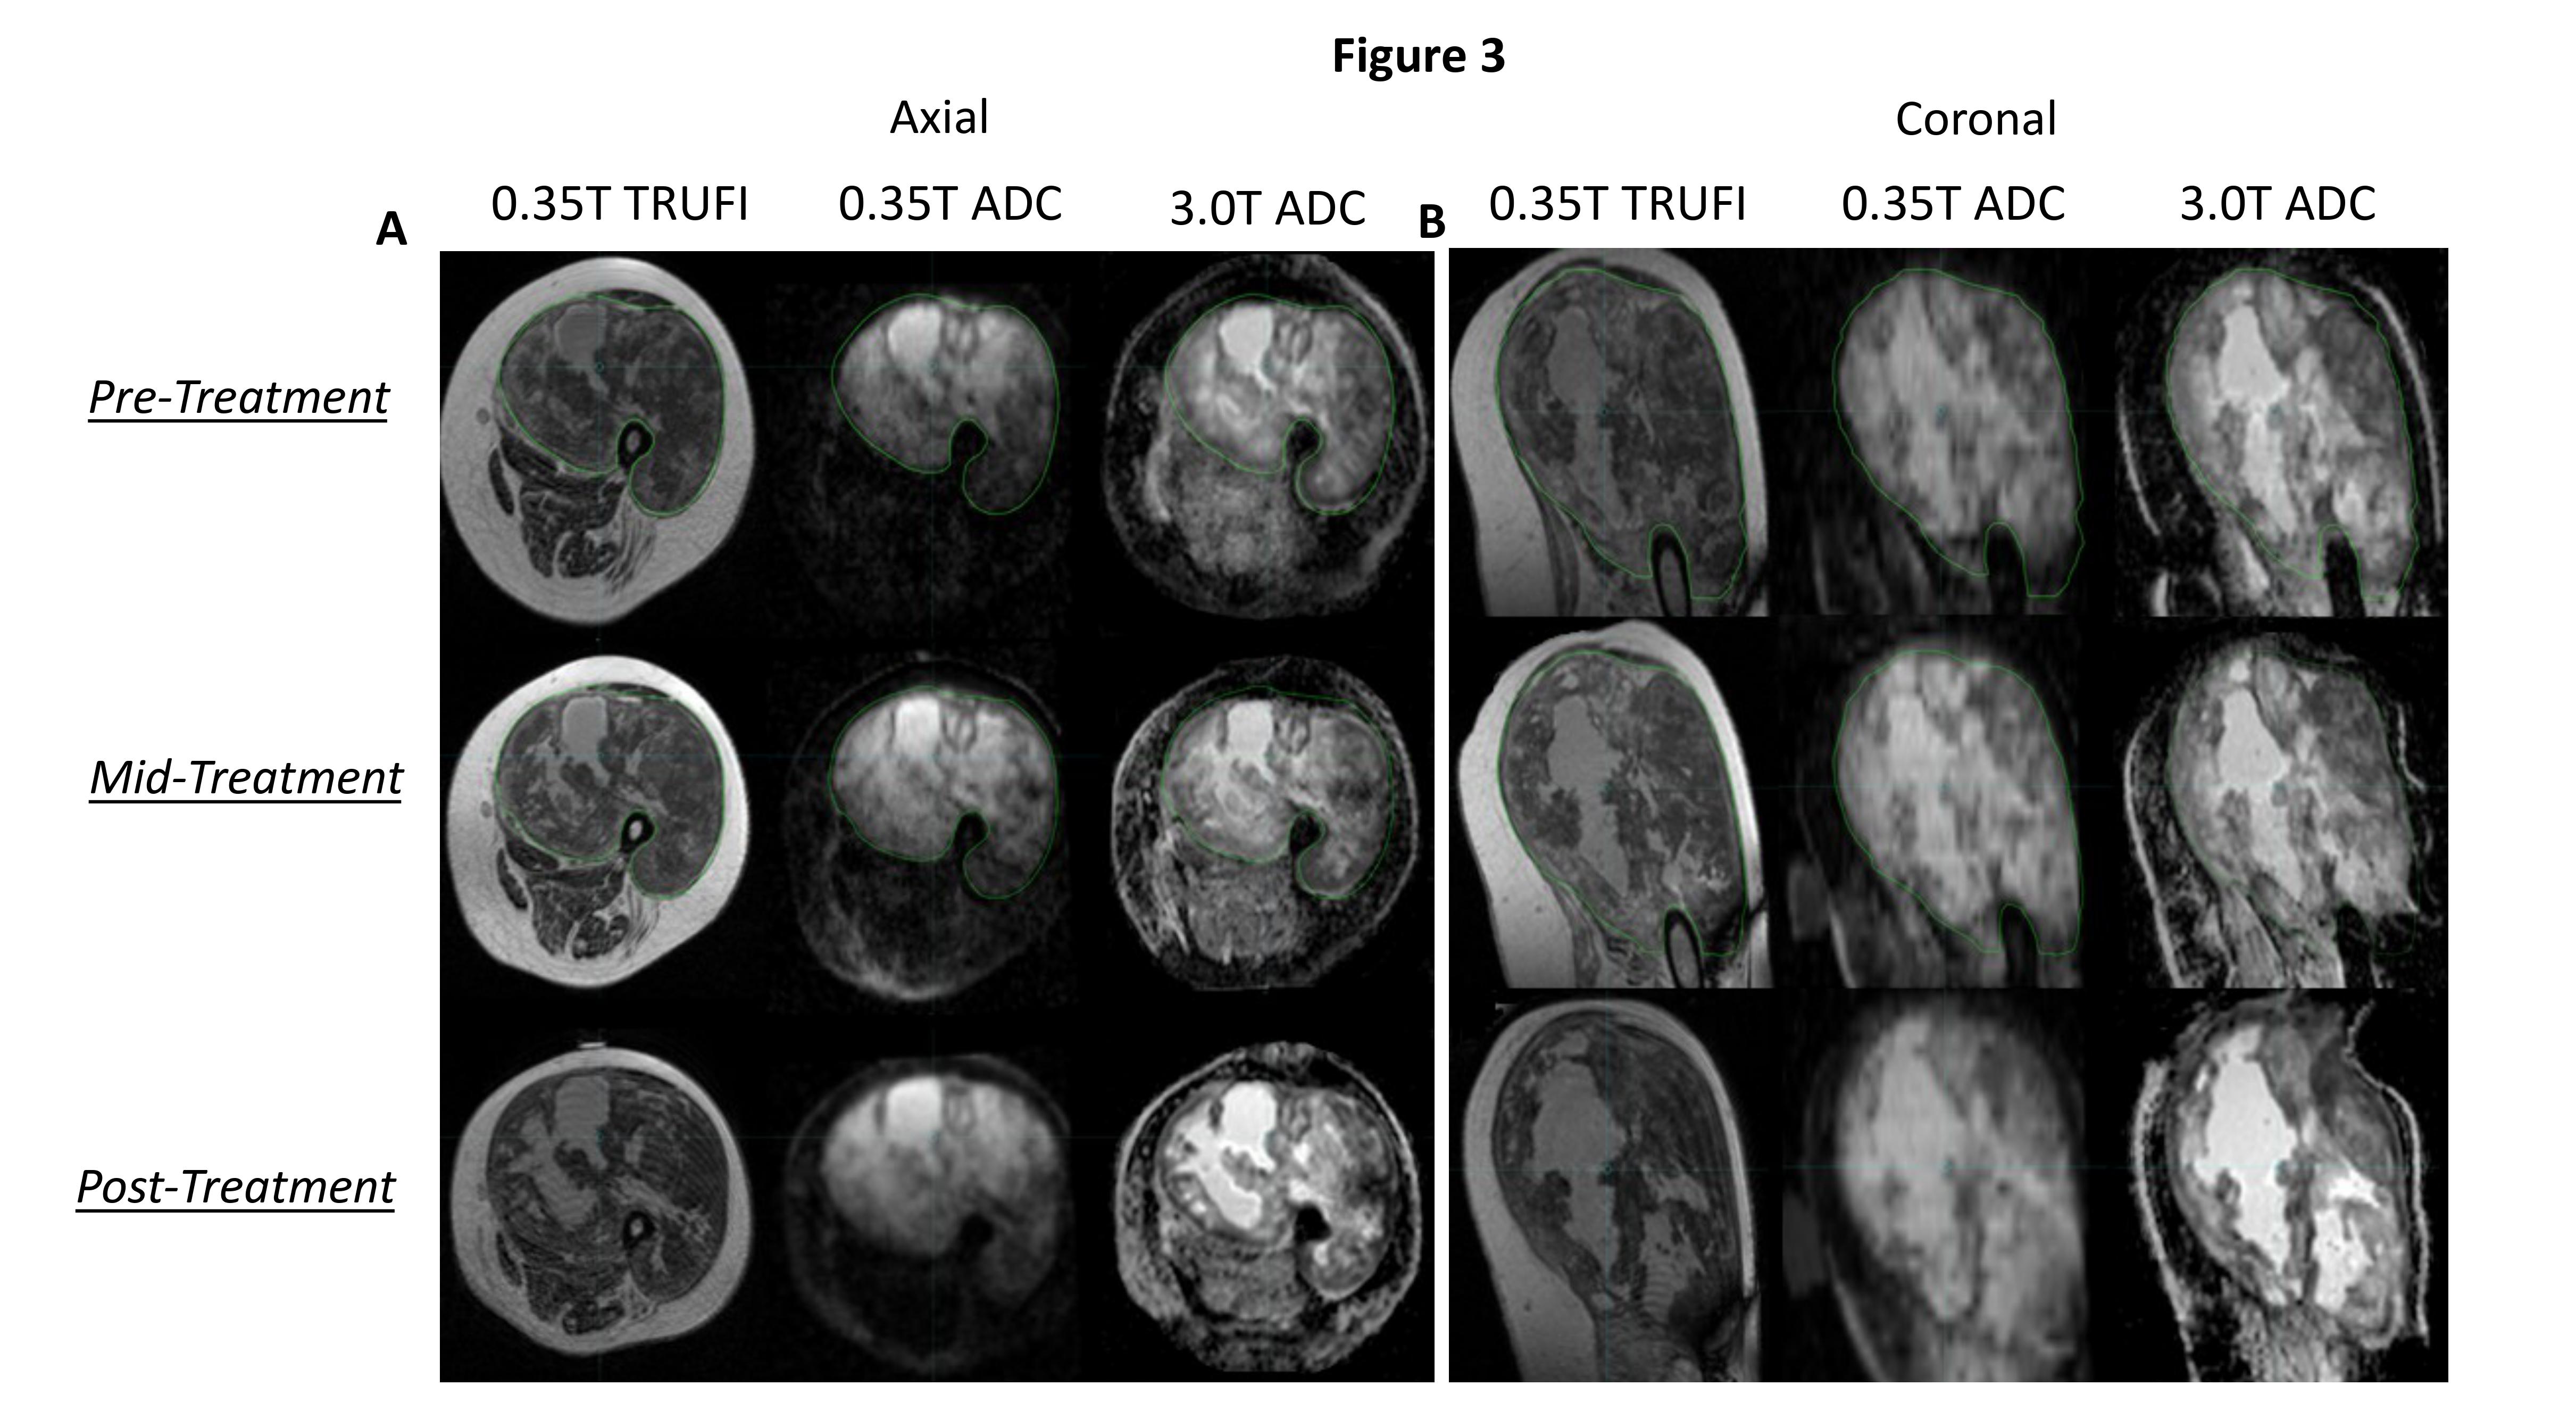
In Figure 3, the feasibility of in vivo diffusion
imaging on a 0.35 T MRL and its longitudinal potential are illustrated in a sarcoma patient who
received same-day diagnostic diffusion scans at three timepoints, shown in axial
(3.A) and sagittal (3.B) views. The region of enhanced signal in the ADC maps acquired at 0.35 T exhibits notable
conformity with the tumor contours delineated on an anatomical TRUFI image and
similarity with tumor ADC features seen in the ADC maps acquired at 3 T.
DOI: https://doi.org/10.58530/2023/5174