5172
Spiral readout improves in vivo MR axon radius estimation in human white matter1MR Physics, Deutsches Zentrum für Neurodegenerative Erkrankungen e.V., Bonn, Germany, 2Department of Neurophysics, Max Planck Institute for Human Cognitive and Brain Sciences, Leipzig, Germany, 3Felix Bloch Institute for Solid State Physics, Faculty of Physics and Earth Sciences, Leipzig University, Leipzig, Germany, 4Department of Physics & Astronomy, University of Bonn, Bonn, Germany
Synopsis
Keywords: Diffusion/other diffusion imaging techniques, Diffusion/other diffusion imaging techniques
We compared spiral and EPI diffusion imaging at ultra-high b-values for axon radius estimation in the white matter. For data acquisition, a custom multiband spiral sequence was combined with trajectory monitoring and higher order image reconstruction. The lower echo time of the spiral sequence led to increased relative SNR compared to EPI and improved estimation of axon radii. The resulting axon radius maps from spiral scans were more homogeneous especially in low-SNR regions. We also found, that denoising performed on complex data instead of magnitude data significantly improved axon radius estimation.Introduction
Sensitizing the MR signal to the axon radius requires data acquisition with very high b-values1,2. Therefore, high amplitude gradients are required to achieve reasonable echo times and sufficiently high SNR. In recent years, the noninvasive quantification of axon radii in the human white matter has come into reach, due to the development of high-performance gradient systems3.The SNR of diffusion acquisitions can be significantly increased using spiral readouts with short echo times instead of recti-linear EPI readouts4. In this work, we compare quantification of the MR axon radius with a spiral and an established EPI-based axon radius mapping approach using a protocol, that was shown to be reproducible2. We use trajectory monitoring to minimize artifacts in spiral images.
Methods
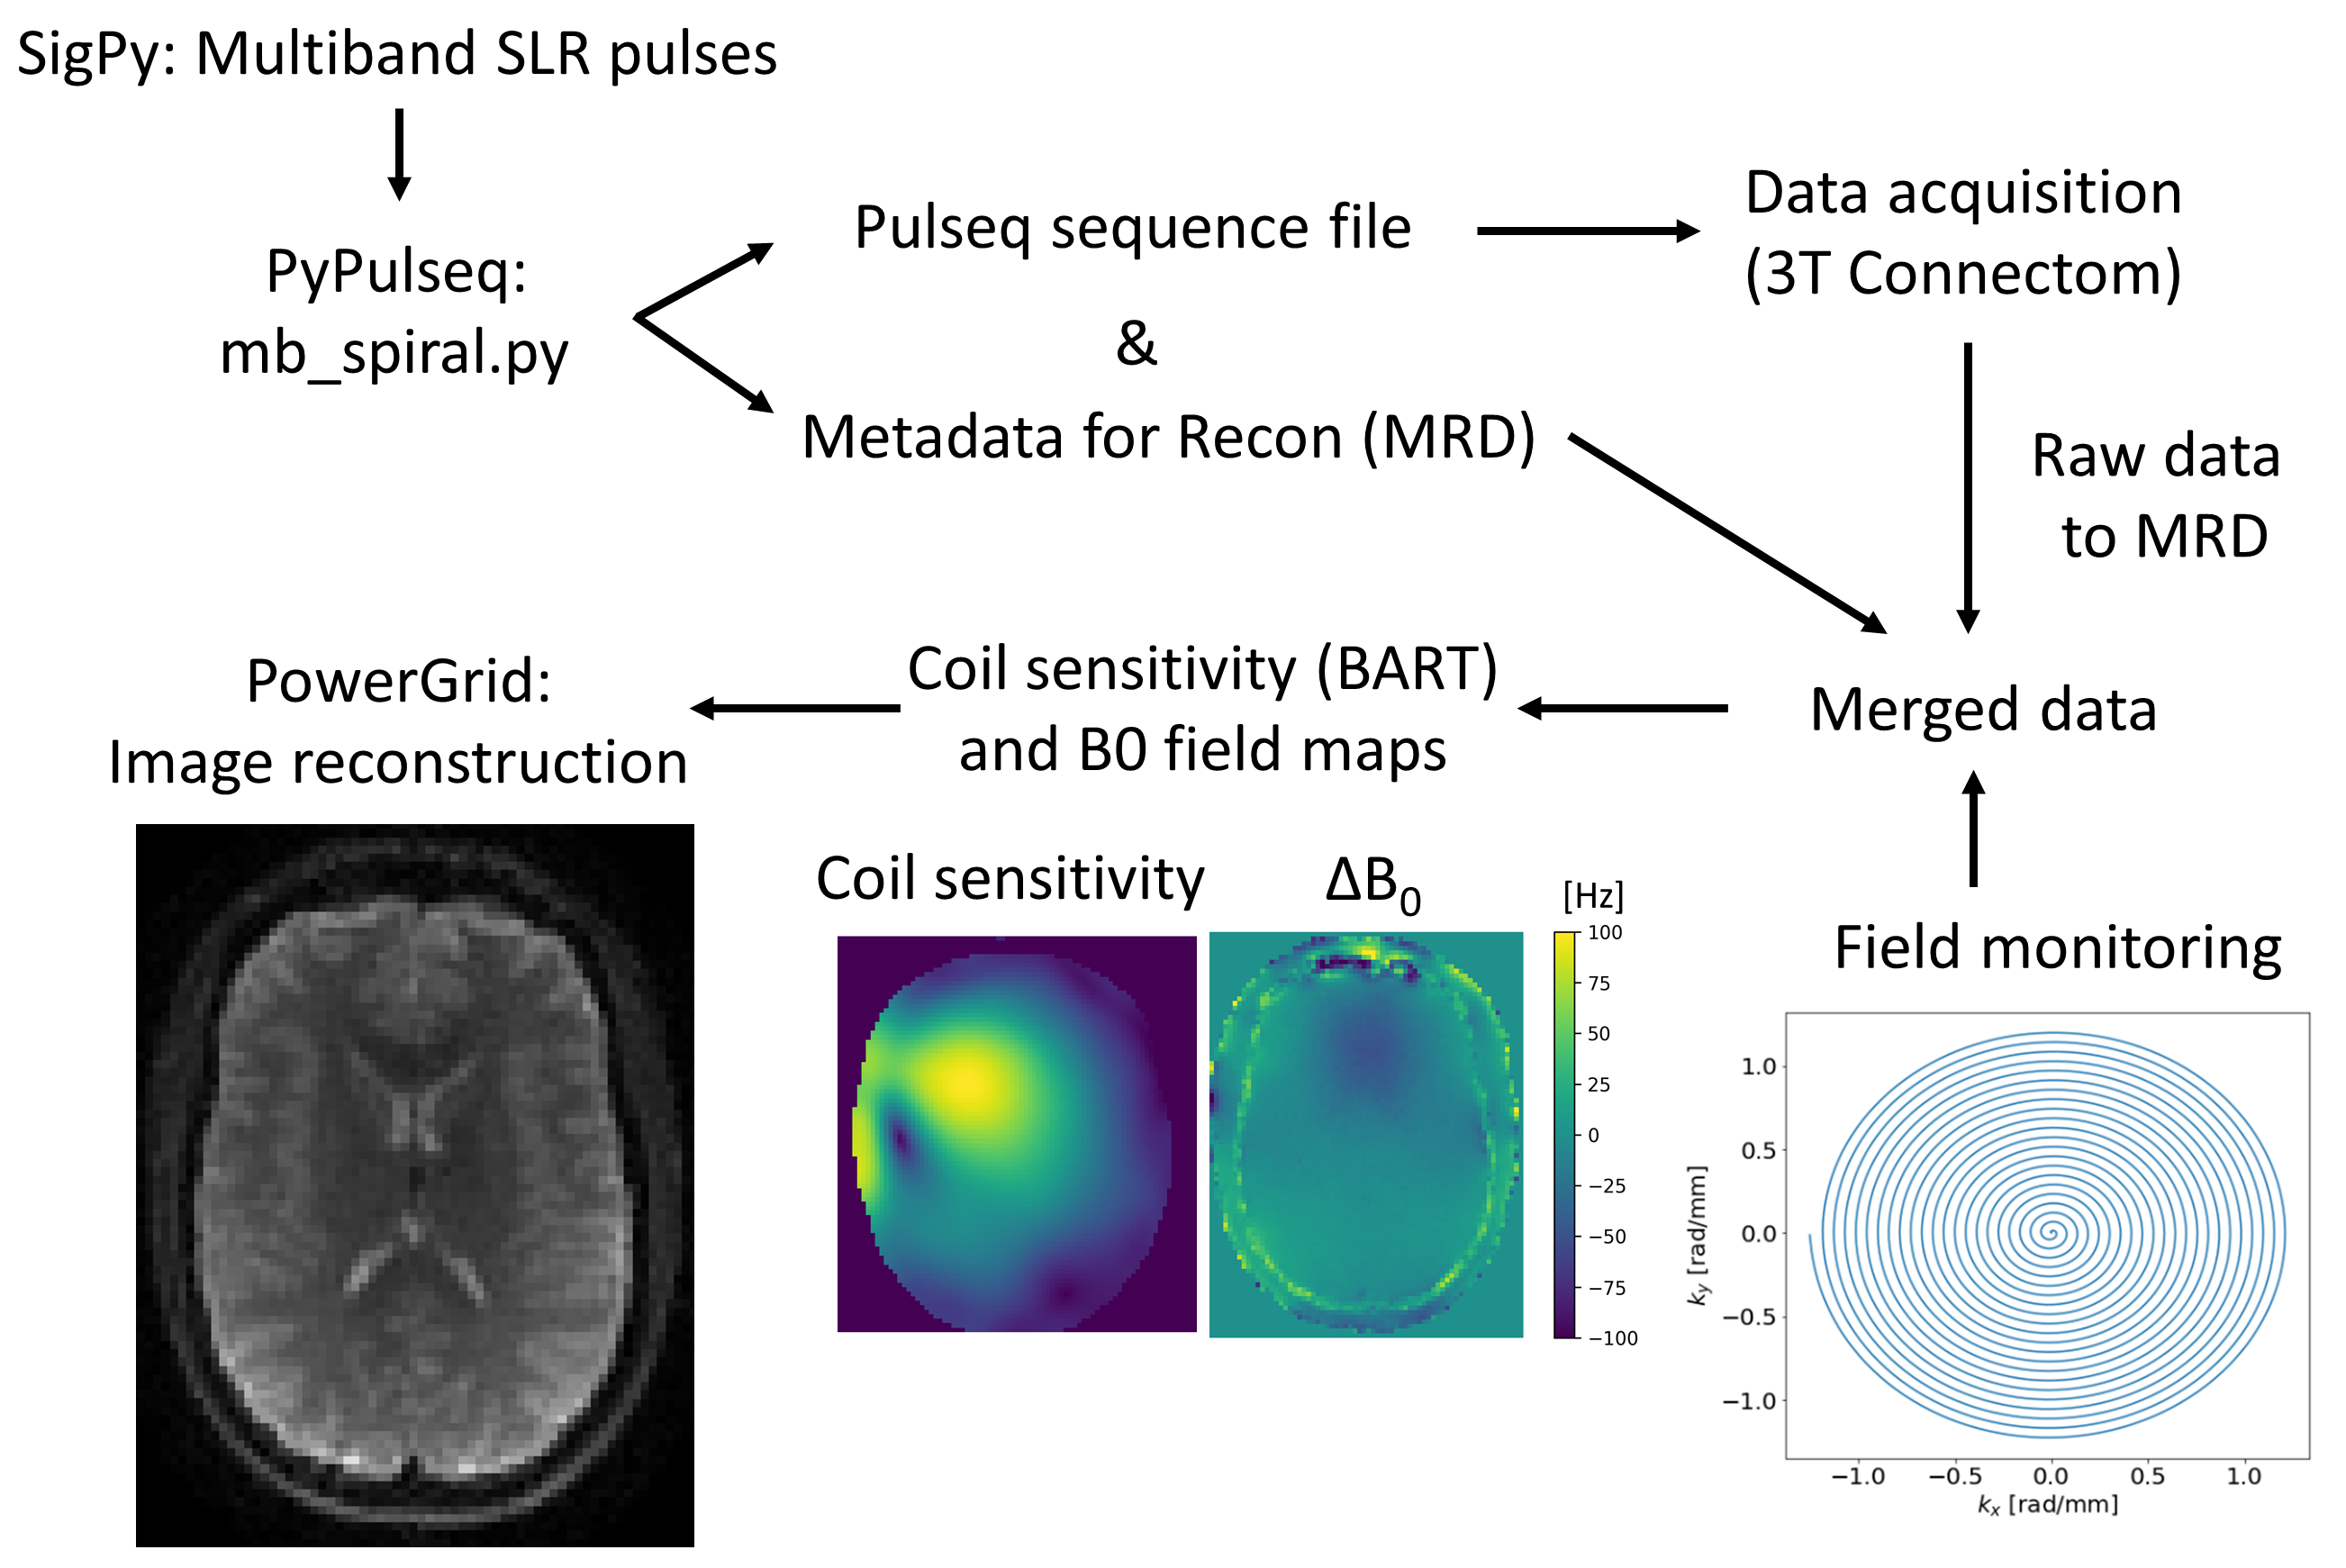
Data were acquired from two healthy volunteers on a 3T Connectom scanner (Siemens, Erlangen) with a maximum gradient strength of 300 mT/m. The multiband single-shot spiral sequence and image reconstruction were implemented with the pipeline5 shown in Figure 1. Parameters of the spiral sequence were: TE=52ms/66ms, readout=18.4ms, R=2 (in-plane), MB=2, volume-TR=3.24s, FOV=220x220x135mm³, res=2.5mm iso, TA=12:14, 32ch RF-receive coil. The spiral sequence included a prescan for B0 field mapping and coil sensitivity estimation. EPI parameters were identical except for TE=66ms, volume-TR=3.5s, readout=23.0ms, TA=13:27min. Non-diffusion-weighted EPI volumes were additionally acquired with inverted phase-encoding direction for distortion correction.Diffusion data were acquired on three b-value shells b=0ms/μm² (10 volumes), b=6ms/μm² (60 volumes) and b=30.45ms/μm² (120 volumes) with diffusion gradient parameters Gmax=280mT/m (maximum amplitude), Δ=29.25ms (spacing), δ=15ms (duration). Spiral trajectories up to third order spherical-harmonics were measured in a separate scan using a field camera (Skope, Zurich). Image reconstruction included spherical-harmonic phase coefficients up to first order and second order concomitant field coefficients as well as static offresonance from the B0 field map.
Preprocessing included denoising6, degibbsing7, motion & eddy-current correction8-10, gradient nonlinearity correction11,12 and Rician bias correction13. Denoising was performed on magnitude images. In addition, the denoising step was repeated for the spiral data in the complex domain (complex EPI data was not available). Eddy-current correction was skipped for the spirals, as trajectory monitoring was performed.
Spherical-harmonic decomposition was done for both shells to calculate powder-averaged signals13,14. An axon radius model was fitted voxel-wise to the powder-averaged data1. Relative SNR maps were generated by dividing the mean-b0 and powder-averaged signals by the noise map from the denoising step. All axon radius maps were registered to T1-weighted MPRAGE images using FLIRT15 and white matter segmentation was done with FAST16.
Results
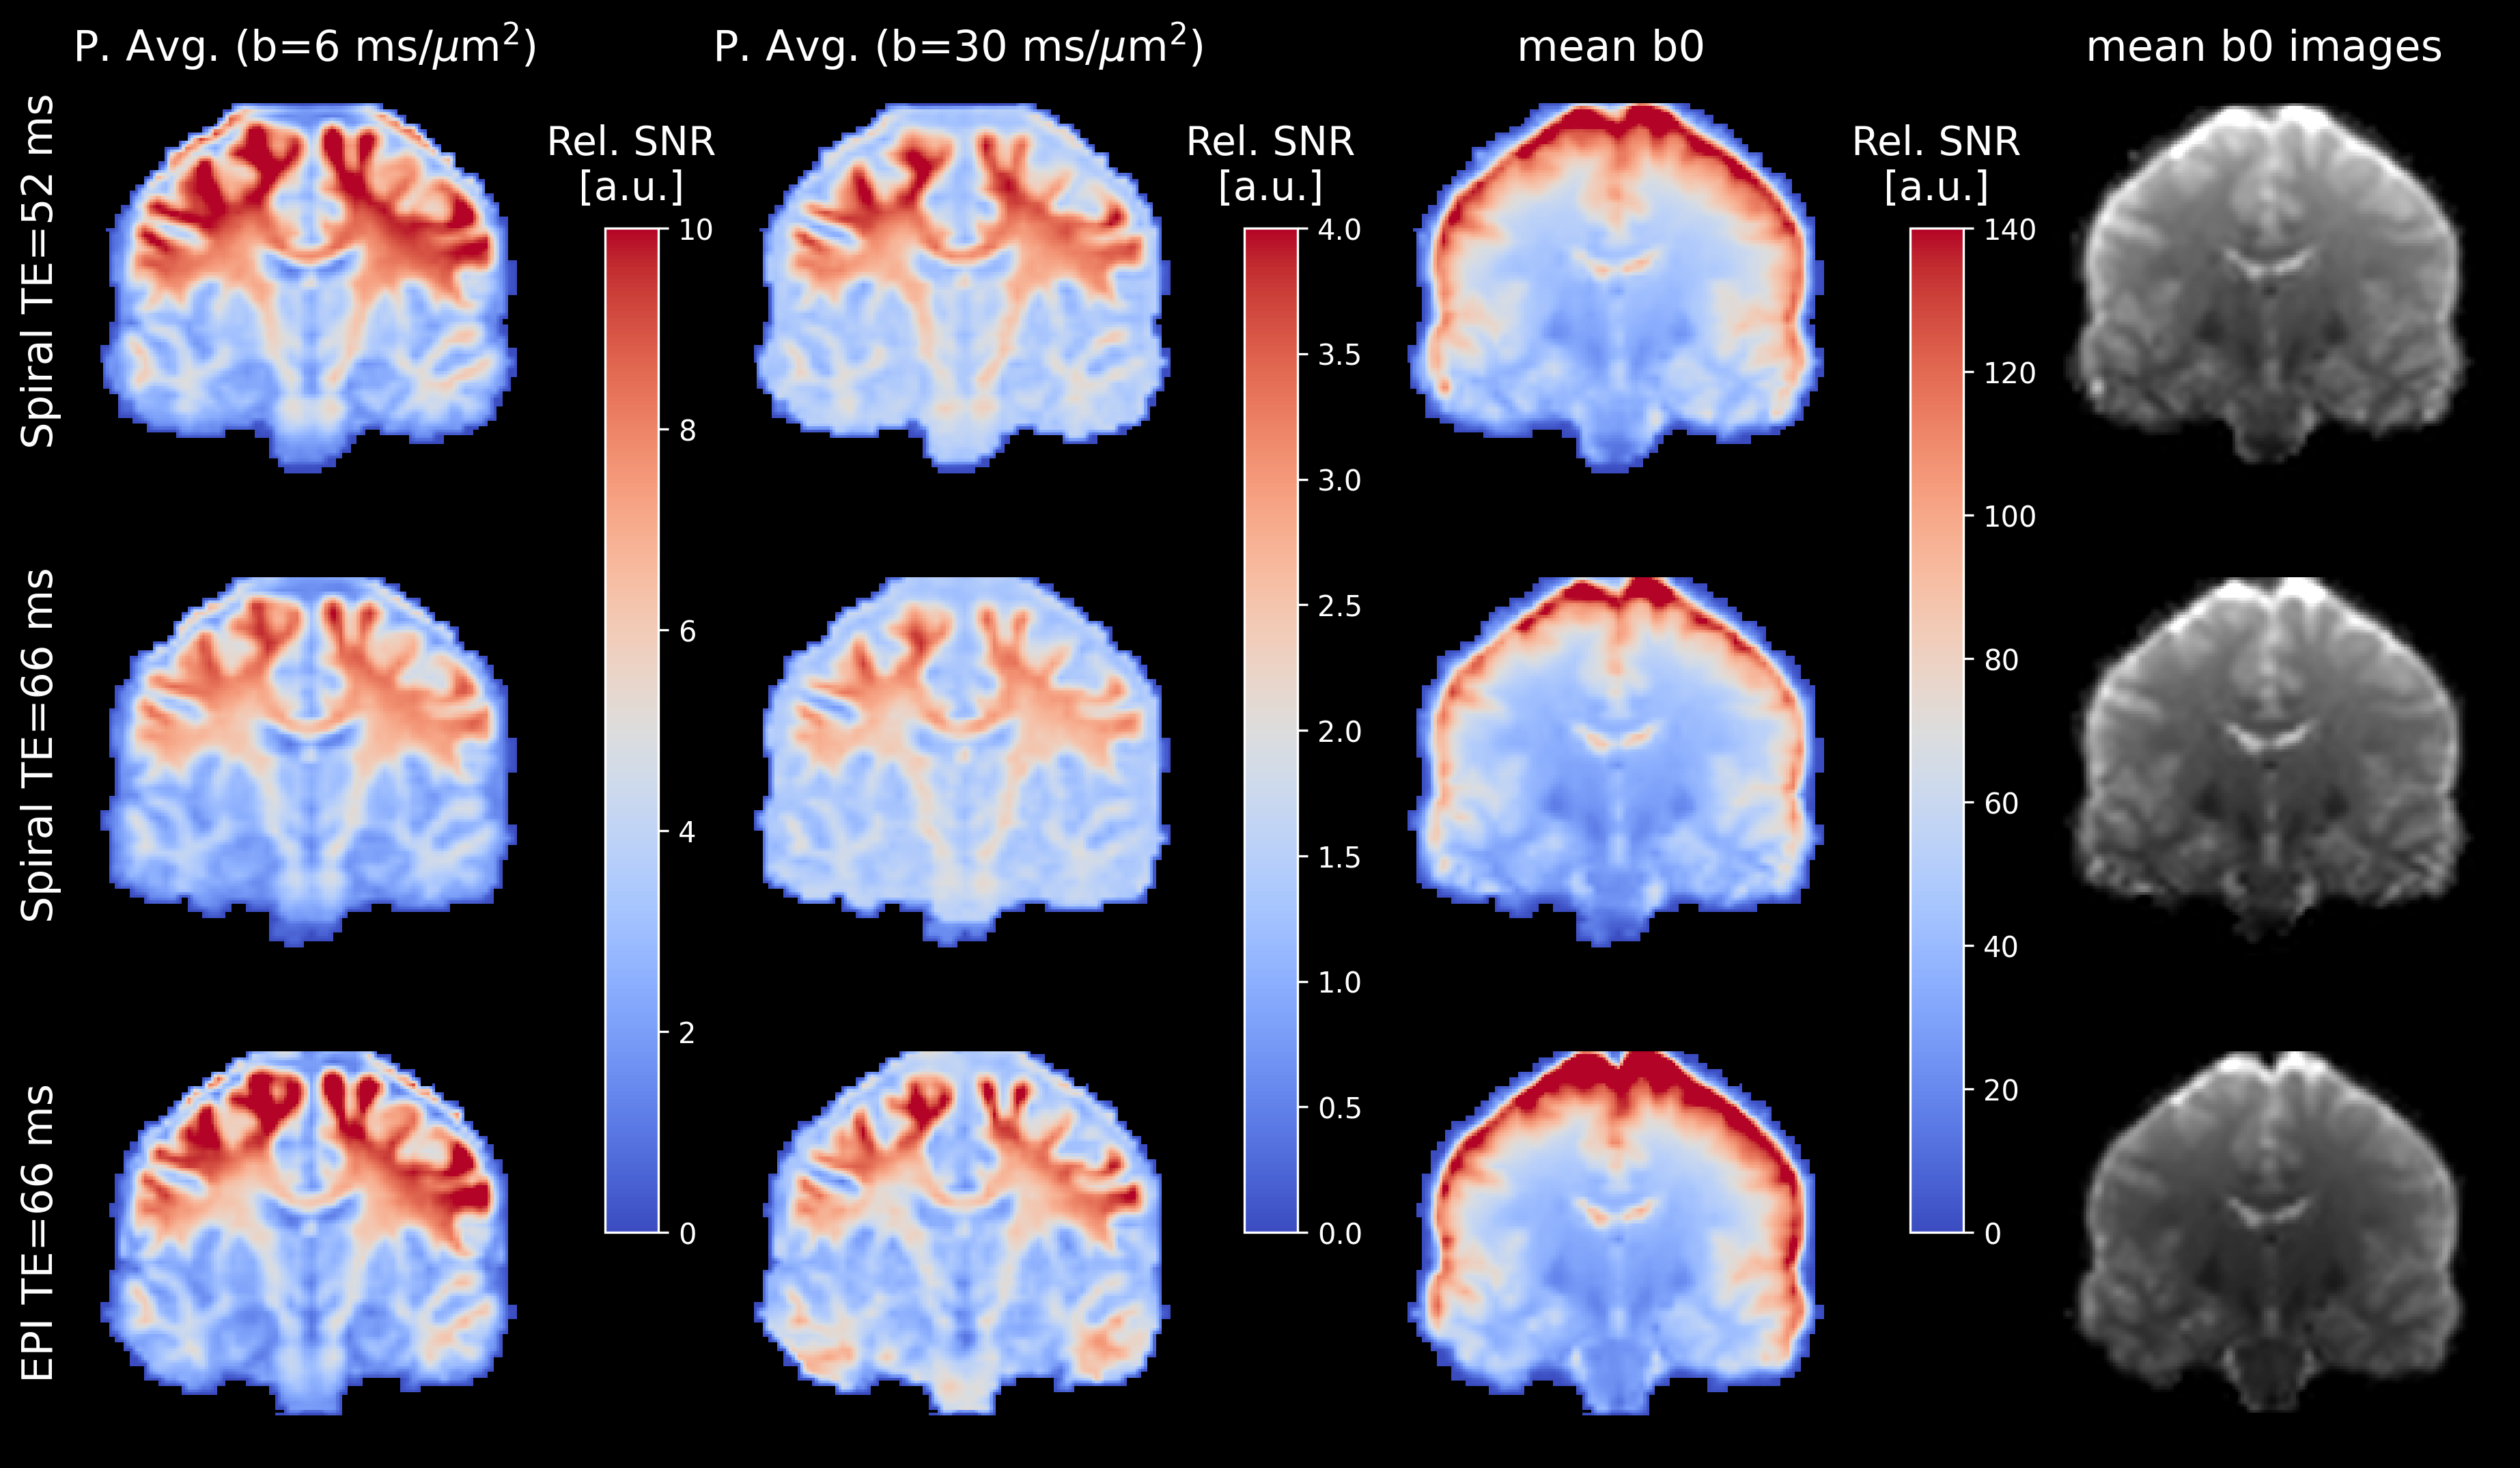
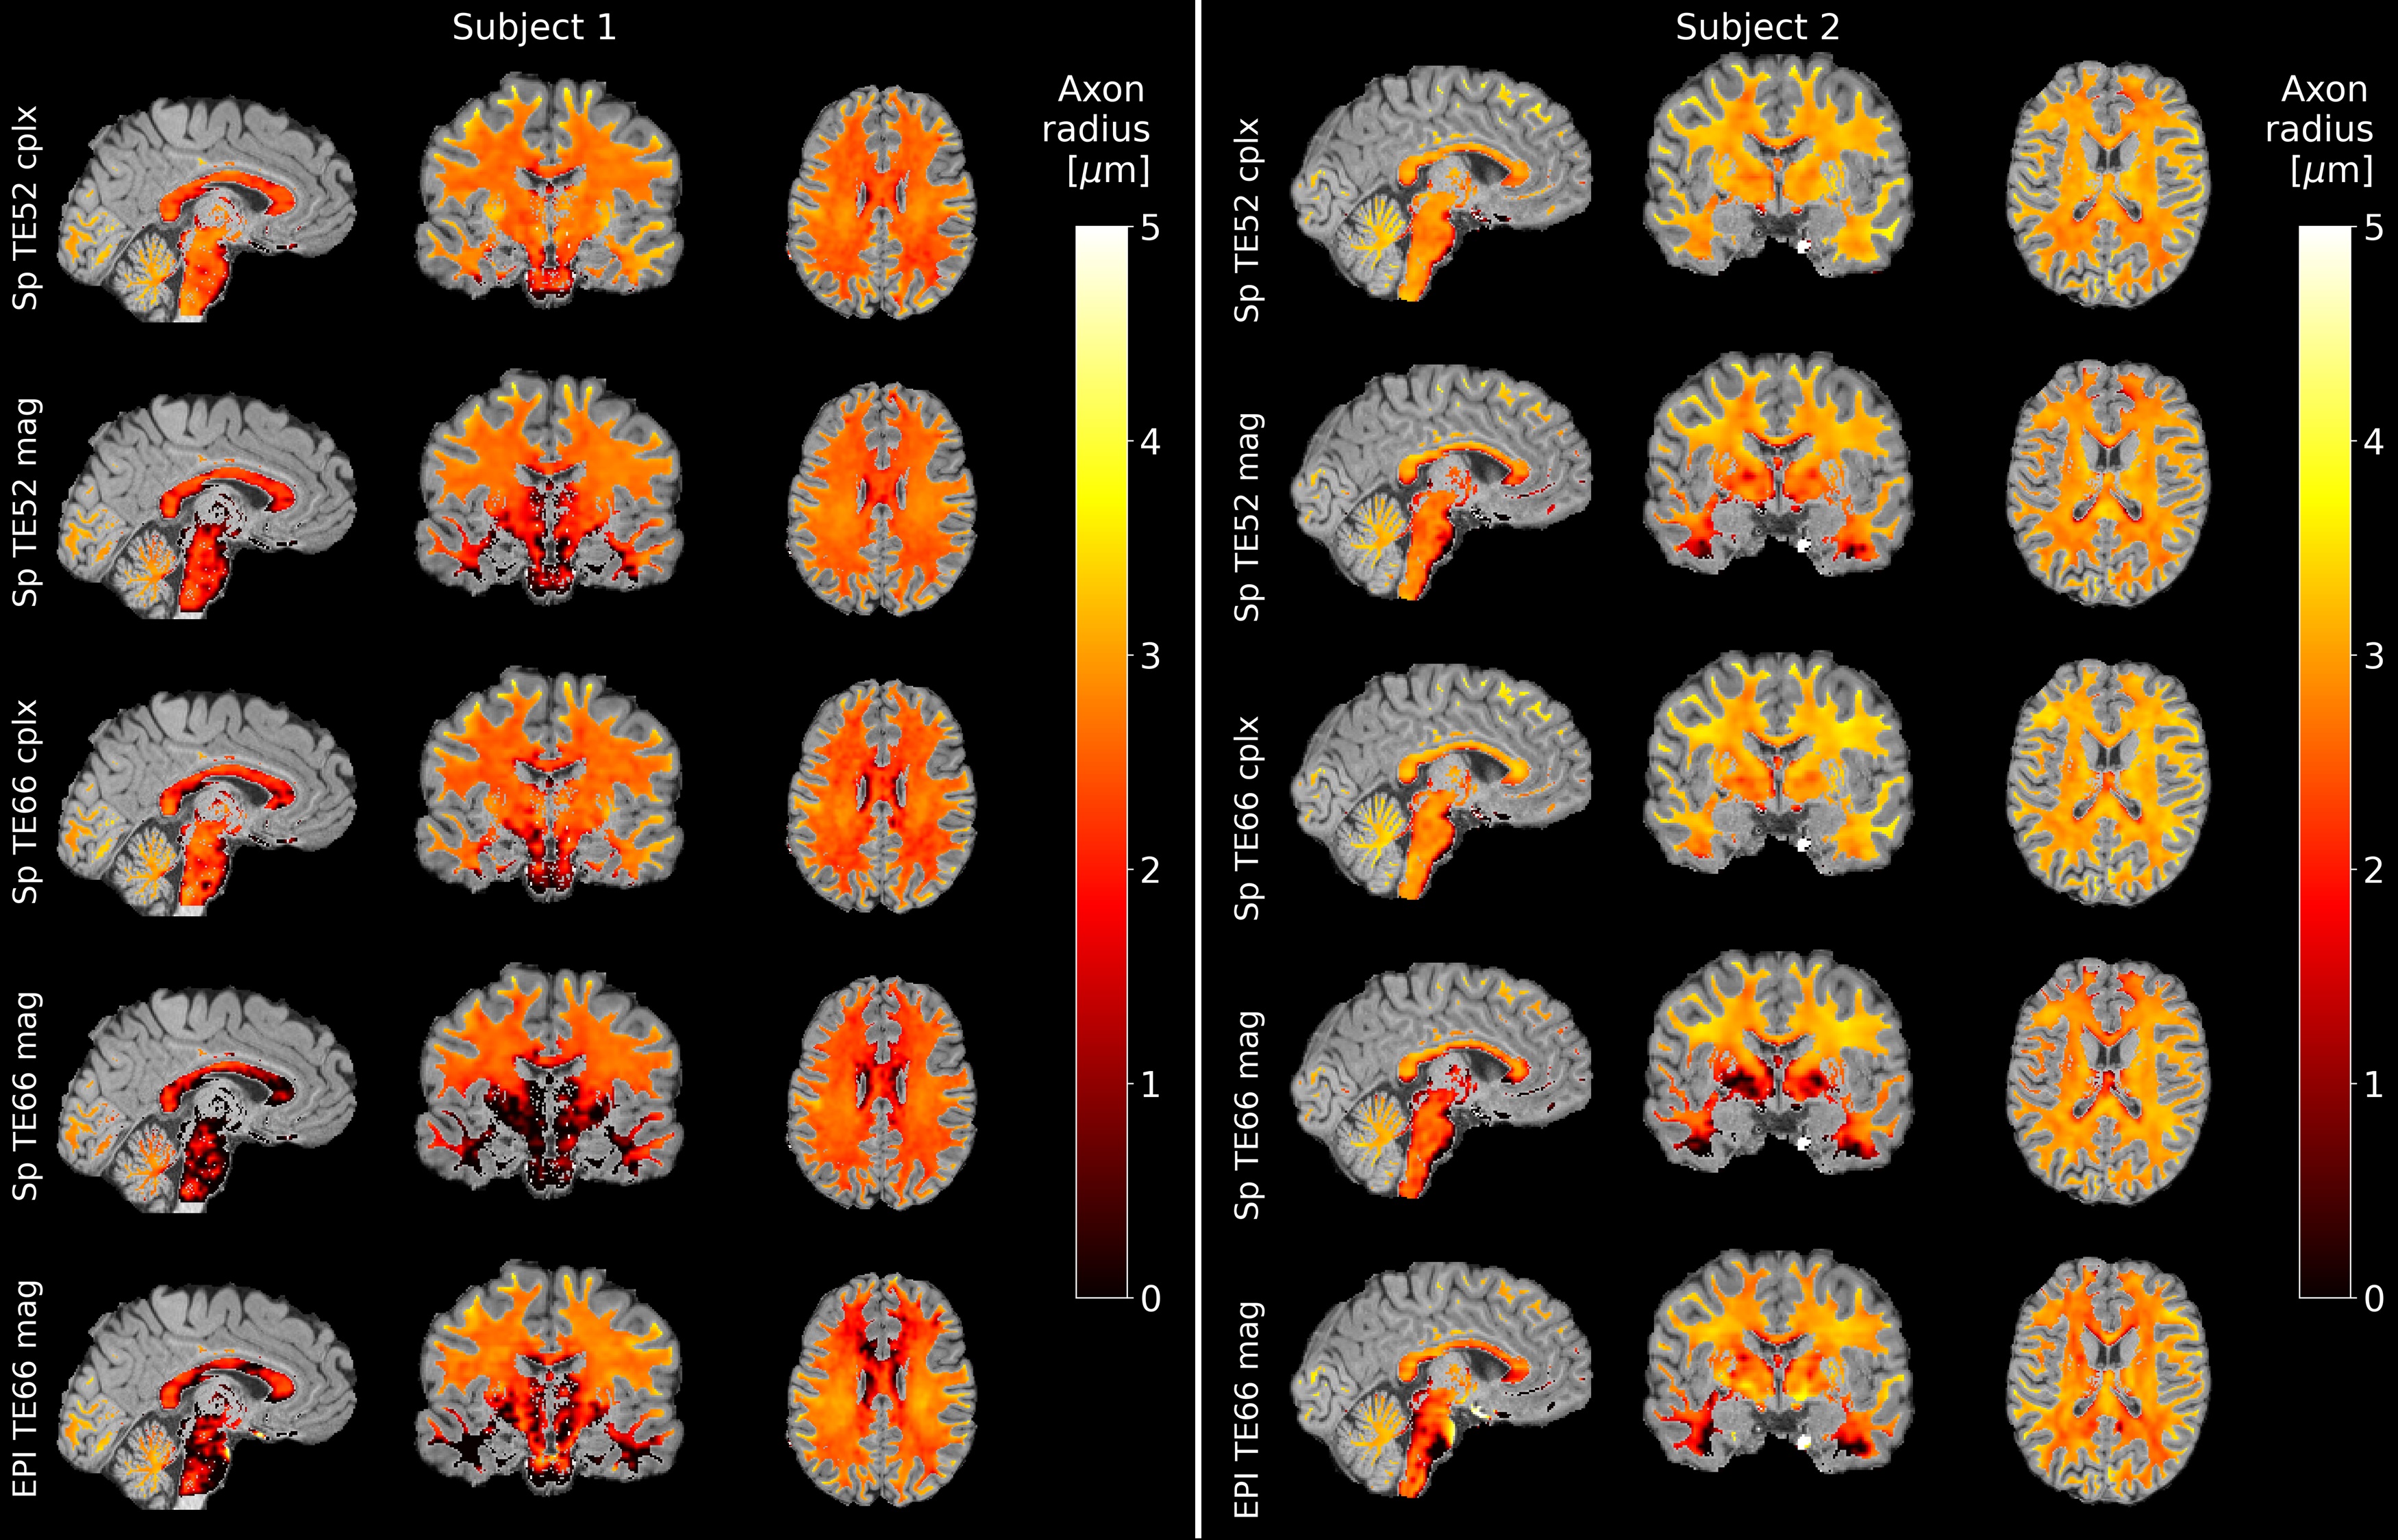
The relative SNR (Figure 2) in the powder-averaged signal is overall higher for short-TE spirals compared to EPI. The SNR difference is higher in the center of the brain compared to the periphery. The relative SNR of long-TE spirals is approximately equal to the EPI in the center of the brain, but lower in the periphery. The high relative SNR of the EPI in the brains periphery is also visible in mean-b0 SNR maps.Figure 3 shows maps of the MR axon radius in white matter in both subjects. The low-TE spiral data has a smoother distribution of axon radii and fewer outlier voxels compared to high-TE spirals and EPI. The distribution of axon radii is smoother for complex-denoised compared to magnitude-denoised spiral data.
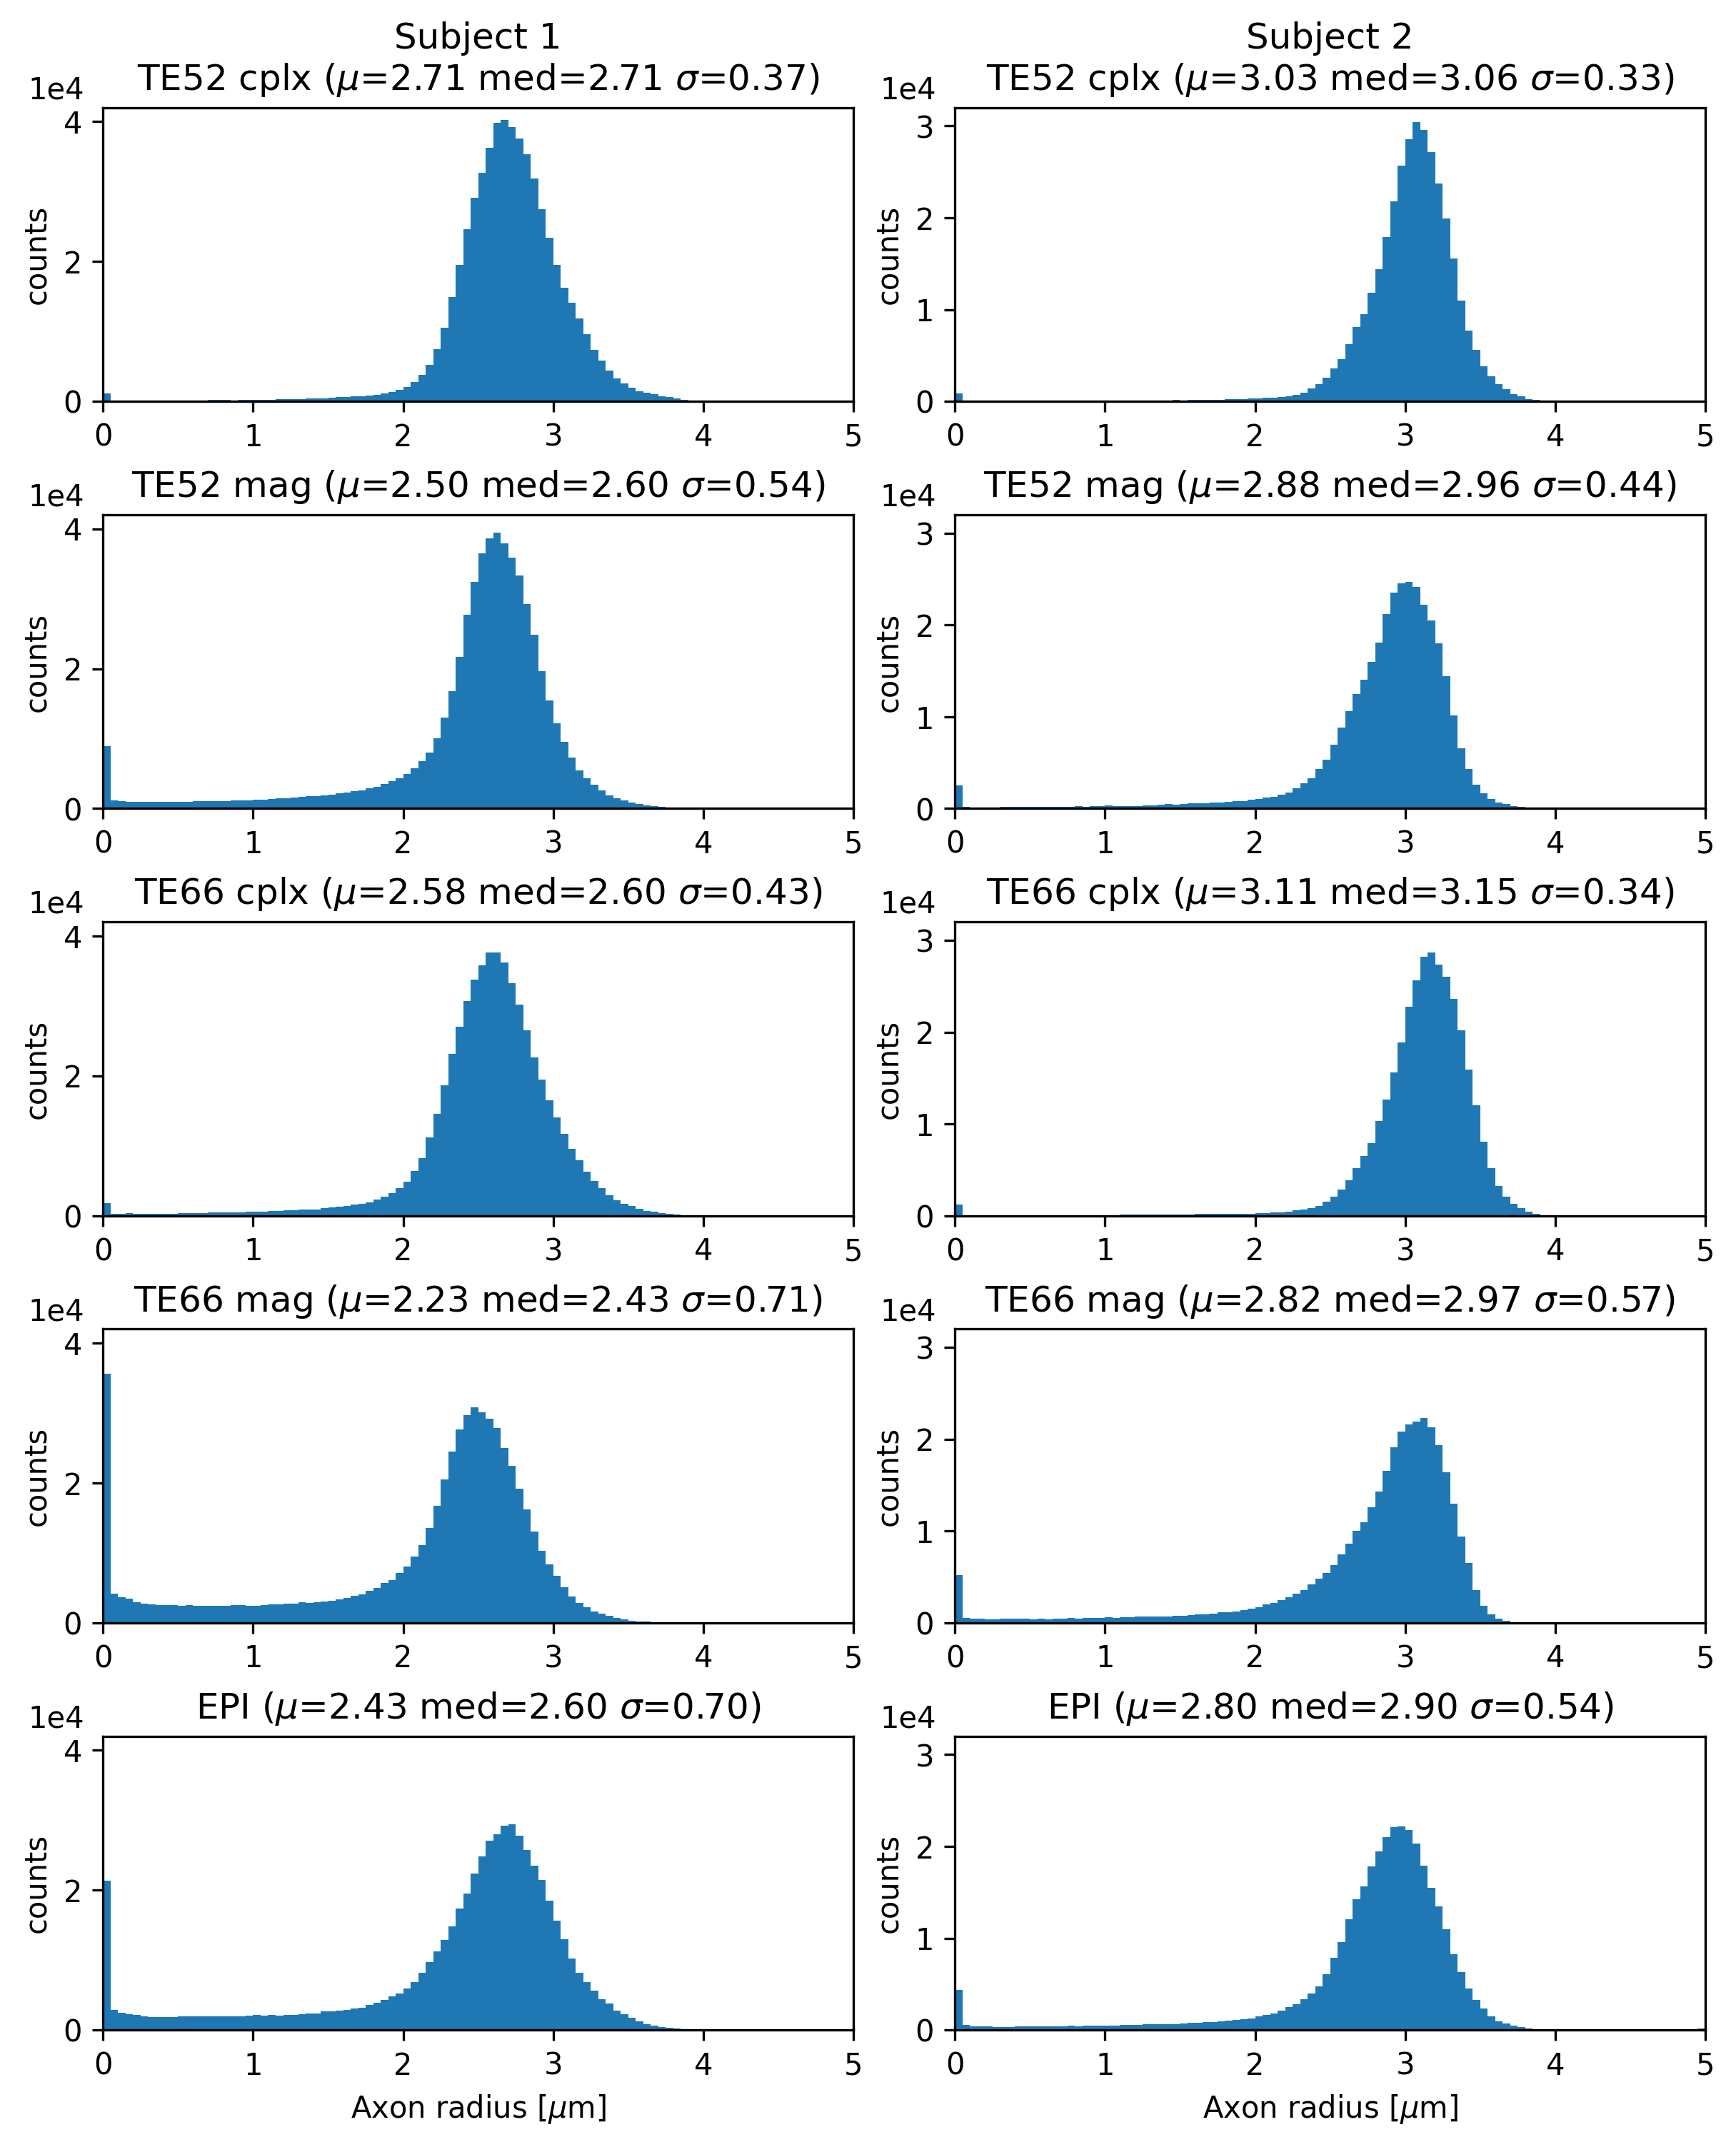
This is reflected in the histograms (Figure 4), where the low-TE complex-denoised spiral dataset drops close to zero at low axon radius and has almost no voxels in the first bin, signifying fewer fitting failures. Mean and median values are higher and standard deviations are lower for low-TE spiral data compared to high-TE spirals and EPI for both subjects.
Discussion
The relative SNR of low-TE spirals in the powder-averaged signal is about 6% higher than the SNR of EPI and therefore the theoretical gain of around 20% (at white matter T2=75ms) due to shorter TE is not achieved. This is partly explained by the 20% lower readout time of the spirals and the 8% lower volume TR, which increases saturation effects. SNR is also influenced by the different RF pulses and reconstruction algorithms used for EPI and spirals.The effective resolution of the spirals is lowered due to blurring from T2* decay, while the EPI suffers from eddy-current induced geometric distortions and lower resolution in phase-encoding direction. Together with the higher SNR in spiral images, this leads to more homogeneous estimations of the axon radius. This is especially visible in the center and basal regions of the brain, where the SNR of the EPI is lower and the MR radius is underestimated compared to the spiral data.
Moreover, complex denoising significantly improves the axon radius estimation and leads to fewer outliers, especially in regions where the SNR is low such as the brainstem. The mean axon radius estimate for the second subject is higher than in the 1st subject in all cases, but a range from 2-3μm for axon radii is generally in line with published results2.
Conclusion
Axon radius estimation is improved by minimizing the echo time with spiral instead of EPI readouts. Denoising based on complex data instead of magnitude data further improves data quality.Acknowledgements
Funding from the German Chapter of the ISMRM for this project is greatly acknowledged.
This project has also received funding from the European Union's Horizon 2020 research and innovation programme under the grant agreement No 681094, and is supported by the Swiss State Secretariat for Education, Research and Innovation (SERI) under contract number 15.0137.
It is also funded by the Deutsche Forschungsgemeinschaft (DFG, German Research Foundation) – project no. 347592254 (WE 5046/4-2 and/or KI 1337/2-2).References
1. Veraart, J. et. al. Noninvasive quantification of axon radii using diffusion MRI. eLife, 2020;9:e49855
2. Veraart, J. et. al. The variability of MR axon radii estimates in the human white matter. Hum. Brain Mapp., 2021;42:2201-2213
3. Setsompop, K. et. al. Pushing the limits of in vivo diffusion MRI for the Human Connectome Project. NeuroImage, 2013;80:220-233
4. Lee, Y. et. al. On the signal-to-noise ratio benefit of spiral acquisition in diffusion MRI. Magn. Reson. Med., 2021;85:1924-1937
5. Veldmann, M. et. al. Open-source MR imaging and reconstruction workflow. Magn. Reson. Med., 2022;88(6): 2395-2407
6. Cordero-Grande, L. et. al. Complex diffusion-weighted image estimation via matrix recovery under general noise models. NeuroImage, 2019;200:391-404
7. Kellner, E; Dhital, B; Kiselev, V.G & Reisert, M. Gibbs-ringing artifact removal based on local subvoxel-shifts. Magn. Res. Med, 2016;76:1574–1581
8. Andersson, J. and Sotiropoulos, S.. An integrated approach to correction for off-resonance effects and subject movement in diffusion MR imaging. NeuroImage, 2016;125:1063-1078
9. Andersson, J. et. al. Incorporating outlier detection and replacement into a non-parametric framework for movement and distortion correction of diffusion MR images. NeuroImage, 2016;141:556-572
10. Andersson, J. et. al. Towards a comprehensive framework for movement and distortion correction of diffusion MR images: Within volume movement. NeuroImage, 2017;152:450-466.
11. Janke, A., et al. Use of spherical harmonic deconvolution methods to compensate for nonlinear gradient effects on MRI images, Magn. Reson. Med., 2004;52(1):115-122
12. Glasser, M. et. al. The minimal preprocessing pipelines for the Human Connectome Project. Neuroimage, 2013;80:105-24
13. Tournier, J.-D. et. al. MRtrix3: A fast, flexible and open software framework for medical image processing and visualisation. NeuroImage, 2019;202:116137
14. Afzali, et al. Computing the orientational-average of diffusion-weighted MRI signals: a comparison of different techniques. Scientific Reports, 2021;11:14345
15. M. Jenkinson, P.R. Bannister, J.M. Brady, and S.M. Smith. Improved optimisation for the robust and accurate linear registration and motion correction of brain images. NeuroImage, 2002;17(2):825-841.
16. Zhang, Y. and Brady, M. and Smith, S. Segmentation of brain MR images through a hidden Markov random field model and the expectation-maximization algorithm. IEEE Trans Med Imag, 2001;20(1):45-57.
17. Ravi, K. et. al PyPulseq: A Python Package for MRI Pulse Sequence Design. J. Open Source Softw. 2019;4(42):1725
18. Layton, K. J. et. al. Pulseq: A rapid and hardware‐independent pulse sequence prototyping framework. Magn. Reson. Med., 2017;77(4):1544-1552
19. Ong F, Lustig M. SigPy: A Python Package for High Performance Iterative Reconstruction. Proc. Intl. Soc. Mag. Res. Med. 27., 2019.
20. Uecker, M. et. al. Berkeley Advanced Reconstruction Toolbox. Annual Meeting ISMRM, Toronto, Proc. Intl. Soc. Mag. Reson. Med., 2015;23:2486, DOI: 10.5281/zenodo.592960
21. Uecker, M. et. al. ESPIRiT—an eigenvalue approach to autocalibrating parallel MRI: Where SENSE meets GRAPPA. Mag. Reson. Med., 2014;71(3):990-1001
22. Wilm BJ, Barmet C, Pavan M and Pruessmann KP. Higher order reconstruction for MRI in the presence of spatiotemporal field perturbations. Magn. Reson. Med., 2011;65:1690-1701
23. Cerjanic A, Holtrop JL, Ngo G-C, et al. PowerGrid: A open source library for accelerated iterative magnetic resonance image reconstruction. Proc. Intl. Soc. Mag. Res. Med. 24, 2016:525.
24. Inati, S. et. al. ISMRM Raw data format: A proposed standard for MRI raw datasets. Magn. Reson. Med., 2017;77(1):411-421
Figures