5166
Brain water-content based Electrical Properties Tomography in healthy volunteers, tumor and multiple sclerosis patients1Department of Radiotherapy, UMC Utrecht, Utrecht, Netherlands, 2Computational Imaging Group for MR Therapy and Diagnostics, UMC Utrecht, Utrecht, Netherlands, 3Department of Radiology, UMC Utrecht, Utrecht, Netherlands, 4Department of Medical Imaging, Radboud UMC, Nijmegen, Netherlands
Synopsis
Keywords: Electromagnetic Tissue Properties, Electromagnetic Tissue Properties, Conductivity
In this work, we first extend the validation of the water-content based Electrical Properties Tomography (wEPT) model from brain white matter to gray matter conductivity reconstructions in healthy volunteers. Secondly, we show that wEPT reconstructions calibrated on 10 healthy volunteers from an MR-STAT clinical trial dataset show a conductivity increase in pathological regions for 6 primary brain tumor and 9 multiple sclerosis (MS) patients from the same study. For diffuse glioma, a positive correlation between grade and conductivity is observed. For MS white matter lesions a clear conductivity increase is observed compared to healthy white matter.Introduction
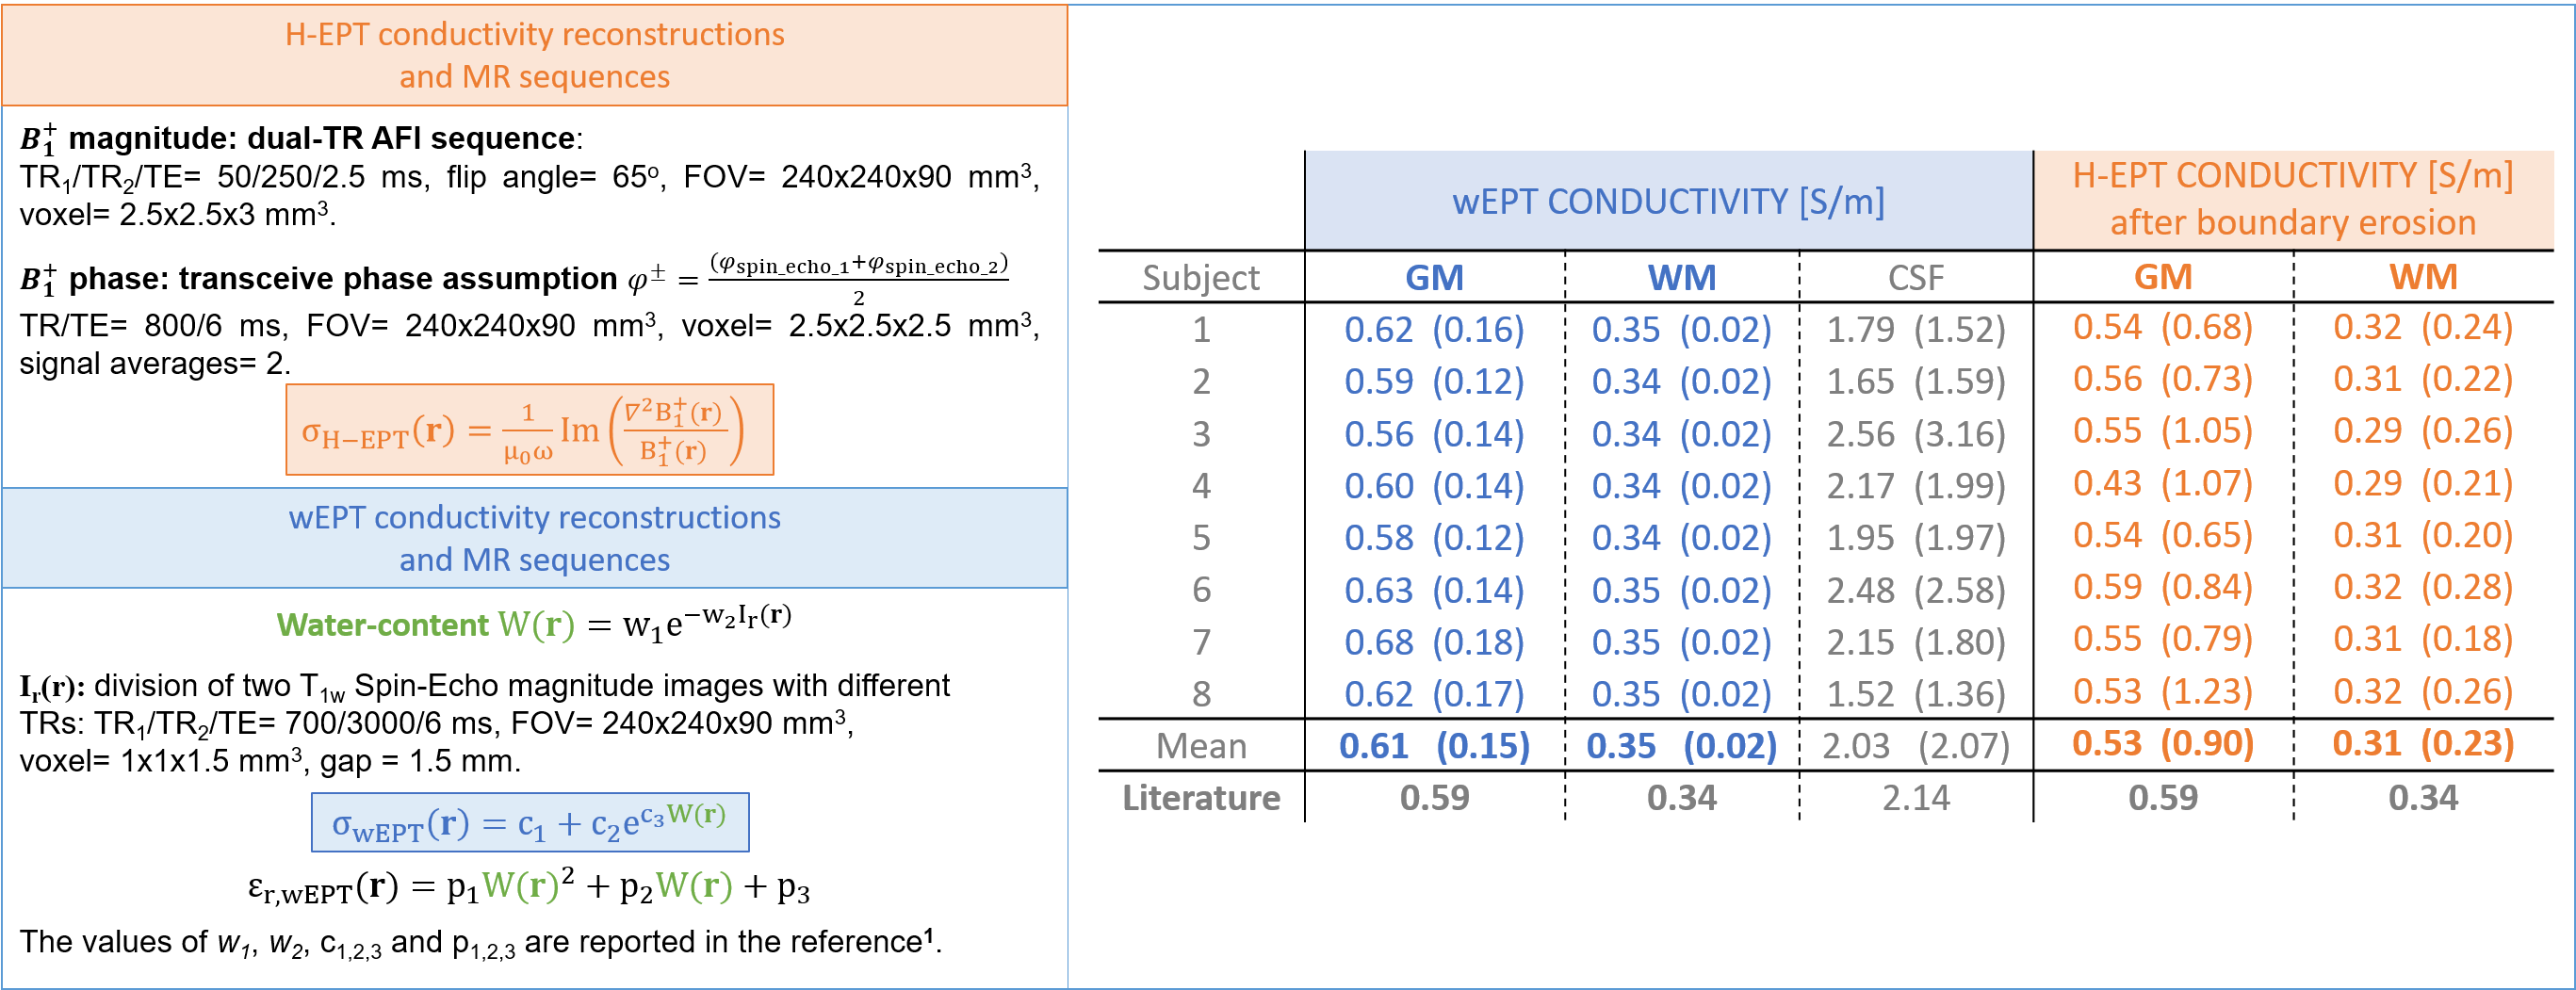
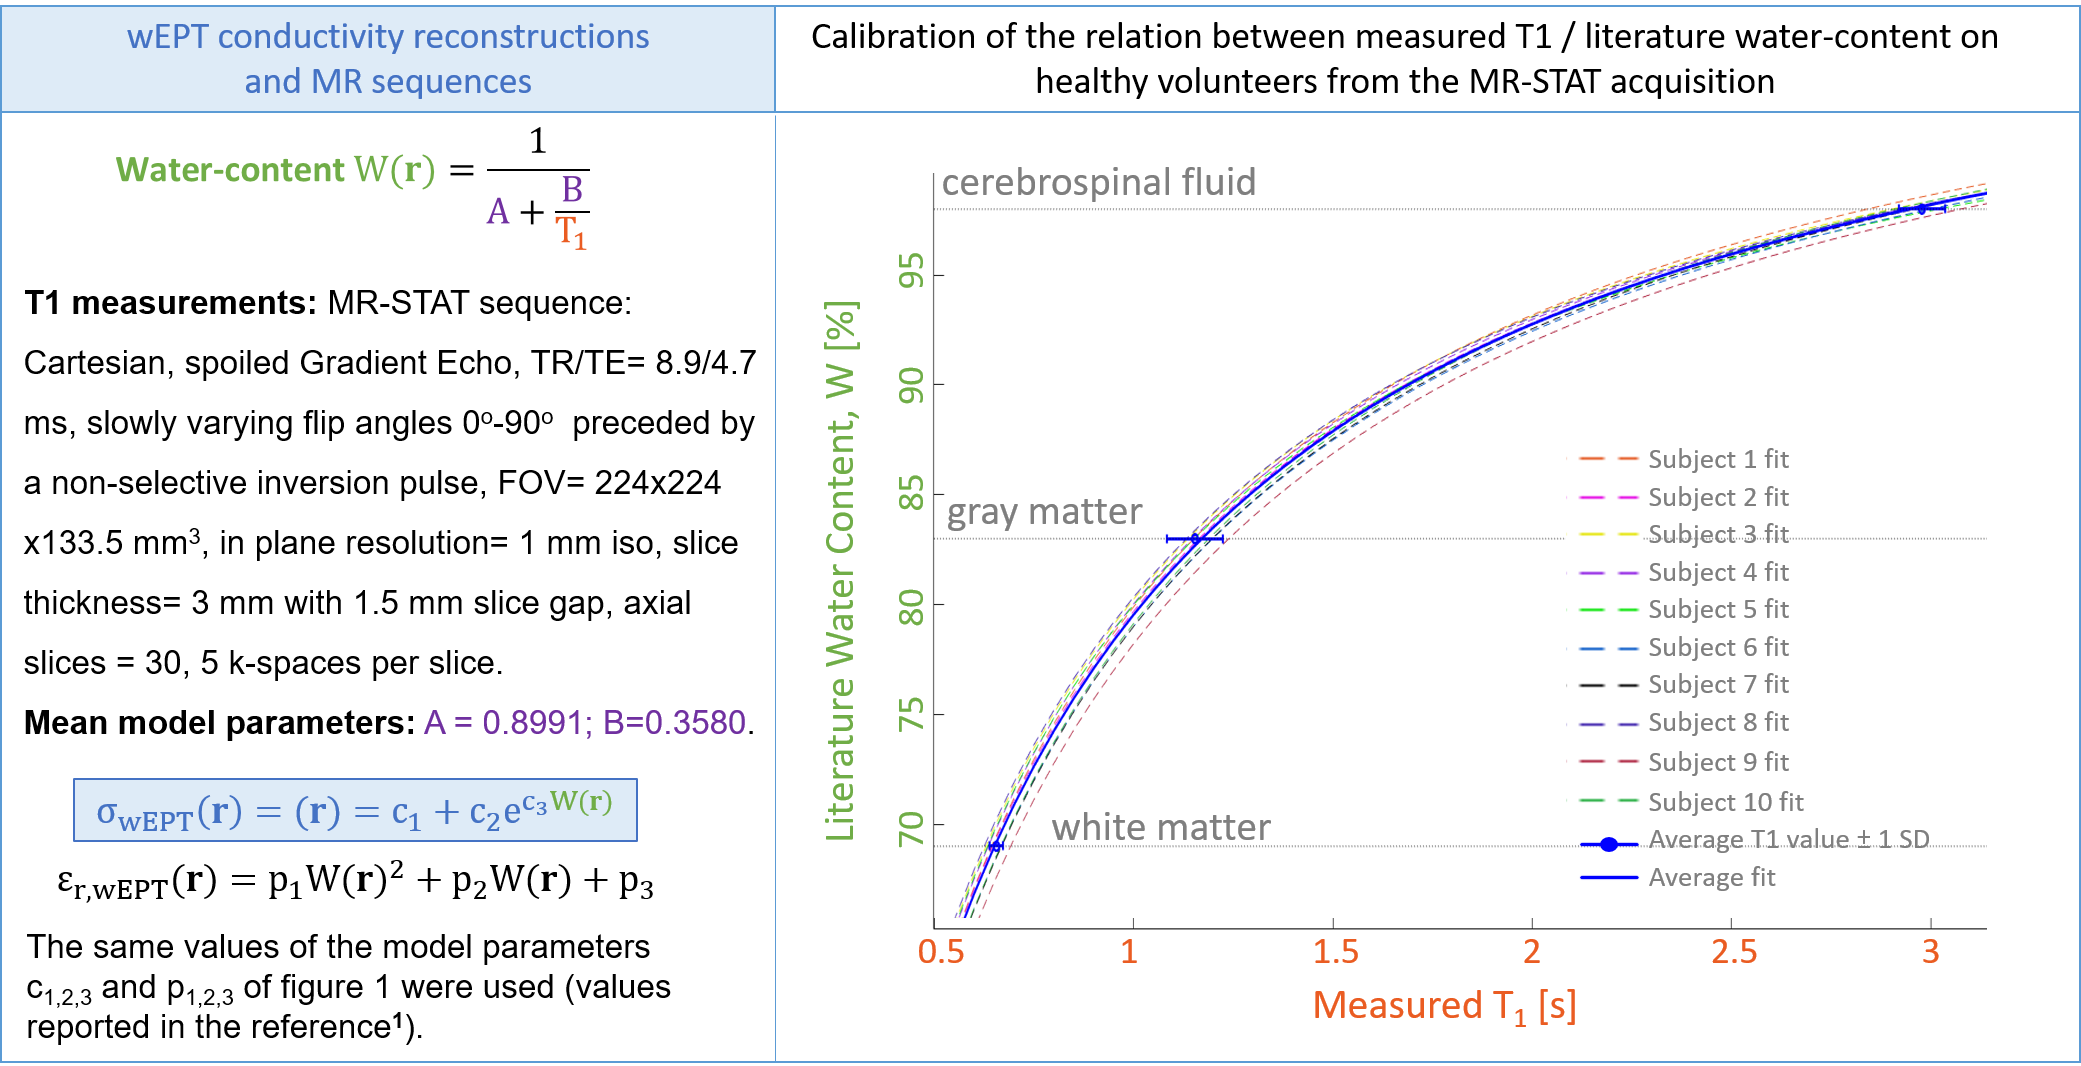
Recently, it has been shown that tissue electrical properties (EPs, conductivity σ and permittivity εr) can be reconstructed from water-content (W) maps (wEPT)1 according to: σwEPT=c1+c2exp(c3W); εr,wEPT=p1W2+p2W+p3, where water-content maps can be computed from quantitative T1 maps (e.g., using a MR fingerprinting acquisition2) according to: W=1/(A+(B/T1)). Initially, the model parameters c1,2,3 and p1,2,3 were computed by fitting literature water-content values to ex-vivo EPs values in the white matter (WM), gray matter (GM), and cerebrospinal fluid (CSF). This model was then validated for healthy WM tissue using standard Helmholtz-based EPT (H-EPT) reconstructions as an independent reference3.Here, we first extend the validation of the wEPT model for GM conductivity reconstructions in healthy volunteers using H-EPT reconstructions as an independent reference (objective 1). Secondly, we investigate whether wEPT reconstructions calibrated on 10 healthy volunteers from an MR-STAT clinical trial dataset4 can highlight pathologies in 6 primary brain tumor and 9 multiple sclerosis (MS) patients from the same study (objective 2) and provide realistic conductivity values in pathological tissue (objective 3).
Methods
Objective 1 – wEPT model validation in healthy GM: As previously done for the validation of wEPT reconstructions in WM3, wEPT reconstructions were performed on 8 healthy subjects and compared to H-EPT reconstructions. For H-EPT reconstructions the B1+ magnitude was measured using Actual Flip Angle Imaging (AFI), while the phase was obtained by combining two Spin-Echo sequences with opposite readout gradient polarities5. For wEPT reconstructions water-content maps were computed by dividing two T1-weighted Spin-Echo maps with different repetition times. MR measurements were performed with an 8-channel transmit/receive head coil at 3 T (Achieva, Philips). MR sequences, H-EPT, and wEPT reconstruction details are reported in references3,5, while the wEPT c1,2,3/p1,2,3 parameter values used to validate the wEPT model in healthy GM are reported in reference1 (see also Figure 1).Objective 2 – wEPT reconstructions from MR-STAT clinical trial: wEPT reconstructions were here performed on 10 healthy volunteers, 6 brain tumor patients (meningioma and diffuse glioma), and 9 MS patients from a recently conducted MR-STAT clinical trial using the same c1,2,3/p1,2,3 parameter values that were used in objective 1 (the exact values are reported in reference1). MR-STAT data providing quantitative T1 maps were acquired on a 3 T scanner (Ingenia, Philips)4, from which water-content maps were computed: W=1/(A+(B/T1)), as previously suggested2. First, the A/B parameter values were computed for each healthy volunteer by fitting the measured T1 values in WM, GM, and CSF to literature water-content values. These were then compared to the A/B parameter values obtained using average T1 values per tissue type among the 10 healthy subjects (see Figure 2). The latter A/B parameter values were used to compute water-content maps for all participants, from which EPs maps were derived.
Objective 3 – quantitative wEPT conductivity analysis: Mean wEPT conductivity values in healthy WM/GM/CSF were computed and compared among the 25 participants to investigate possible differences between healthy volunteers and patients. Mean tumor conductivity values were computed to investigate possible relations between wEPT-based conductivity values and tumor grade, as observed for H-EPT6. Mean conductivity values in MS lesions were computed to investigate variations between healthy WM tissue and WM lesions.
Results and Discussion
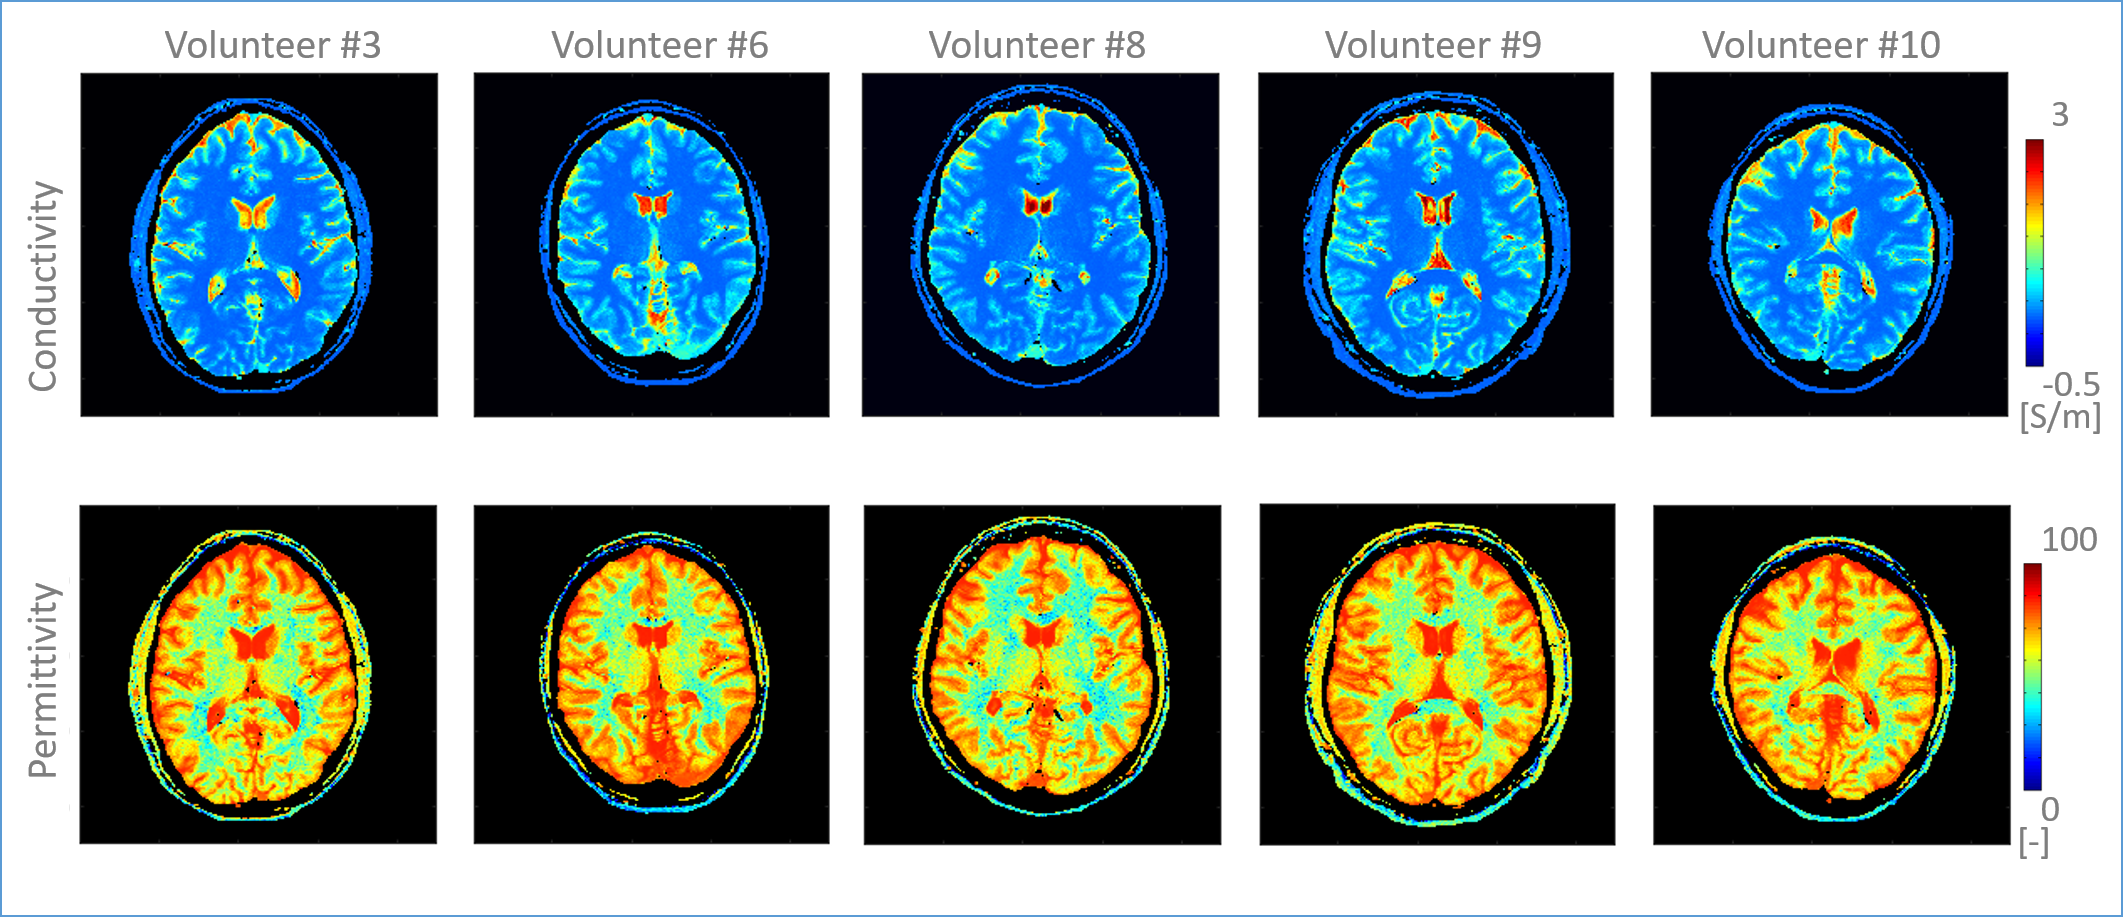
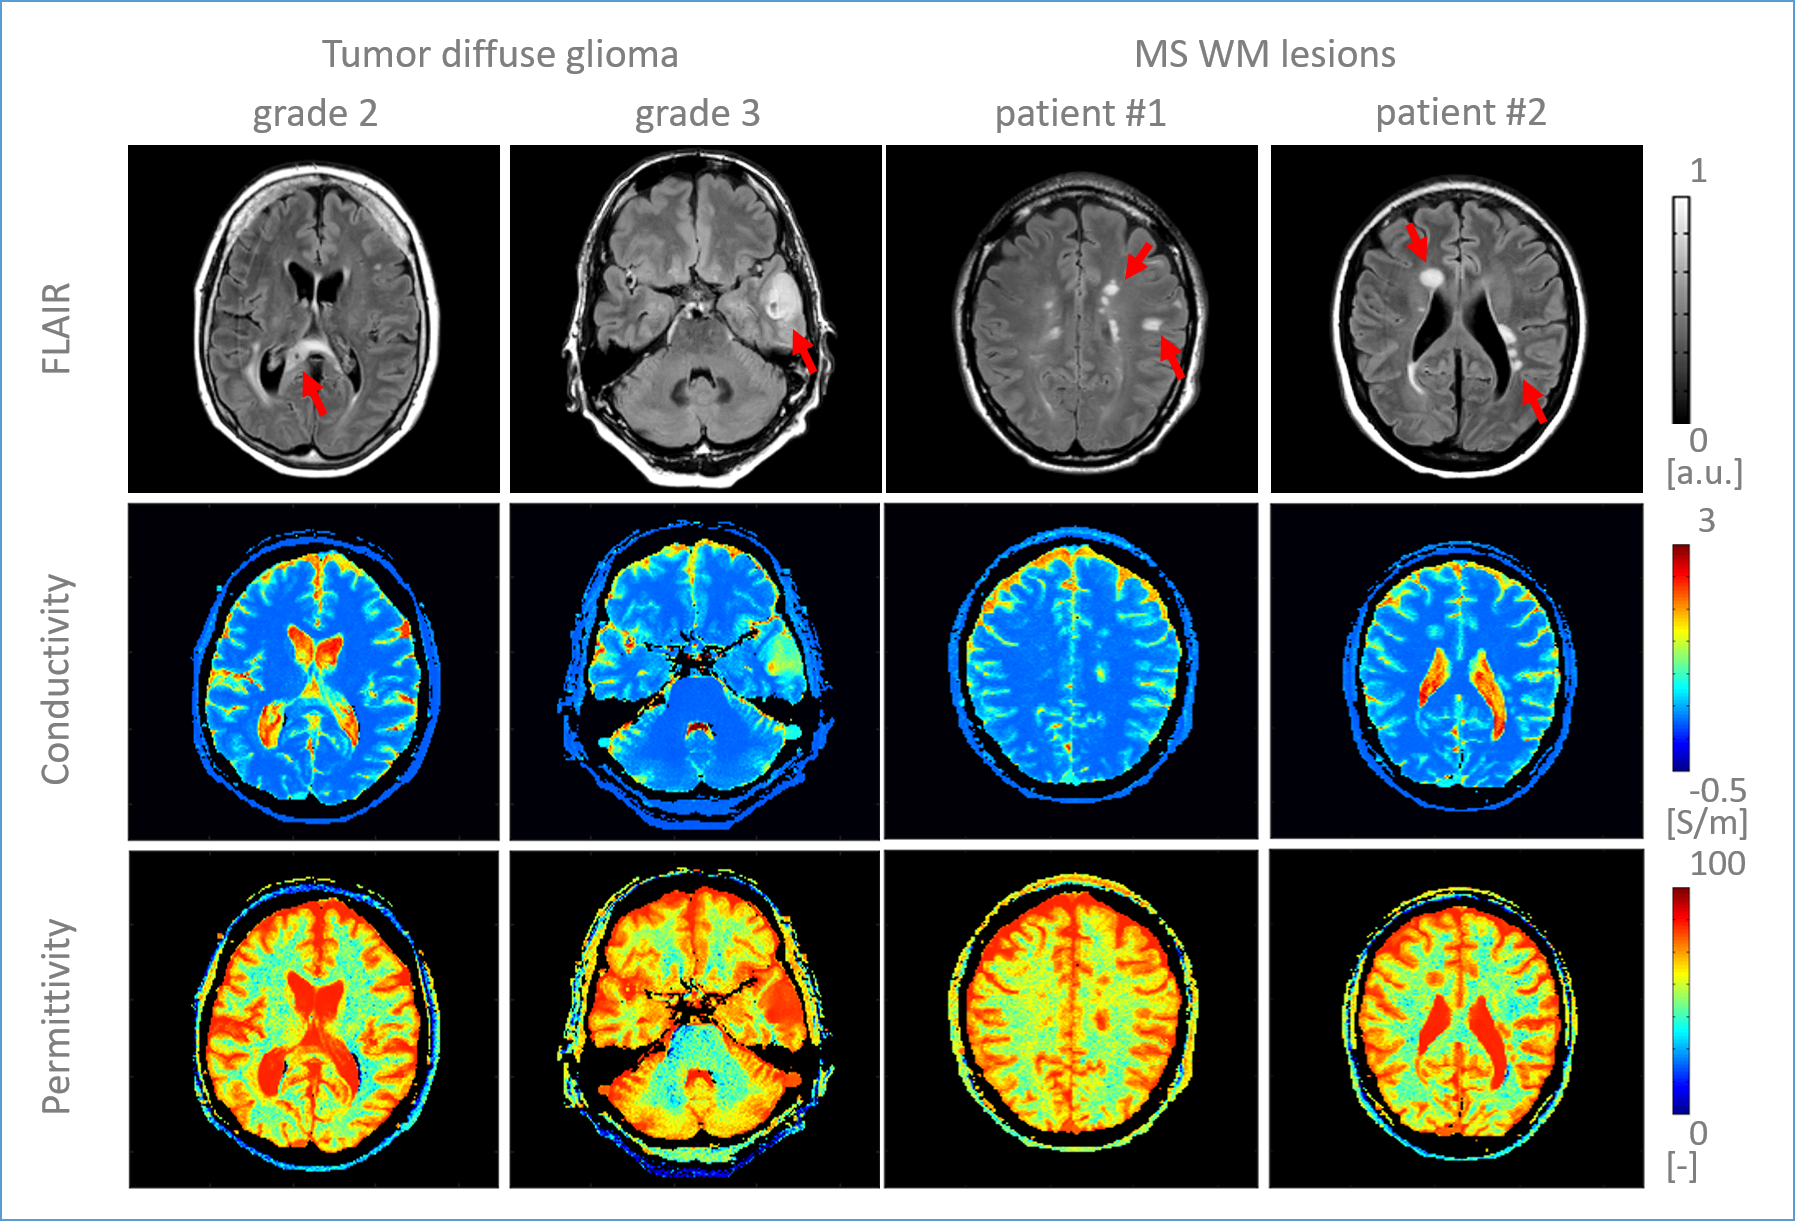
Objective 1: In Figure 1, wEPT conductivity reconstructions are compared to H-EPT reconstructions for 8 healthy subjects. wEPT reconstructions calibrated using literature water-content and ex-vivo conductivity values agree with in-vivo H-EPT reconstructions, demonstrating the validity of the empirical wEPT model calibrated on ex-vivo literature data not only for healthy WM (as previously shown), but also for healthy GM.Objective 2: In Figure 2, the good agreement between the T1 to water-content model calibrated using average T1 values among all healthy volunteers in WM, GM and CSF versus the model individually calibrated for each healthy volunteer is shown. This gives confidence in using average measured T1 values among healthy volunteers for this calibration. In Figures 3 and 4, examples of high-resolution conductivity and permittivity maps from wEPT reconstructions are shown for 5 healthy volunteers, and two tumor and two MS patients. These maps also show good EPs contrast between healthy and pathological tissue.
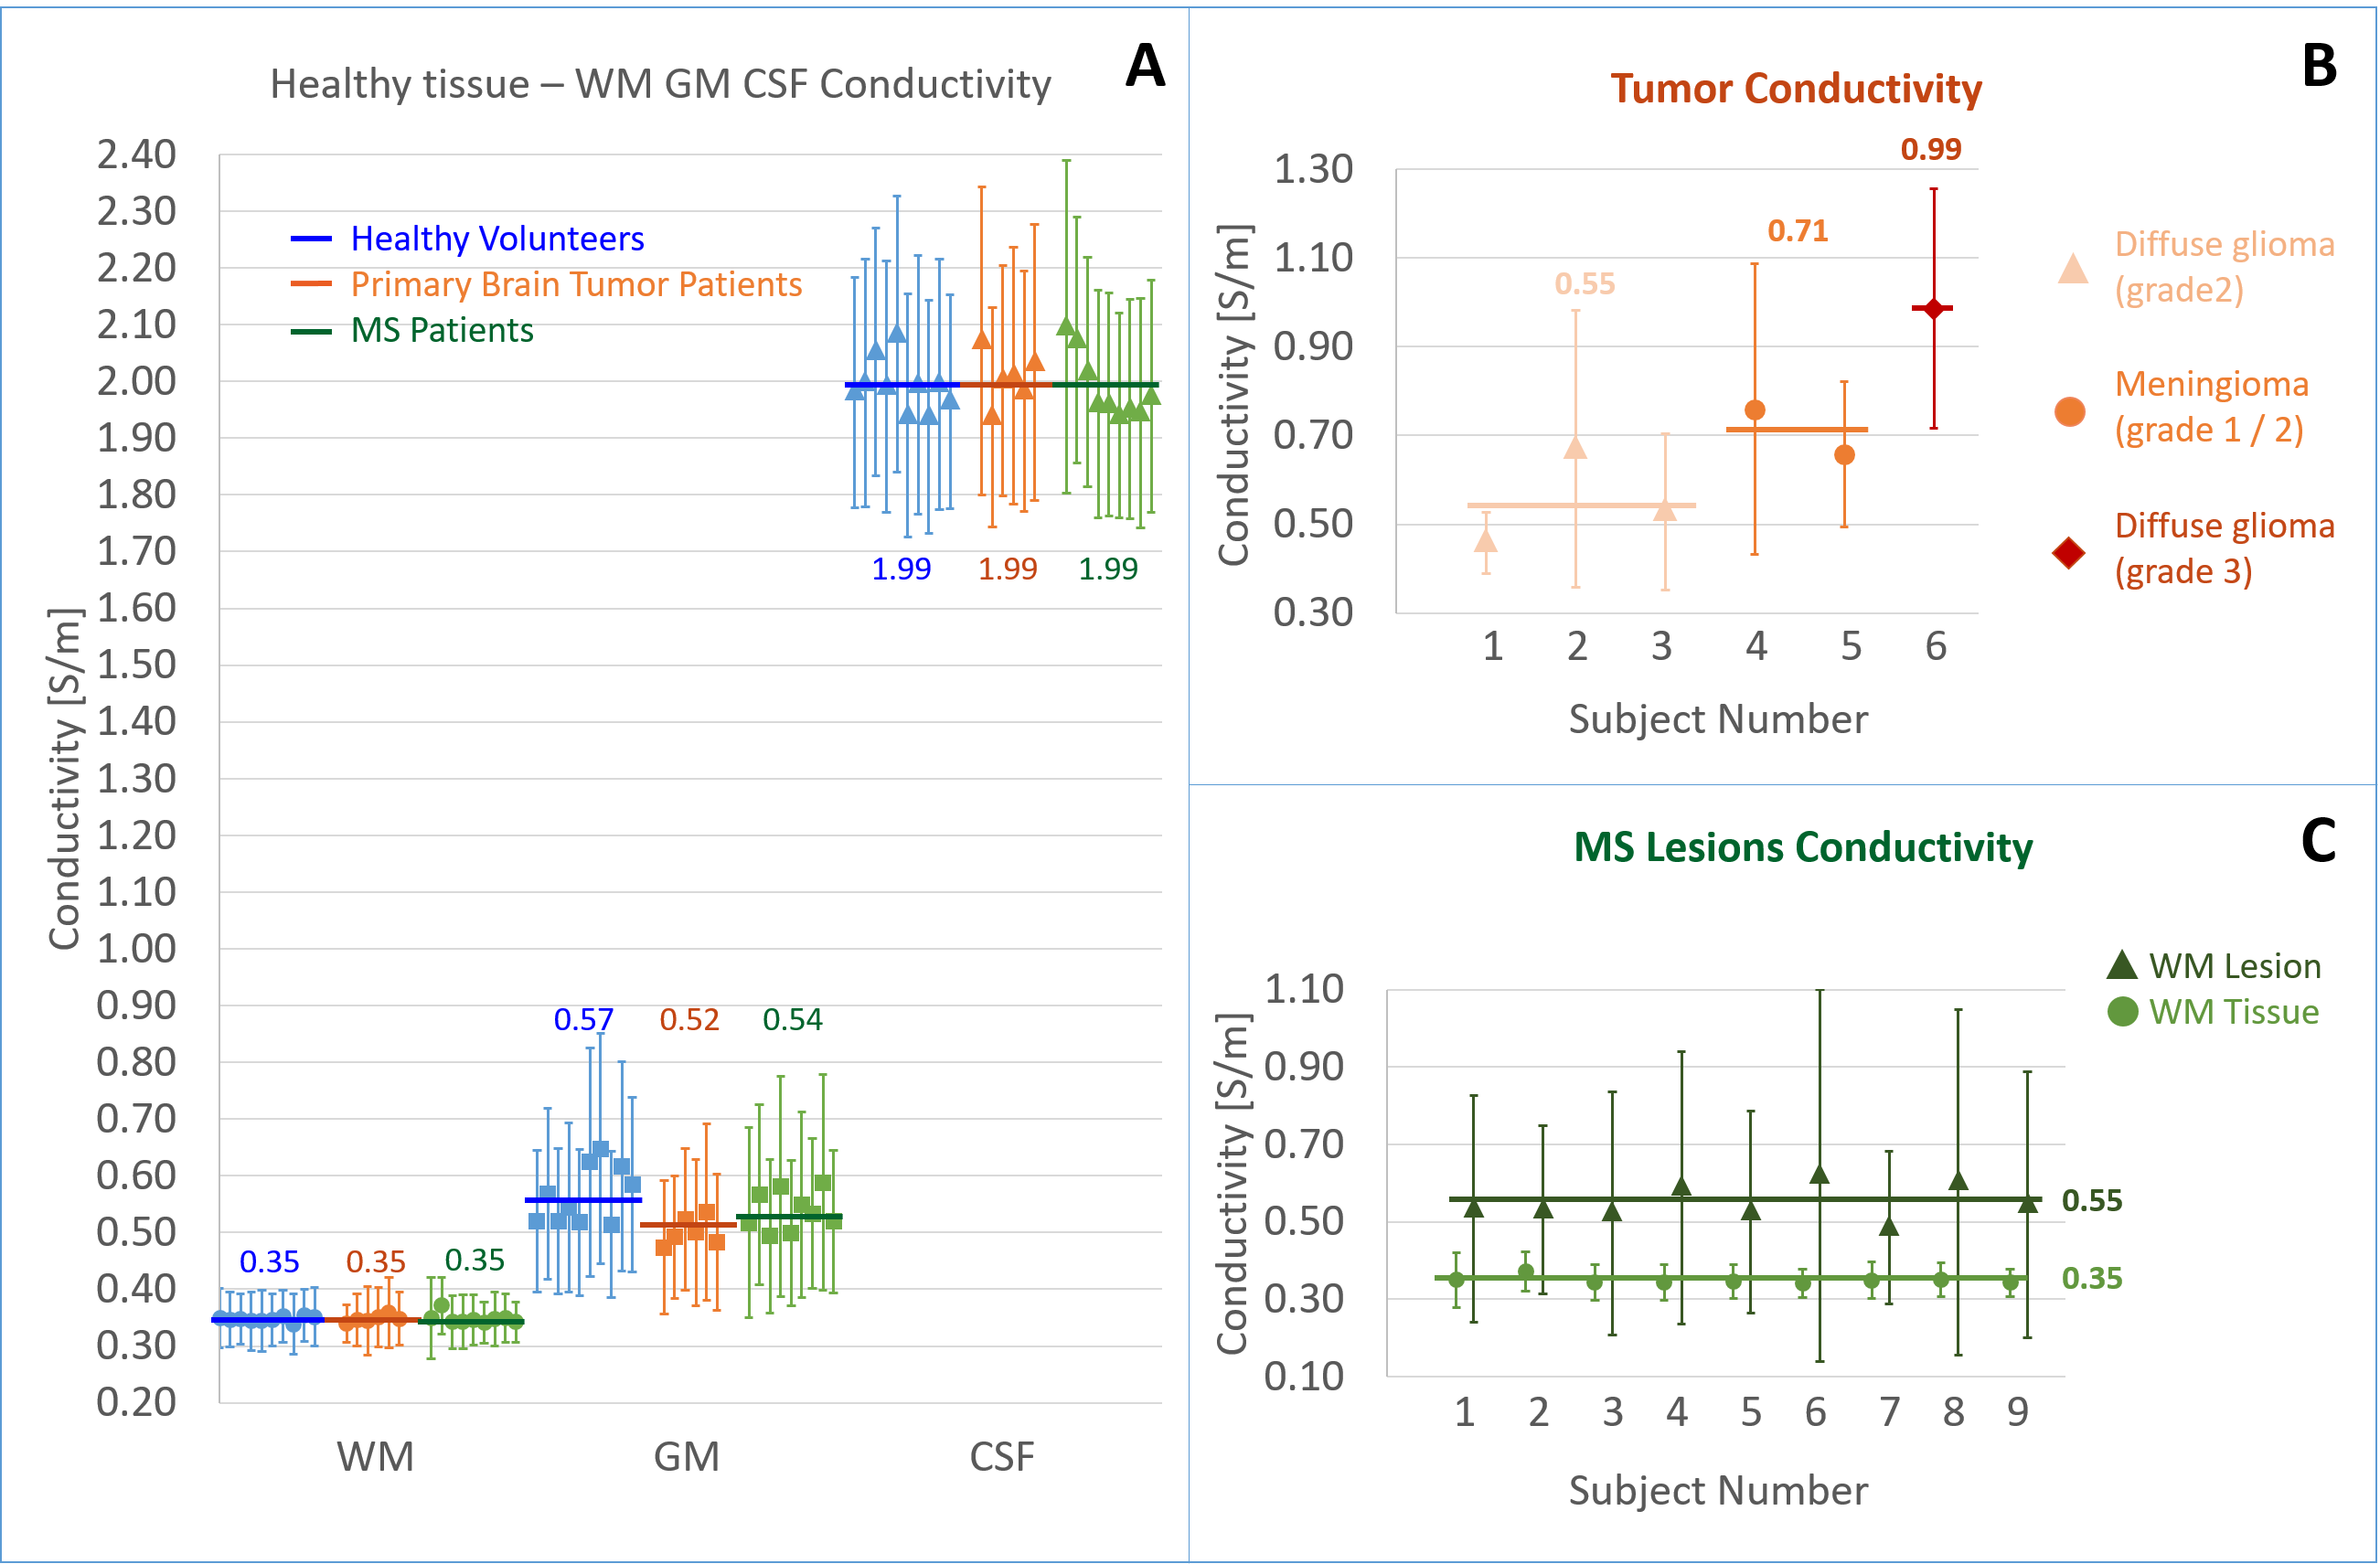
Objective 3: In Figure 5, a quantitative comparison between healthy volunteers and patients is shown. The measured σwEPT in WM, GM, and CSF for healthy volunteers and for the healthy tissue of patients show very good agreement, demonstrating the correspondence of the wEPT model for healthy tissues in patients (part A). For tumors, a conductivity increase is observed (part B), showing a positive correlation with tumor grading (mean conductivity: 0.55 S/m [diffuse glioma grade 2] VS 0.99 S/m [diffuse glioma grade 3]), as observed with H-EPT6. For MS WM lesions a conductivity increase of 57% compared to healthy WM is observed (part C).
Conclusions
The wEPT model is validated for conductivity reconstructions in healthy GM. A conductivity increase is observed in pathologies. For diffuse glioma, a positive correlation between tumor grade and wEPT conductivity is observed, similarly to H-EPT conductivity reconstructions. For MS WM lesions, these initial results show a clear wEPT conductivity increase compared to healthy WM. Permittivity maps show a similar trend but this cannot be independently validated since H-EPT does not allow permittivity reconstructions.Acknowledgements
This work has been financed by the Netherlands Organisation for Scientific Research (NWO): Veni grant number 18078 and Demonstrator grant number 16937.References
1 Michiel E, et al. Electrical Conductivity and Permittivity Maps of Brain Tissues Derived from Water Content Based on T1-Weighted Acquisition. MRM 2017:1094-1103. doi: 10.1002/mrm.26193
2 Cencini M, et al. Fast high-resolution Electric Properties Mapping using three-dimensional MR Fingerprinting based water fraction estimation (MRF-EPT). ISMRM 2022: 567.
3 Mandija S, et al. In-vivo validation of water content Electrical Properties Tomography reconstructions in the white matter using independent MR-EPT measurements. ISMRM 2018: 5096.
4 Kleinloog JPD, et al. Synthetic MRI with Magnetic Resonance Spin TomogrAphy in Time-Domain(MR-STAT): Results from a Prospective Cross-Sectional Clinical Trial. JMRI 2022. doi: 10.1002/jmri.28425
5 Mandija S, et al. Brain tissue conductivity measurements with MR-Electrical Properties Tomography: an in-vivo study. Brain Topography 2021: 56-63. doi: 10.1007/s10548-020-00813-1
6 Katscher U, et al. Noninvasive electrical conductivity measurement by MRI: a test of its validity and the electrical conductivity characteristics of glioma. Eur Radiol 2018: 348-355. doi: 10.1007/s00330-017-4942-5
7 Mandija S, et al. Brain tissue conductivity measurements with MR-Electrical Properties Tomography: An in vivo study. Brain Topography 2021: 56-63. doi: 10.1007/s10548-020-00813-1
Figures