5162
Utilizing MR Elastography to Visualize Higher Harmonic Components of Wave Propagation in Phantoms with Interfaces1Mechanical Engineering, University of Washington, Seattle, WA, United States, 2Mechanical Engineering, University of Wisconsin–Madison, Madison, WI, United States, 3Biomedical Engineering, University of Delaware, Newark, DE, United States, 4Biomedical Engineering and Imaging Institute, Ichan School of Medicine at Mount Sinai, New York City, NY, United States
Synopsis
Keywords: Elastography, Phantoms, Wave Propagation, Biointerface
While MRE can be used to calculate mechanical properties of tissue, bio-interfaces can cause distortions in the shear-wave propagation patterns which are difficult to account for with current MRE techniques. Therefore, we utilized three specialized MRE sequences to visualize the first three harmonics of wave propagation in phantoms with simulated bio-interfaces. We were able to measure the doubling and tripling of wave number in the phantoms excited at the fundamental vibration frequency using this optimized MRE protocol. We characterized differences in wave propagation at higher harmonics along phantom interfaces, and observed substantial differences in wave characteristics based on adhesion level.Introduction
Most tissues consist of multiple layers, membranes, and abnormalities such as tumors, all of which interact through bio-interfaces. Techniques such as MR Elastography (MRE)1 are meant to calculate homogenized properties such as compliance and loss factors of biomaterials in vivo but fail to predict the essential mechanics of and around bio-interfaces due to distortions in the shear-wave propagation patterns. Therefore, developing more accurate models for wave propagation near bio-interfaces (especially low-adhesion interfaces) would be of prime importance for mechanical parameter estimation. Additionally, using more complex analysis techniques of wave propagation, such as investigating the reflection and refraction of higher harmonics of applied waves, could allow us to create metrics for adhesion in-vivo (e.g., tumor tissue interface)2. In this study, we therefore used phantom models with interfaces of various adhesion levels, along with specialized MRE sequences, to visualize wave propagation of the first, second, and third harmonic of applied vibration to investigate changes in wave propagation.Methods
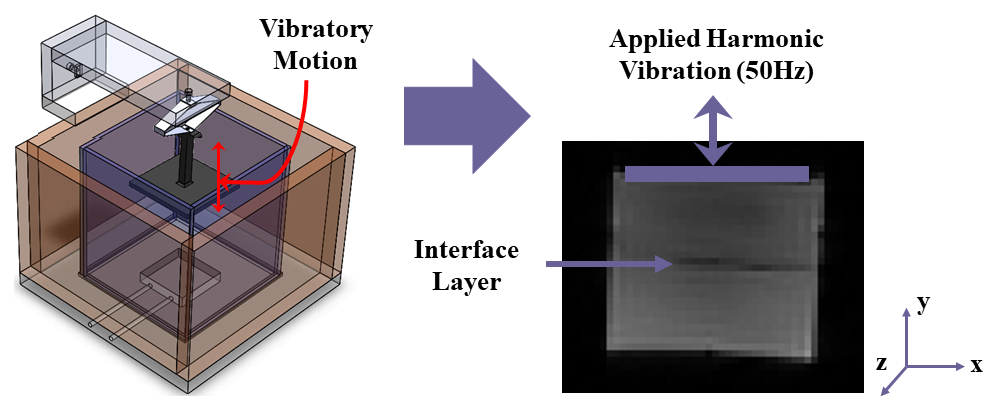
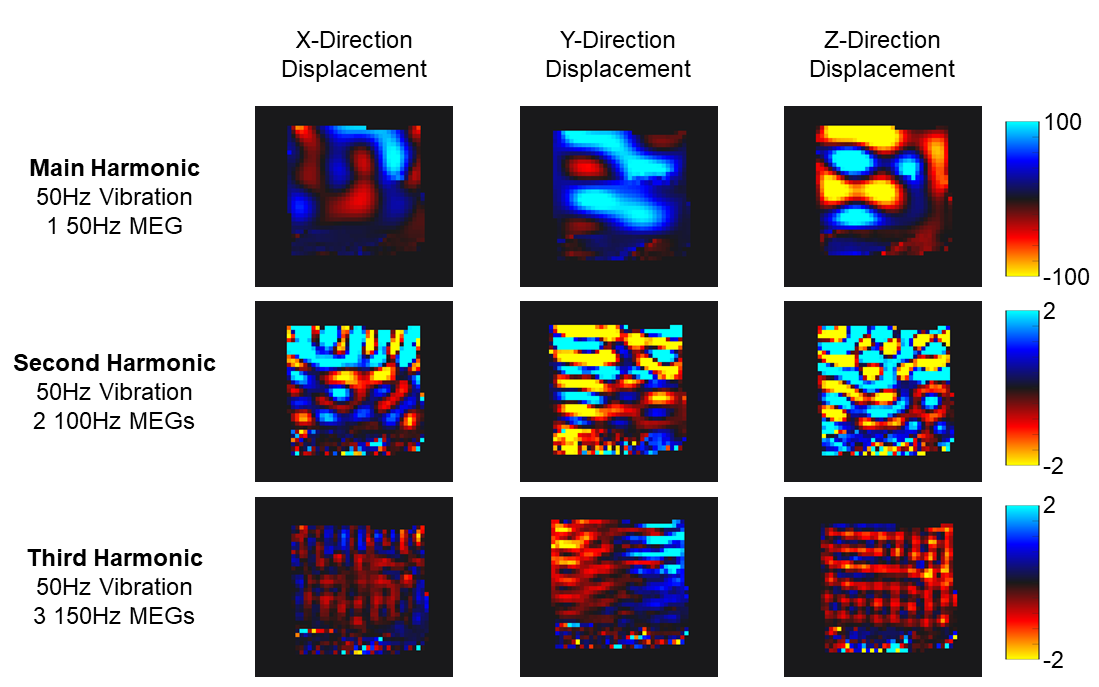
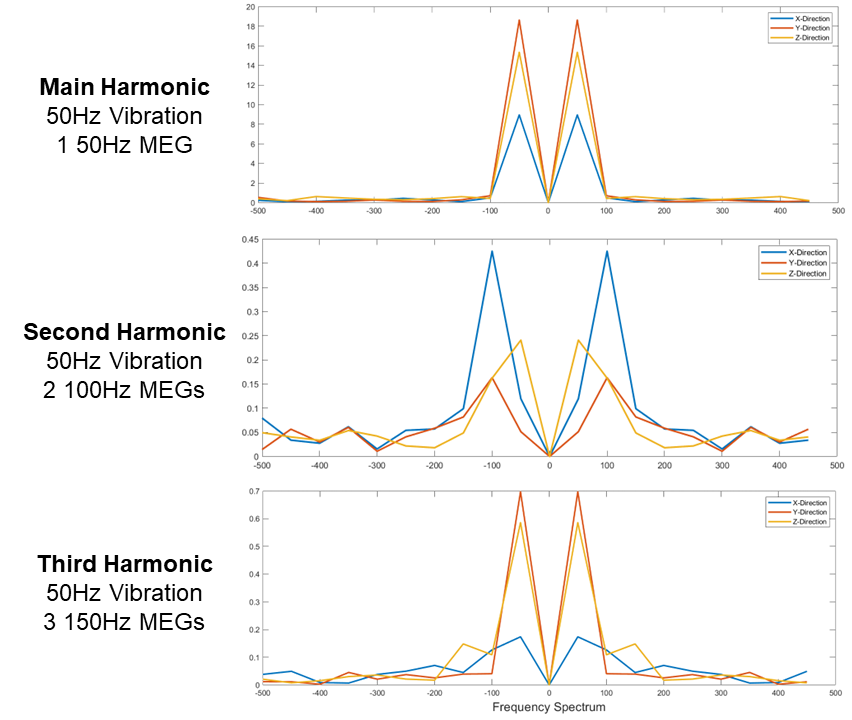
Using Knox gelatin, three different 3.5% w/w phantom configurations were made in 4in. cube containers. The first configuration was a single solid block that was allowed to cure in a 4oC refrigerator overnight. For the two layered configurations, two of the 4in. cube containers were filled halfway with the liquid phantom mixture before being cured. These phantoms were then stacked on top of each other, one after being pat dry (to create a sticky interface) and the other with oil added between the layers (to create a slippery interface). MRE3 was then performed on these phantoms using a Siemens 3T Prisma MRI scanner with a 48-channel head coil (Siemens Healthineers), and a custom piezoelectric actuator4,5 with 50 Hz mechanical vibration applied perpendicular to the layer boundary (Figure 1). Three custom MRE sequences were used, all with 2.5 mm isotropic resolution, 20 phase offsets, GRAPPA 3, TR 6720 ms, TE 69 ms, and encoding frequency 50 Hz.The first sequence was used to capture the main harmonic of vibration (50 Hz, as applied by the mechanical actuator) over one period in all three orthogonal directions, while the second and third were used to capture the second harmonic of vibration over two periods (100 Hz) and third harmonic of vibration over three periods (150 Hz) respectively. This was accomplished, despite not changing the mechanical vibration frequency, by using an encoding frequency of 50 Hz but a fractional encoding factor of 0.5 (or 0.35 for third harmonic) with 2 encoding gradients (or 3 for third harmonic) such that a full 50 Hz period could be captured, but this period would be encoded with two (or three) abutting 100 Hz (or 150 Hz) encoding gradients. In doing this, we maximize sensitivity of the encoding to 100Hz or 150Hz while keeping phase offsets the same. We then visualize both the spatial wavelength of vibration in all three of our phantoms at the first, second, and third harmonic (Figure 2), as well as the temporal frequency response in all cases (Figure 3).
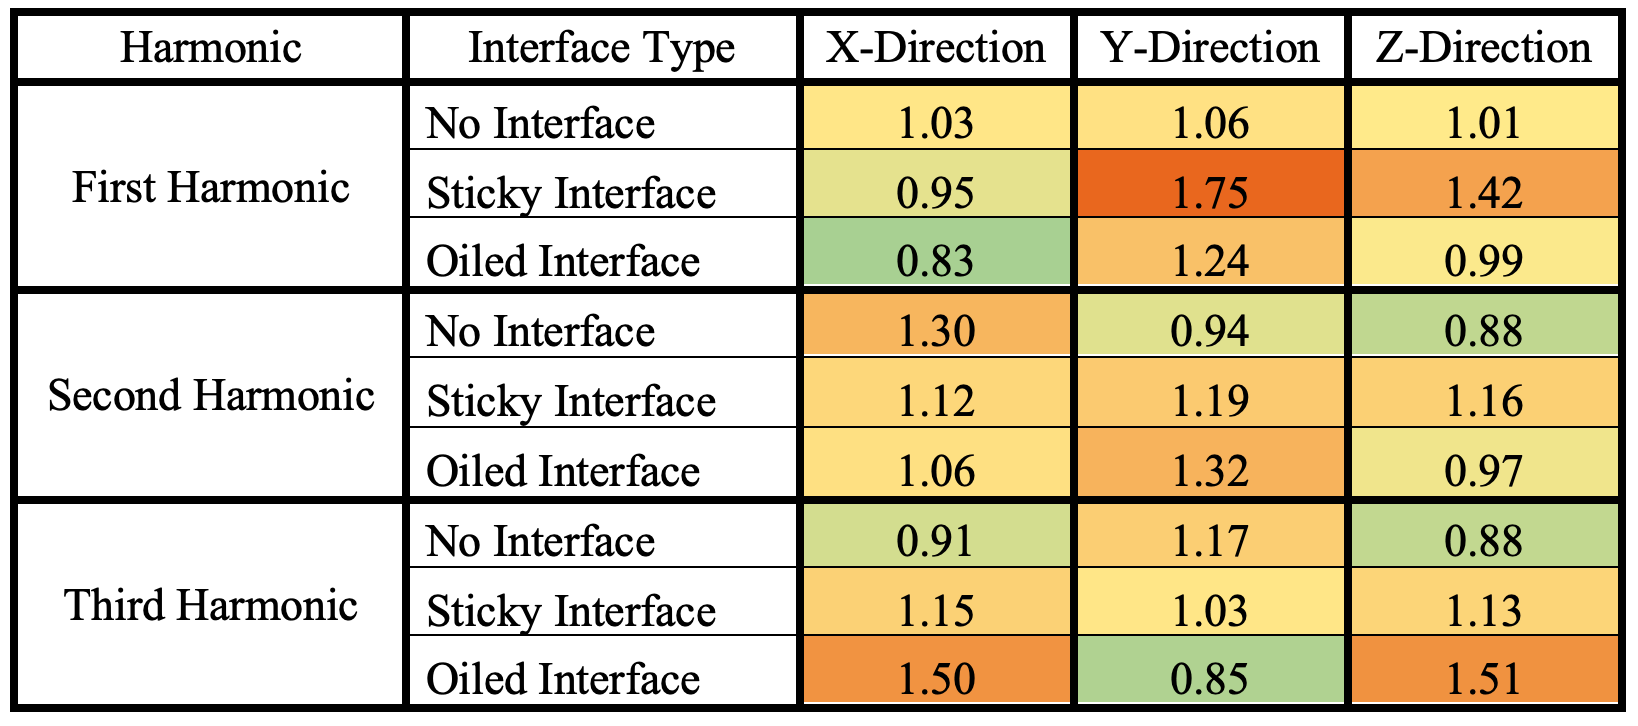
To determine the effect of boundary conditions on wave propagation, we investigated a region of interest above and a region below the boundary (or just one region at the top of the phantom and one region below for the case with no interface) by taking the average amplitude of the frequency response both locations. We then took the ratio of top region amplitude to bottom region amplitude to determine any differences in wave transmission for the given harmonics (Table 1).
Results
We were able to measure the doubling and tripling of wave number in the phantoms excited at the fundamental vibration frequency using this optimized MRE protocol (Figure 2). From the frequency response plots, the main component is the first harmonic in our first sequence, while for the second sequence, the main component is the second harmonic; in the third sequence, while the main component is the first harmonic (likely due to spectral leakage), the third harmonic component is amplified over all other components (Figure 3). There are also trends of either increased or decreased wave amplitude on either side of the interface based on adhesion level and harmonic (Table 1). For instance, oiled and sticky interfaces have 38% and 14% more third harmonic wave propagation compared respectively to the no interface phantom (in the direction of wave propagation).Discussion
In the future, we plan to further analyze this data and attempt to by investigating transmission and reflection coefficients of shear-horizontal wave scattering in each encoding direction. As demonstrated here, we observed an increased level of higher harmonics in phantoms with lower adhesion levels, which implies that we can potentially use these wave propagation characteristics to quantify the level of adhesion in phantoms and tissues. We also have plans to create 3-D printed phantoms with well-defined boundary conditions to further investigate this topic and create a pipeline for determining boundary conditions using MRE.Conclusion
By altering MRE parameters to encode multiple periods of the higher harmonics of a single applied mechanical vibration frequency, we can analyze wave propagation of these higher harmonic components to identify boundary layers and potentially boundary mechanical properties.Acknowledgements
The authors would like to acknowledge Dr. John Pyles (University of Washington) for providing technical support, and funding support NSF1826270.References
1. Greenleaf, J. F. et al. Direct Visualization of Strain Waves by Magnetic Resonance Elastography (MRE). in IEEE Ultrasonics Symposium 467–472 (1996).
2. Hamhaber, U. et al. Three-dimensional analysis of shear wave propagation observed by in vivo magnetic resonance elastography of the brain. Acta Biomater. 3, 127–137 (2007).
3. Johnson, C. L. et al. Magnetic resonance elastography of the brain using multi-shot spiral readouts with self-navigated motion correction. Magn. Reson. Med. 70, 404–412 (2013).
4. Ozkaya, E. et al. Brain-mimicking phantom for biomechanical validation of motion sensitive MR imaging techniques. J. Mech. Behav. Biomed. Mater. 122, 104680 (2021).
5. Triolo, E. R. et al. Design, Construction, and Implementation of a Magnetic Resonance Elastography Actuator for Research Purposes. Curr. Protoc. 2, 1–26 (2022).
Figures