5160
Repeatability of multifrequency MR elastography in pancreatic ductal adenocarcinoma patients and healthy volunteers1Radiology and Nuclear Medicine, Amsterdam University Medical Centers, Amsterdam, Netherlands, 2Imaging and Biomarkers, Cancer Center Amsterdam, Amsterdam, Netherlands, 3Medical Oncology, Amsterdam University Medical Centers, Amsterdam, Netherlands
Synopsis
Keywords: Elastography, Pancreas
MR elastography (MRE) could be useful as an imaging biomarker in pancreatic cancer. To this end, pancreatic MRE parameters should be repeatable and be able to differentiate between healthy and tumour tissue. In this study, 10 patients with pancreatic ductal adenocarcinoma and 8 sex- and age-matched healthy volunteers underwent three MRE scans in a test-retest set-up. Results showed that MRE parameters were repeatable in patients and healthy volunteers. Furthermore, a significant increase in shear wave speed was found in pancreatic tumours compared to healthy pancreatic tissue.Introduction
MR elastography (MRE) is an MRI technique that is able to non-invasively quantify viscoelastic properties of tissues, including differentiation of different pancreatic pathologies based on stiffness1-3. Stiff stromal tissue present in pancreatic ductal adenocarcinoma (PDAC) is thought to influence chemotherapy efficacy4; for PDAC patients an imaging biomarker which is able to predict chemotherapy efficacy before start of chemotherapy would be extremely valuable. To be useful as an imaging biomarker, pancreatic MRE parameters should be repeatable and be able to differentiate between tumours and healthy tissue. In this study, pancreatic MRE was performed in a test-retest setting on PDAC patients and sex- and age-matched healthy volunteers.Method
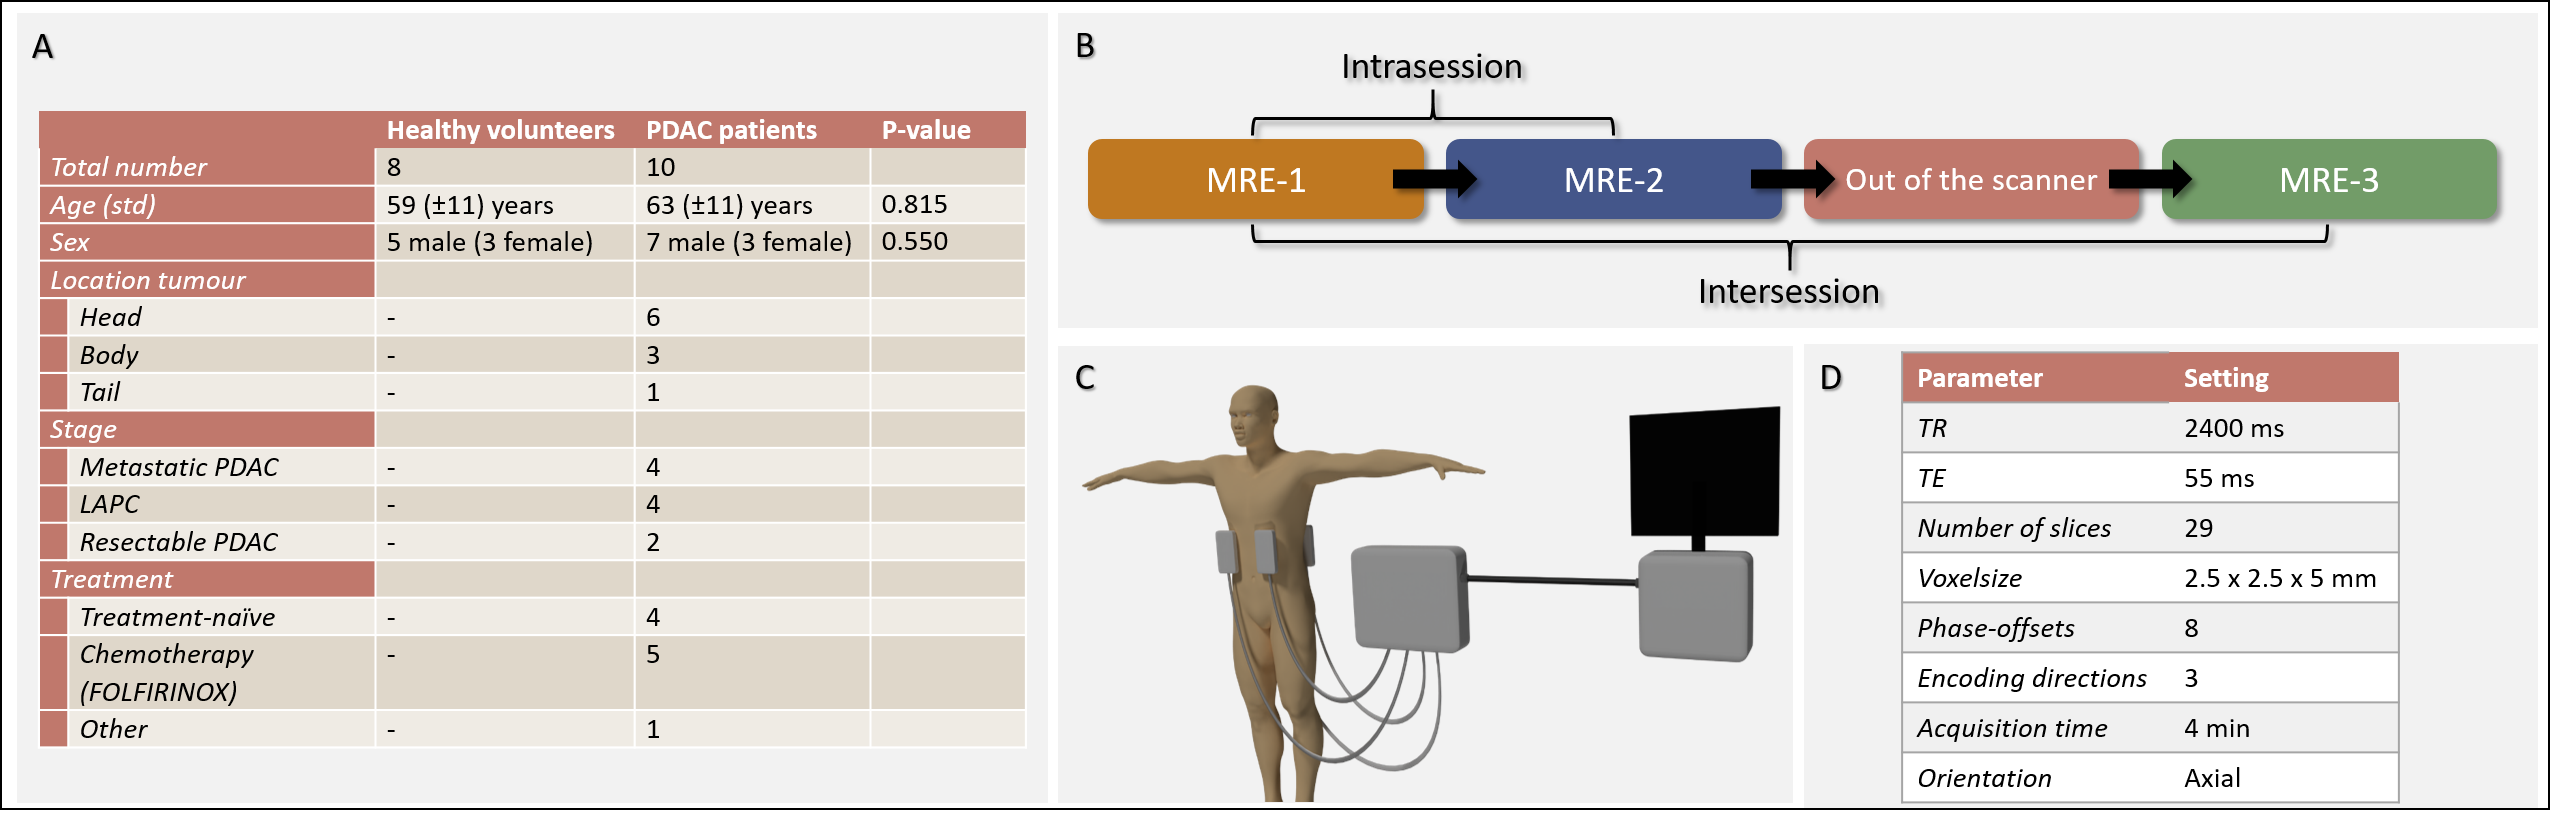
Participants and MRI protocol:Following informed consent, 10 PDAC patients and 8 sex- and age-matched healthy volunteers were included from December 2021 to November 2022. All participants fasted four hours prior to scanning. Three multi-slice, multi-frequency spin-echo echoplanar imaging (SE-EPI) MRE scans were performed in free-breathing on a 3.0T MRI scanner (Ingenia, Philips, Best, the Netherlands) following a test-retest setting (Figure 1B). Mechanical vibrations at multiple frequencies (30/40/50/60Hz) were introduced in the body using four pneumatic drivers: two placed posterior at the mid-scapular line and two anterior at the mid-clavicular line at the height of the xiphoid process (Figure 1C). MRE acquisition settings can be found in Figure 1D.
MRE post-processing:
The MRE data was processed offline using the kMDEV inversion algorithm resulting in a shear wave speed map (SWS in m/s) and attenuation map (a in m/s)5. The pancreatic tumour and healthy pancreas were manually delineated by a radiologist with 28 years of experience on mean magnitude MRE images (mean over all phase-offsets, MEG directions, frequencies). Previously performed CT scans (for PDAC patients) and anatomical MRI scans made during this study (for all participants) were used for guidance during delineation. The delineation was used to calculate the mean and standard deviation of SWS and a in the organ of interest.
Statistics:
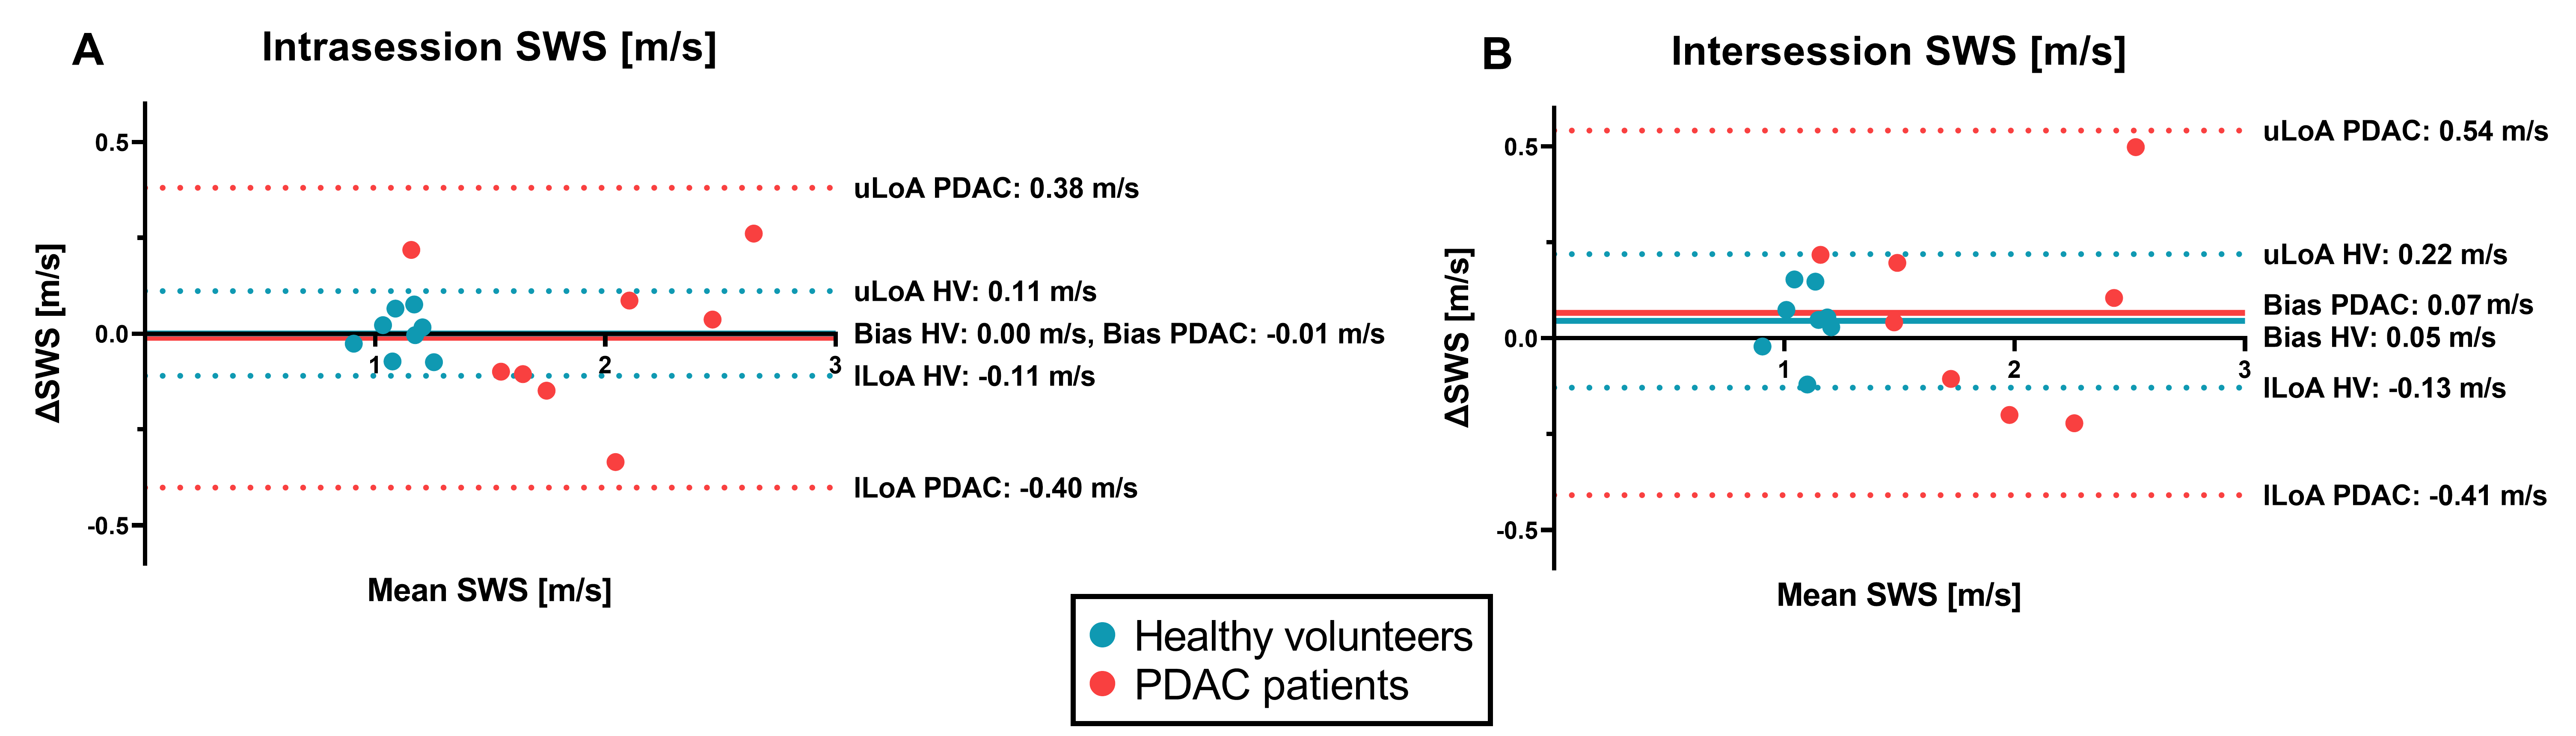
Data were tested for normality using the Shapiro-Wilk test. To determine the inter- and intrasession repeatability (see Figure 1B for definitions) of SWS and a, one-way repeated measures ANOVA and pairwise comparison with Bonferroni correction was performed for patients and healthy volunteers separately. Data were visualized using boxplots and Bland-Altman plots and the bias and 95% limits-of-agreement (LoA) were defined. Intra- and intersession coefficients of variation (CV) were calculated by dividing the standard deviation of the differences between the measurements by the mean over the measurements. A Mann Whitney U test or unpaired t-test, depending on normality, was used to determine if there were significant differences in SWS and a between healthy pancreatic tissue and tumour tissue. For all statistical tests a significance level of 0.05 was used.
Image analysis, delineation and statistical analysis were respectively performed in Matlab (R2021b, Mathworks, Natick, MA, USA), ITK-snap (v3.8.0)6, Rstudio (v4.0.3, PBC, Boston, MA, USA) and GraphPad Prism (v9.4.1, San Diego, CA, USA).
Results
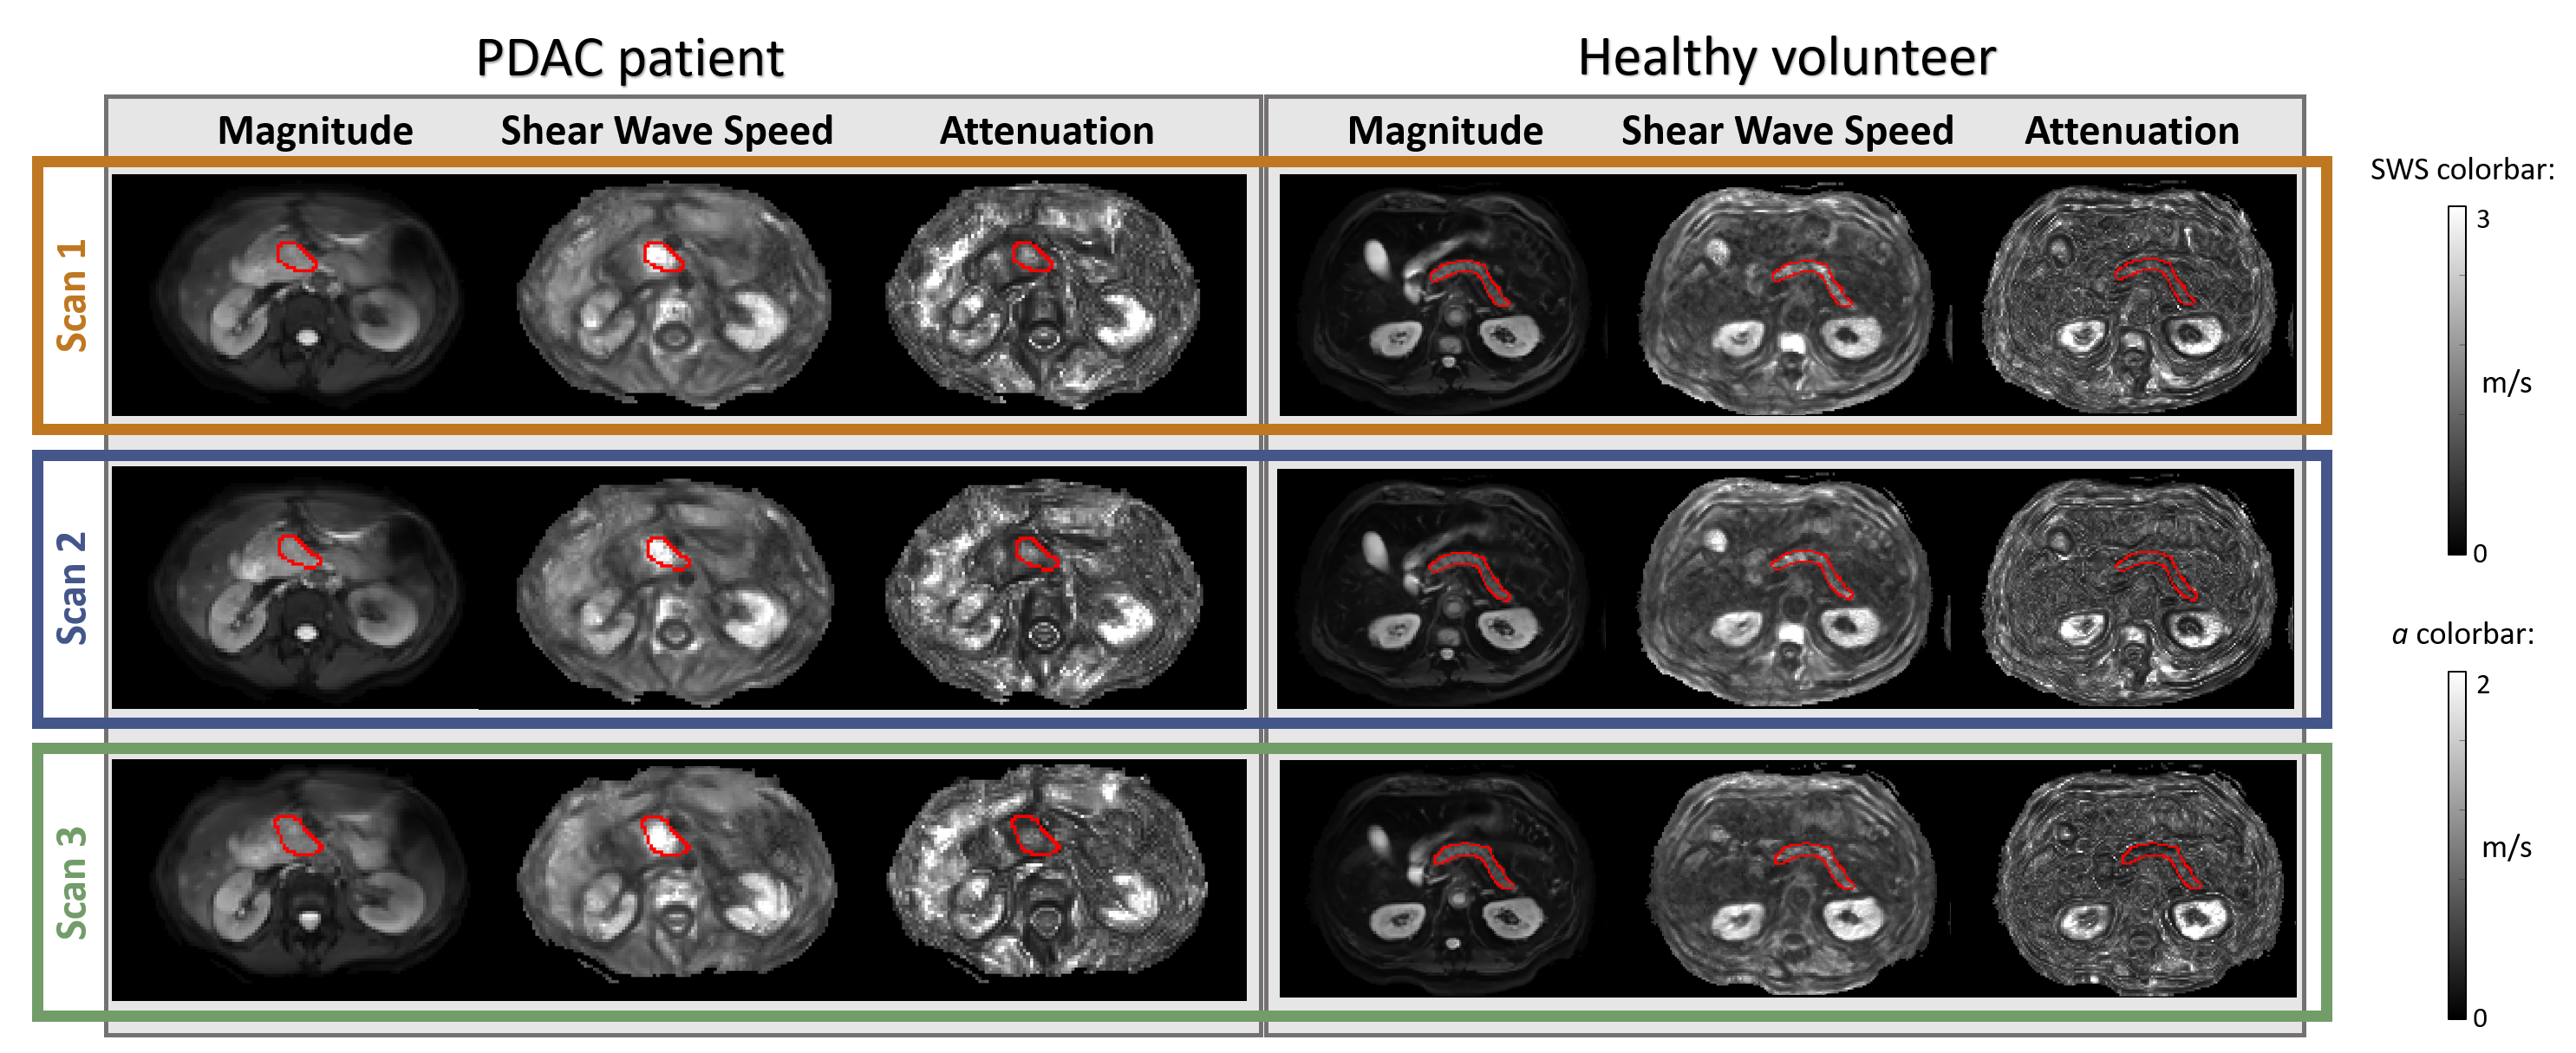
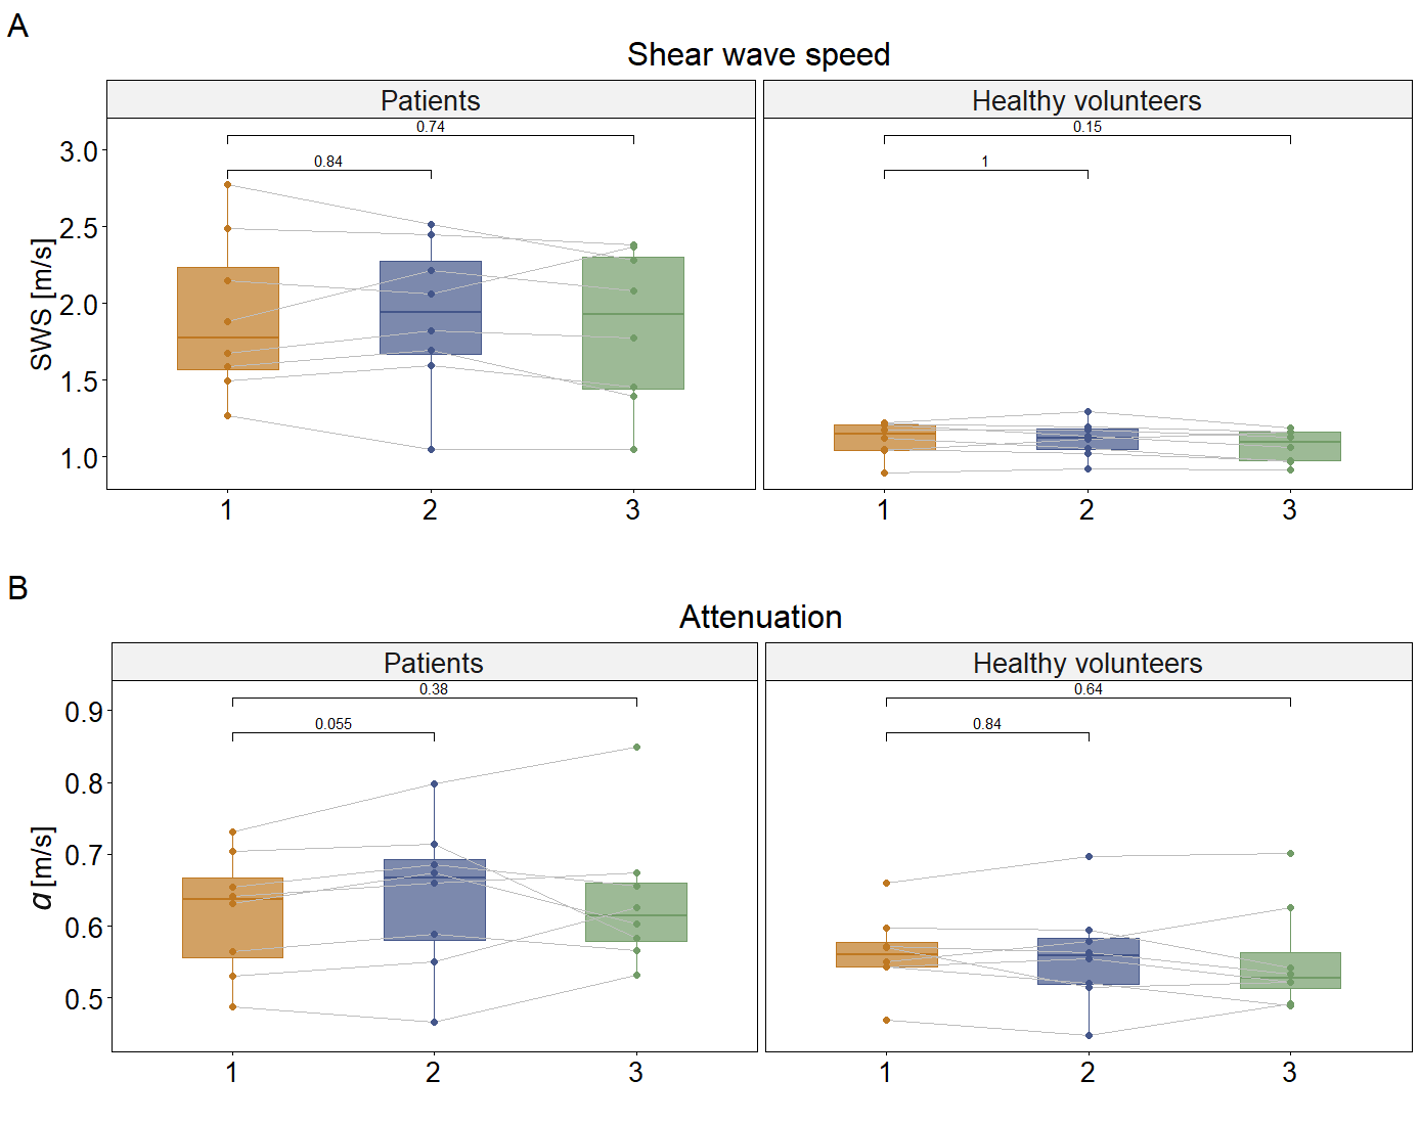
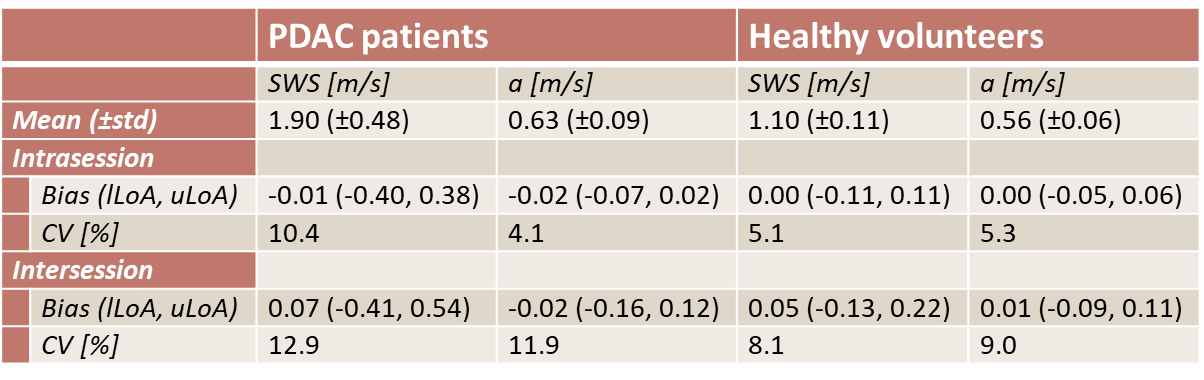
In total, 10 patients and 8 healthy volunteers were included, see Figure 1A for participant characteristics. After visual MRE quality assessment, two patients were excluded because of low quality MRE scans. Example MRE scans of a patient and healthy volunteer can be seen in Figure 2.All data were normally distributed. SWS and a did not differ between the three MRE scans for patients (SWS: F(2,14)=0.63, p=0.55; a: F(1.19,8.3)=0.67, p=0.46) and healthy volunteers (SWS: F(2,14)=2.4, p=0.13; a: F(2,14)=0.25, p=0.79). Pairwise comparison with Bonferroni correction showed no differences in SWS and a between the three MRE scans for both patients and healthy volunteers, see Figure 3. Figure 4 shows Bland-Altman plots for intra- and intersession repeatability of SWS in PDAC and healthy pancreatic tissue. In table 1, the mean (±standard deviation), bias, lower- and upper-LoA and CV are given. Unpaired t-test showed a significant difference between patients and healthy volunteers for SWS (p<0.001), but not for a (p=0.08).
Discussion
Repeated measures ANOVA test and pairwise comparison showed that SWS and a are repeatable for PDAC patients and healthy volunteers. Intra- and intersession CV for SWS and a in both patients and healthy volunteers are comparable with literature1,7. As expected, the intersession CV increased compared to the intrasession CV.This study also showed that the SWS is significantly higher in PDAC compared to healthy pancreatic tissue. This is in line with previous literature1. The range of SWS measurements in PDAC patients is larger compared to the range of the healthy pancreas. Treatment with chemotherapy or stage of the tumour could potentially have influence on the stiffness of the tumour. No significant difference was found in a between PDAC and healthy pancreatic tissue.
Two patients were excluded from the analysis because of low MRE quality. Low image quality could be explained by a high body mass index (>27). This is a drawback of the MRE technique.
Conclusion
This study showed that SWS and a measured with multi-frequency MRE are repeatable for PDAC patients and healthy volunteers. Furthermore, SWS is significantly higher in PDAC tissue compared to healthy pancreatic tissue. No significant different in a was found between PDAC tissue and healthy pancreatic tissue.Acknowledgements
No acknowledgement found.References
1. S. R. Marticorena Garcia et al., “Tomoelastography for Measurement of Tumor Volume Related to Tissue Stiffness in Pancreatic Ductal Adenocarcinomas,” Invest. Radiol., vol. 55, no. 12, pp. 769–774, 2020.
2. Y. Shi et al., “Differentiation of benign and malignant solid pancreatic masses using magnetic resonance elastography with spin-echo echo planar imaging and three-dimensional inversion reconstruction: a prospective study,” Eur. Radiol., vol. 28, no. 3, pp. 936–945, 2018.
3. Y. Liu et al., “Differentiation of pancreatic ductal adenocarcinoma from inflammatory mass: added value of magnetic resonance elastography,” Clin. Radiol., vol. 73, no. 10, pp. 865–872, 2018.
4. A. J. Rice et al., “Matrix stiffness induces epithelial-mesenchymal transition and promotes chemoresistance in pancreatic cancer cells.,” Oncogenesis, vol. 6, no. 7, p. e352, 2017.
5. H. Tzschätzsch et al., “Tomoelastography by multifrequency wave number recovery from time-harmonic propagating shear waves,” Med. Image Anal., vol. 30, pp. 1–10, 2016.
6. P. A. Yushkevich et al., “User-guided 3D active contour segmentation of anatomical structures: Significantly improved efficiency and reliability,” Neuroimage, vol. 31, no. 3, pp. 1116–1128, 2006.
7. Y. Shi et al., “Feasibility of using 3D MR elastography to determine pancreatic stiffness in healthy volunteers,” J. Magn. Reson. Imaging, vol. 41, no. 2, pp. 369–375, 2015.
Figures