5156
Intrinsic MR elastography for classification of focal liver lesions using normalized viscoelastic parameters: a pilot study1Département du génie mécanique, Université de Sherbrooke, Sherbrooke, QC, Canada, 2Centre de recherche du Centre hospitalier de l'Université de Montréal (CRCHUM), Montréal, QC, Canada, 3Department of Radiology, Radiation Oncology and Nuclear Medicine, Université de Montréal, Montréal, QC, Canada, 4Philips Healthcare, Mississauga, ON, Canada, 5Centre Hospitalier de l’Université de Montréal (CHUM), Montréal, QC, Canada, 6Service of Pathology, Centre Hospitalier de l’Université de Montréal (CHUM), Montréal, QC, Canada, 7Institute of Biomedical Engineering, Université de Montréal, Montréal, QC, Canada, 8Laboratory of Biorheology and Medical Ultrasonics(LBUM), Centre de recherche du Centre hospitalier de l’Université de Montréal (CRCHUM), Montréal, QC, Canada, 9Centre de recherche du Centre hospitalier de l'Université de Sherbrooke (CRCHUS), Sherbrooke, QC, Canada
Synopsis
Keywords: Elastography, Elastography, Intrinsic magnetic resonance elastography, Cancer
Intrinsic activation MR elastography (iMRE) method has been applied to a cohort of patients undergoing liver MRI for assessment of focal liver lesions. We used segmentation, masking, and normalization of viscoelastic parameters to investigate the capability of this method to differentiate benign and malignant liver lesions. The normalized storage modulus (G') computed by nonlinear inversion-iMRE showed significant differences between benign and malignant lesions.Parameters
G' = Storage modulusG" = Loss modulus
|G*| = Magnitude of the complex valued shear modulus
Abbreviations
NLI-iMRE = Nonlinear inversion-intrinsic magnetic resonance elastographyROC = Receiver operating characteristic
AUC = Area under the ROC curve
LR = LI-RADS
Introduction
MR elastography tissue displacements are usually induced by externally applied steady-state vibration at frequencies of 30-100 Hz.1-3 However, cardiovascular pulsation can be used as an intrinsic source for tissue motion, eliminating the need for external actuation. In this case, calculated mechanical properties are at physiological frequencies (≈1 Hz). The use of intrinsic MRE (iMRE) has been previously proposed in the brain 4 and liver.5, 6 Viscoelastic mechanical property images can be generated over a range of frequencies through subzone-based nonlinear inversion (NLI) elastography.7 The purpose of this study was to assess the classification accuracy of NLI-iMRE-determined viscoelastic parameters for differentiating benign and malignant liver lesions.Method
This prospective, institutional review board-approved study included consecutive adult patients undergoing clinical MRI for characterization of liver lesions as part of their clinical standard of care. A 4D quantitative flow sequence with retrospective cardiac was used to measure the 3D displacement field at 8 phases of the cardiac cycle. Low-frequency, complex-valued harmonic motions at the cardiac pulse frequency were determined via Fourier transform, and the subzone-based NLI-iMRE reconstruction method was applied to determine the viscoelastic parameters within the imaging volume.8 Normalized values for the shear storage and loss moduli, G’ and G’’, respectively, and their magnitude, |G*|, were computed using the corresponding values from the spleen. Manual segmentation of the liver, blood vessels, lesions, and spleen were performed by an abdominal radiology fellow. Blood vessels and bile ducts were excluded from the NLI-iMRE image reconstruction volume to avoid artifacts due to phase wrapped fluid motion in these regions. McGarry et al. have shown that viscoelastic inversion becomes non-unique at low, physiological frequencies.9 Viscoelastic parameters were calculated for both the liver and the spleen. The resulting liver parameters were then normalized by the mean property values of the spleen to ensure comparable, normalized viscoelastic parameter distributions within the lesion. The reference standard to identify lesion type was the interpretation of the full clinical MRI or histopathology report. Figures 1 and 2 respectively show examples of benign and malignant lesions. The statistical comparison of benign and malignant lesions was determined by unpaired t-tests and by receiver operating characteristic (ROC) curves, computed using the GraphPad Prism 9 software.Results
Fifty-two patients were examined using viscoelastic iMRE. After the exclusion of cases where the spleen or tumor was not visible (n = 20), 32 lesions were assessed. The cohort included 17 benign lesions (5 hemangiomas, 5 focal nodular hyperplasias [FNH], 1 adenoma, 1 cholelithiasis, and 5 LI-RADS [LR]-3) and 15 malignant lesions (3 LR-4, 5 LR-5, 6 metastases and one pathology-proven hepatocellular carcinoma [HCC]). Figure 3 shows the comparison of the individual lesion groups (benign: hemangioma, FNH, adenoma, cholelithiasis, and LR-3), (malignant: LR-4, LR-5, metastasis, and HCC). The boxplot shows the normalized G', G" and |G*| values for the different lesions. The companion table shows the results of t-tests performed on the three normalized parameter measurements for the different lesion types. Significant differences were observed between LR-4 and hemangiomas (p = 0.01) and LR-4 and FNH (p = 0.0129). Figure 4 shows the normalized viscoelastic parameters for lesions dichotomized as benign or malignant. The normalized G' was significantly higher in malignant lesions compared to benign lesions (respectively: 3.90 ± 0.87 vs. 1.23 ± 0.19, p = 0.0045). The normalized G’’ was similar between malignant and benign lesions (respectively: 0.23 ± 0.4 vs. 0.19 ± 0.3, p = 0.4495). The normalized |G*| was similar between malignant and benign lesions (respectively: 1.43 ± 0.14 vs. 1.04 ± 0.20, p = 0.1211). Figure 5 shows the ROC curves of the three normalized parameters, G', G" and |G*|. The area under the ROC curves differentiating benign and malignant lesions were respectively 0.89 for G’, 0.57 for G’’, and 0.71 for |G*|.Discussion
NLI-iMRE revealed significantly higher normalized G' in malignant versus benign liver lesions. These results obtained at ~1 Hz, without any external transducer, are in agreement with prior results reported by Hennedige et al.10 using extrinsic MRE for differentiation of malignant and benign lesions using G’. In this study, the normalized G'' has not shown a meaningful trend for different types of lesions. This is in contrast with the study by Garteiser et al.2, which revealed higher G'' in malignant lesions using extrinsic activation MRE at 50 Hz, which invokes a much different damping regime than the low frequency iMRE results presented here. G' represents the shear stiffness of a material. Increasing stiffness levels within malignant lesions is an observed phenomenon that can be attributed to a high mitosis rate, leading to a high nucleus-to-cytoplasm ratio and increased actin cytoskeleton, and thus increased cell rigidity.Conclusion
We demonstrated the feasibility of NLI-iMRE for the assessment of normalized viscoelastic parameters for various benign and malignant liver lesions. Overall, this intrinsic MRE method shows promise for the characterization of liver lesions and differentiating benign vs. malignant lesions using the normalized G'.Acknowledgements
This work was funded by an Onco-Tech grant from the Fonds de recherche du Québec en Santé. Dr. An Tang was supported by a Senior Clinical Research Fellowship Award by Fonds de recherche du Québec en Santé and Fondation de l'association des radiologistes du Québec (FRQS-ARQ #298509).References
1. M. Shahryari, H. Tzschätzsch, J. Guo, S. R. Marticorena Garcia, G. Böning, U. Fehrenbach, L. Stencel, P. Asbach, B. Hamm and J. A. Käs, Cancer Research 79 (22), 5704-5710 (2019).
2. P. Garteiser, S. Doblas, J.-L. Daire, M. Wagner, H. Leitao, V. Vilgrain, R. Sinkus and B. E. Van Beers, European radiology 22 (10), 2169-2177 (2012).
3. S. K. Venkatesh, M. Yin, J. F. Glockner, N. Takahashi, P. A. Araoz, J. A. Talwalkar and R. L. Ehman, AJR. American journal of roentgenology 190 (6), 1534 (2008).
4. J. B. Weaver, A. J. Pattison, M. D. McGarry, I. M. Perreard, J. G. Swienckowski, C. J. Eskey, S. S. Lollis and K. D. Paulsen, Physics in Medicine & Biology 57 (22), 7275 (2012).
5. T. Lefebvre, L. Petitclerc, M. Hébert, L. Bilodeau, G. Sebastiani, D. Olivié, Z. H. Gao, M. P. Sylvestre, G. Cloutier and B. N. Nguyen, Journal of Magnetic Resonance Imaging 51 (5), 1570-1580 (2020).
6. Van Houten, E., et al. "Actuator-Free MR Elastography of the Liver: Imaging Liver Tumors with Viscoelastic Intrinsic MRE.
7. E. E. Van Houten, M. M. Doyley, F. E. Kennedy, K. D. Paulsen and J. B. Weaver, IEEE transactions on medical imaging 24 (3), 311-324 (2005).
8. S. W. Gordon-Wylie, L. M. Solamen, M. D. McGarry, W. Zeng, E. VanHouten, G. Gilbert, J. B. Weaver and K. D. Paulsen, Journal of Magnetic Resonance 296, 112-120 (2018).
9. M. McGarry, E. Van Houten, L. Solamen, S. Gordon-Wylie, J. Weaver and K. Paulsen, Physics in Medicine & Biology 64 (7), 075006 (2019).
10. T. P. Hennedige, J. T. P. D. Hallinan, F. P. Leung, L. L. S. Teo, S. Iyer, G. Wang, S. Chang, K. K. Madhavan, A. Wee and S. K. Venkatesh, European radiology 26 (2), 398-406 (2016).
Figures
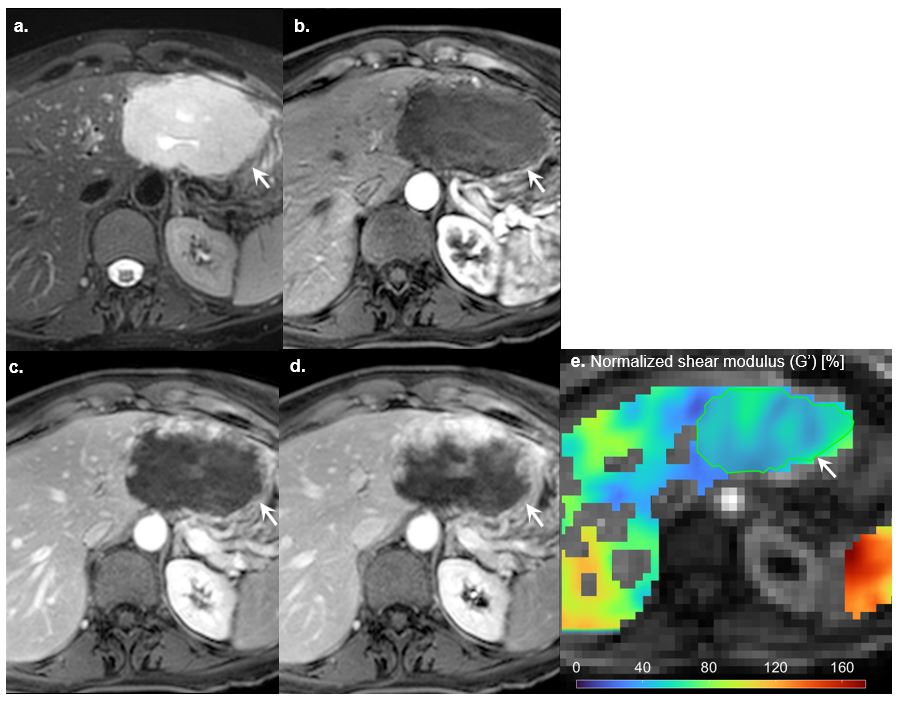
Figure 1. A 50-year-old woman with a liver hemangioma. (a) Axial T2 single-shot fast spin echo with fat saturation shows an 84-mm mass with marked T2 hyperintensity. The contrast-enhanced axial T1-weighted gradient-recalled echo images show discontinuous nodular peripheral enhancement in the (b) arterial phase that progresses centripetally in the (c) portal and the (d) 5 minutes delayed phase. (e) Intrinsic MR elastography reconstruction shows a low normalized storage modulus (G’) (normalized to the mean of G’ in spleen) indicating low stiffness relative to the liver.
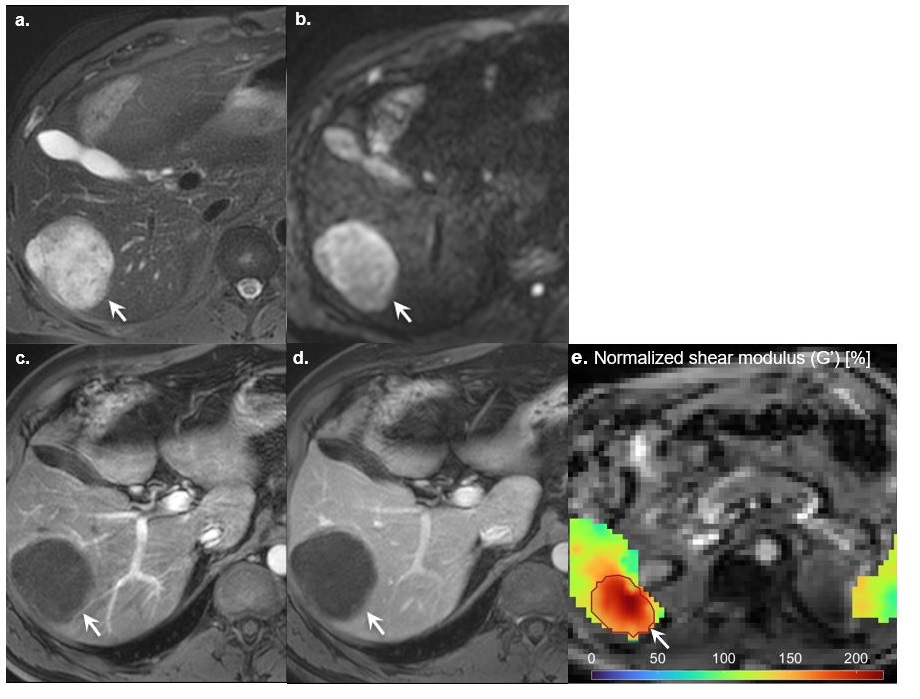
Figure 2. A 64-year-old man with a colorectal liver metastasis (arrows). (a) Axial T2 single-shot fast spin echo sequence with fat saturation shows a 75-mm mass with moderate T2 intensity. (b) Diffusion-weighted imaging at b = 800 s/mm2 shows high signal intensity. On the contrast-enhanced T1-weighted GRE images the mass is hypoenhancing in the (c) arterial and (d) portal venous phases except for a thin rim enhancement. (e) iMRE reconstruction shows high normalized storage modulus (G’) (normalized to the mean of G’ in spleen) indicating high stiffness relative to the liver.
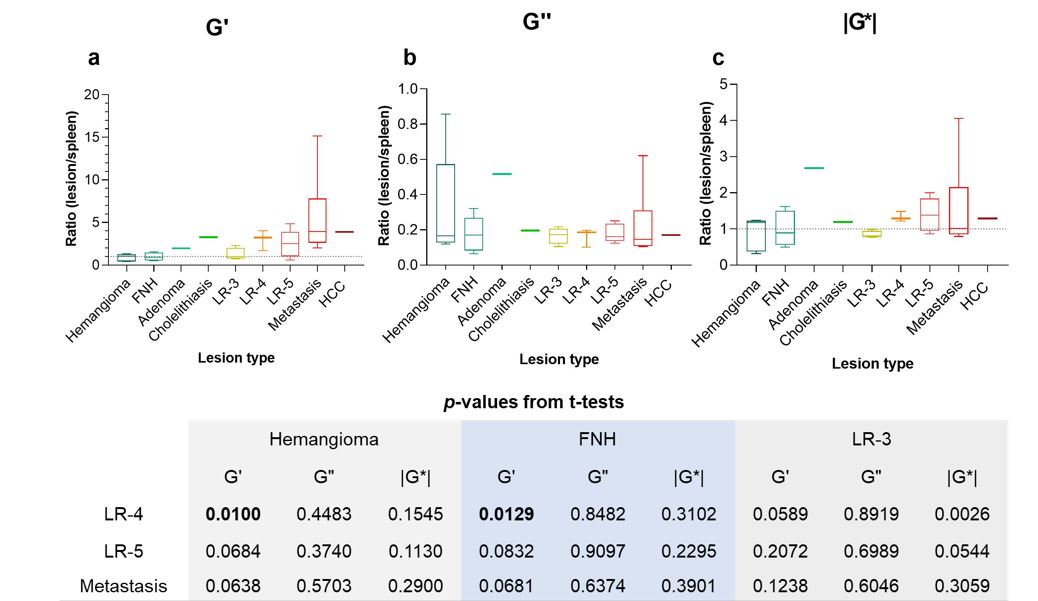
Figure 3. Boxplot of a) storage modulus (G'), b) loss modulus (G'') and c) their magnitude (|G*|) measured by iMRE and normalized by the spleen values, for different liver lesion types. Below, the p-values for t-tests for these three viscoelastic parameters are given for LR-4, LR-5, and metastatic lesions.
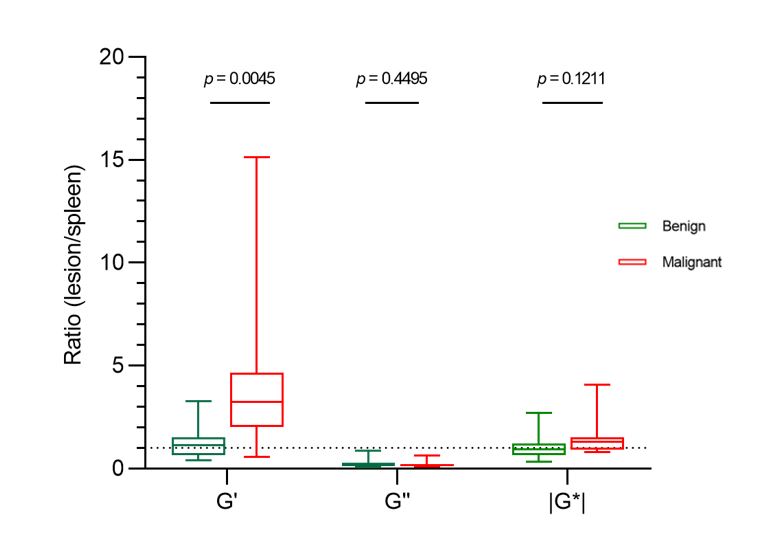
Figure 4. Boxplot of the three iMRE viscoelastic parameters (G', G'', and |G*|) for comparison of benign and malignant lesions.
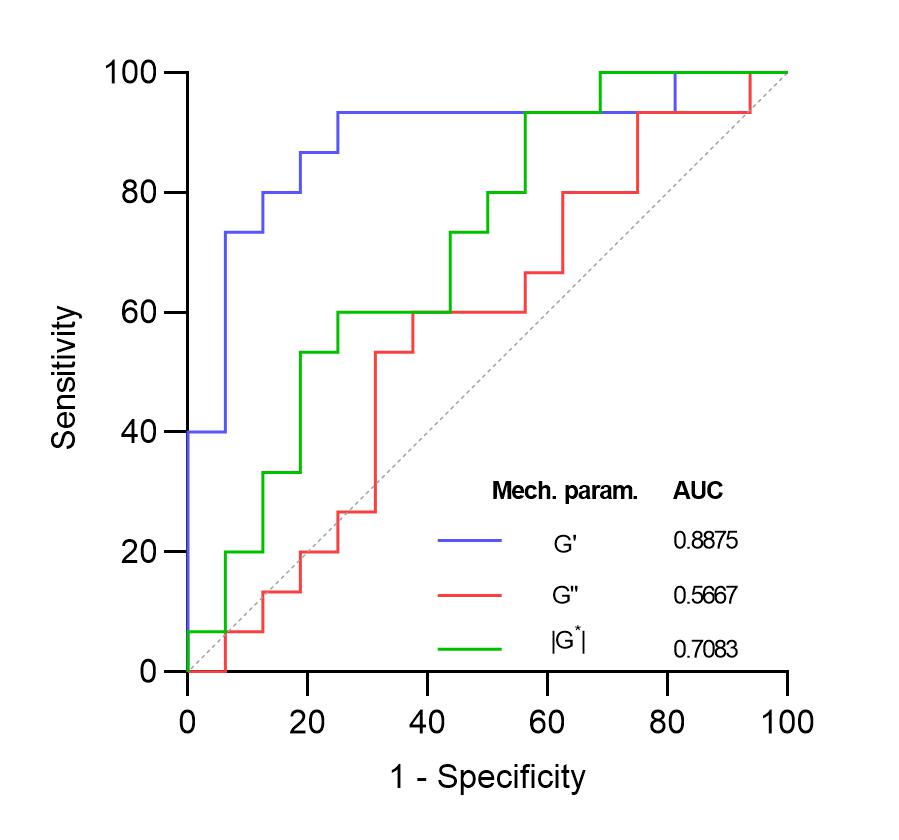
Figure 5. Receiver operating characteristics curves showing normalized iMRE results for the classification of benign vs. malignant lesions.