5153
Improved Brain MRE Performance on a Compact, Lightweight 3T Scanner with High-Performance Gradients1Department of Radiology, Mayo Clinic, Rochester, MN, United States
Synopsis
Keywords: Elastography, Brain, MRE, Compact 3T
We conducted a direct comparison of Brain MRE performance between a compact, lightweight 3T scanner (C3T) and a whole-body scanner (WB3T). We demonstrate in phantom and volunteers that the C3T scanner provides superior image quality and scanning efficiency for commonly performed brain MRE pulse sequences, especially for higher-resolution scanning.Introduction
Brain MR elastography (MRE) is an emerging technique that can help diagnose and understand numerous neurological diseases [1, 2]. In brain MRE acquisition, motion encoding gradients (MEG) with high amplitude and long duration waveforms are utilized to encode the small coherent tissue motion into the MRI phase signal. Echo-planar-imaging (EPI) with fast switching gradients are commonly used in conjunction with MRE for rapid data acquisition. The performance of the gradient system is thus of critical importance for scanning efficiency and data quality. Recently, a lightweight, low-cryogen compact 3T MRI scanner (C3T) has been developed for brain, musculoskeletal, and infant imaging [3, 4]. It is equipped with a high-performance gradient system with 80 mT/m peak gradient amplitude and 700 T/m/s slew rate, compared to a conventional whole-body 3T (WB3T) MRI scanner with typical values of 50 mT/m and 200 T/m/s, respectively. Previous studies have shown that C3T can substantially improve the performance of many brain MRI sequences including those for anatomical imaging [5], DWI [5, 6], and fMRI [7]. The enhanced gradient performance is thus expected to potentially benefit the EPI-based MRE acquisition. In this study, we conducted a direct comparison between C3T and a whole-body scanner on brain MRE performance, and demonstrate superior image quality and scanning efficiency of the C3T system in phantoms and healthy volunteer subjects.Method
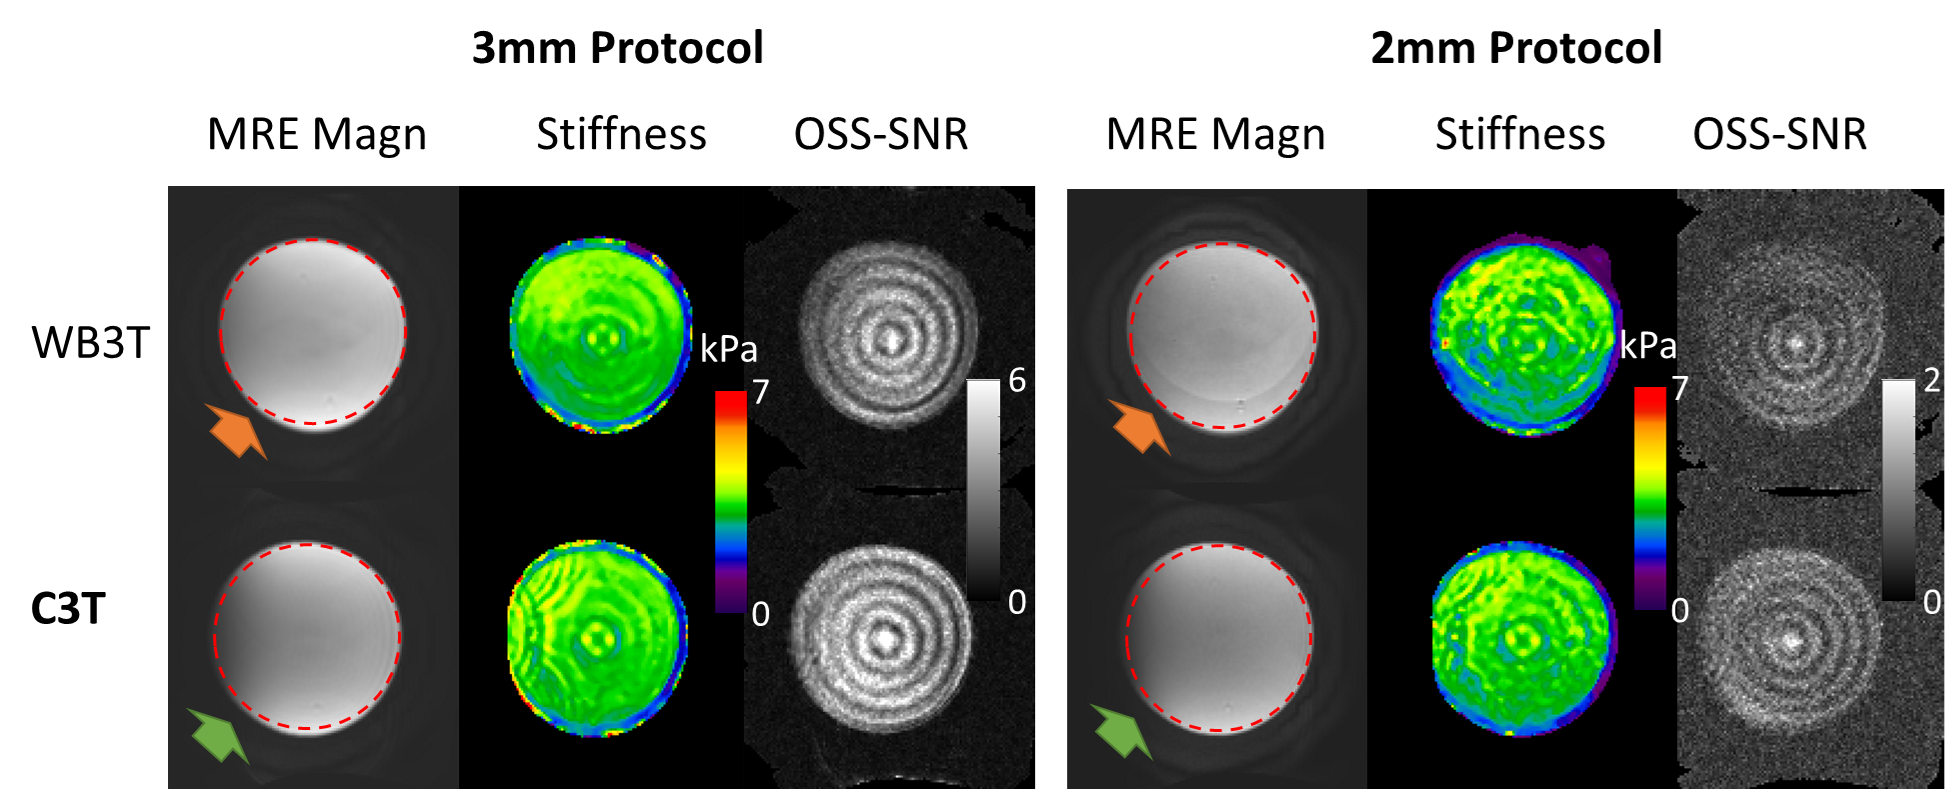
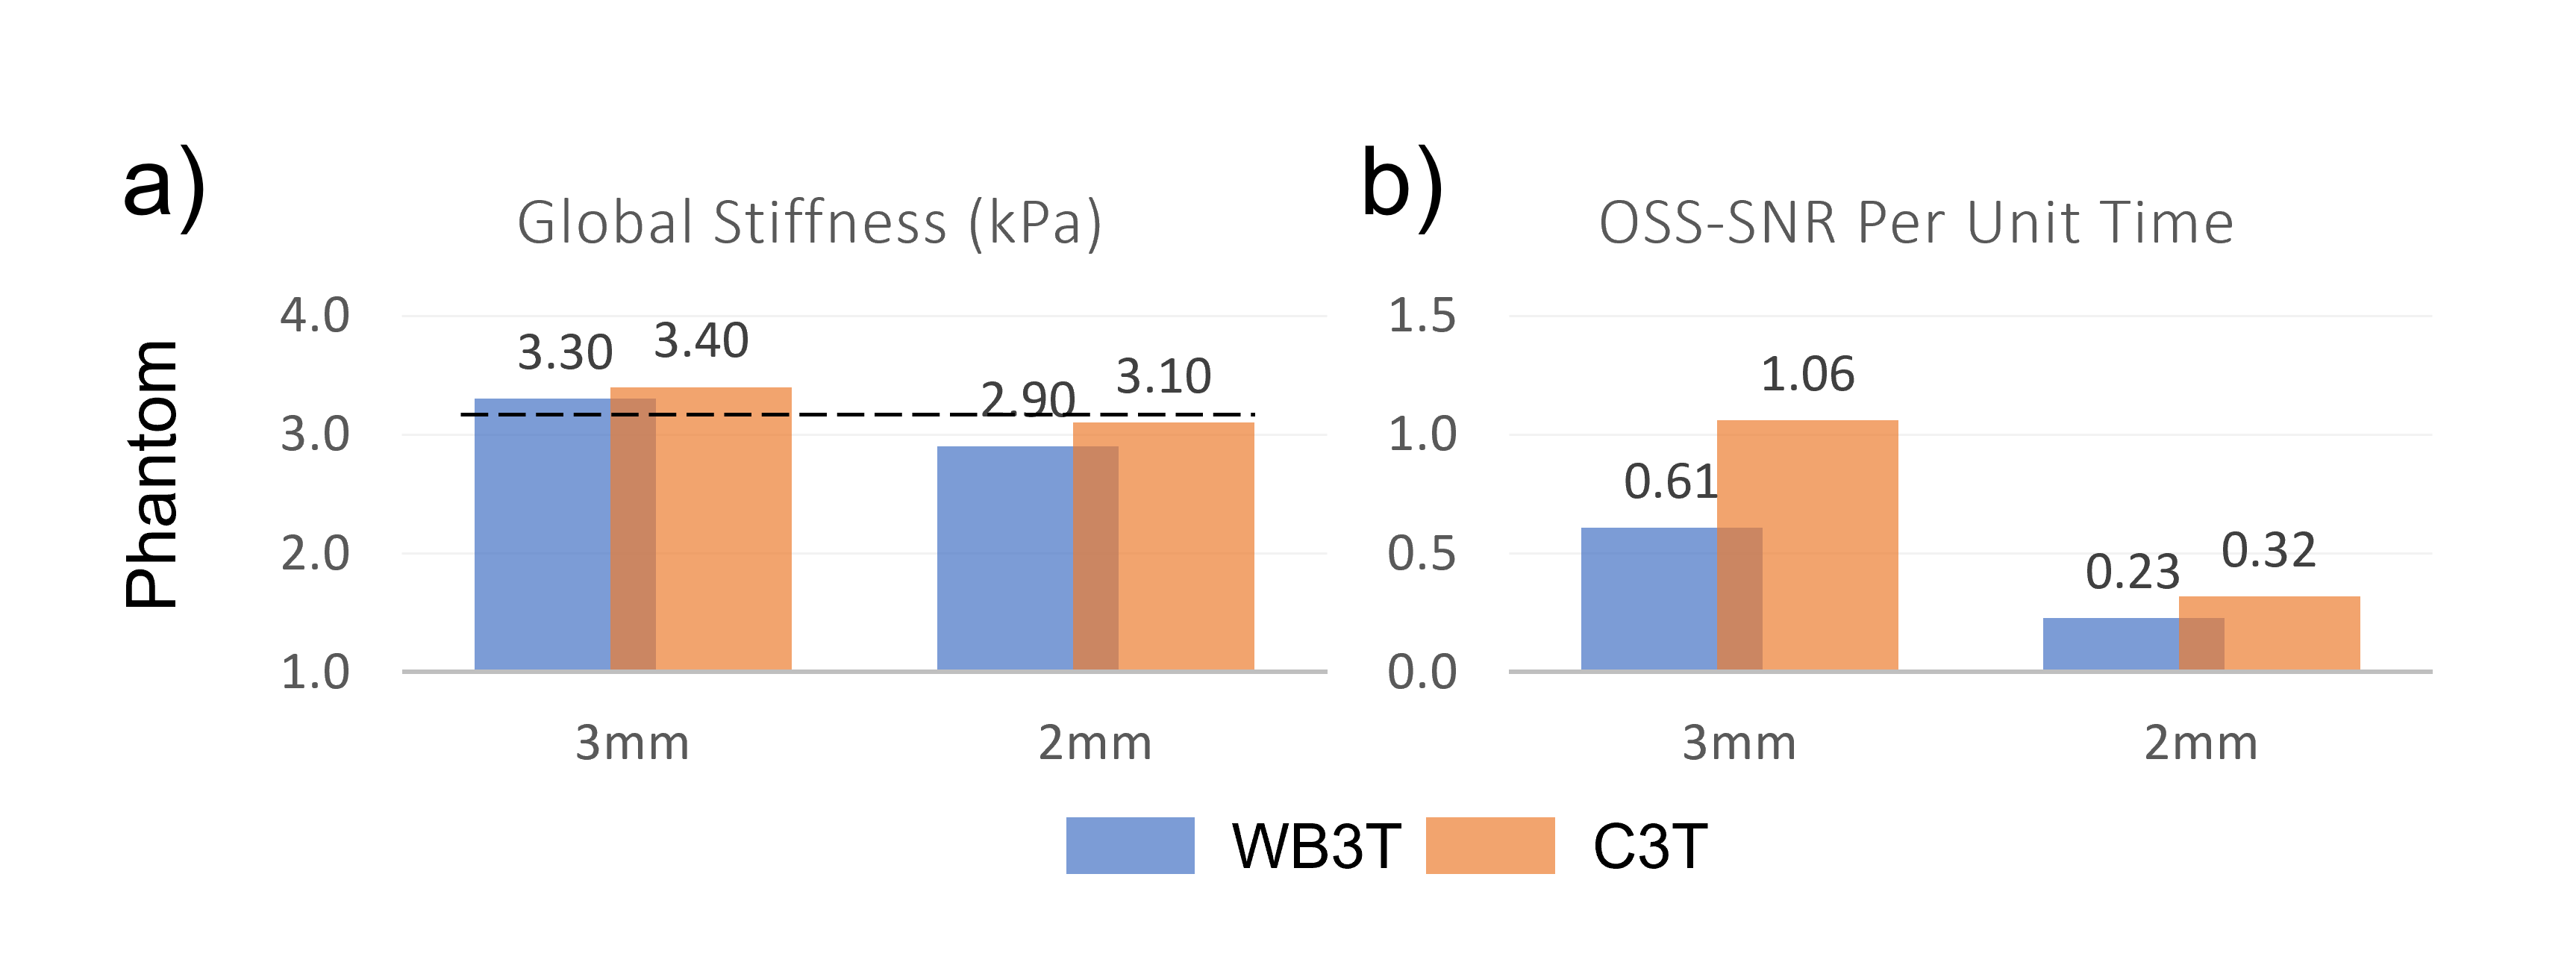
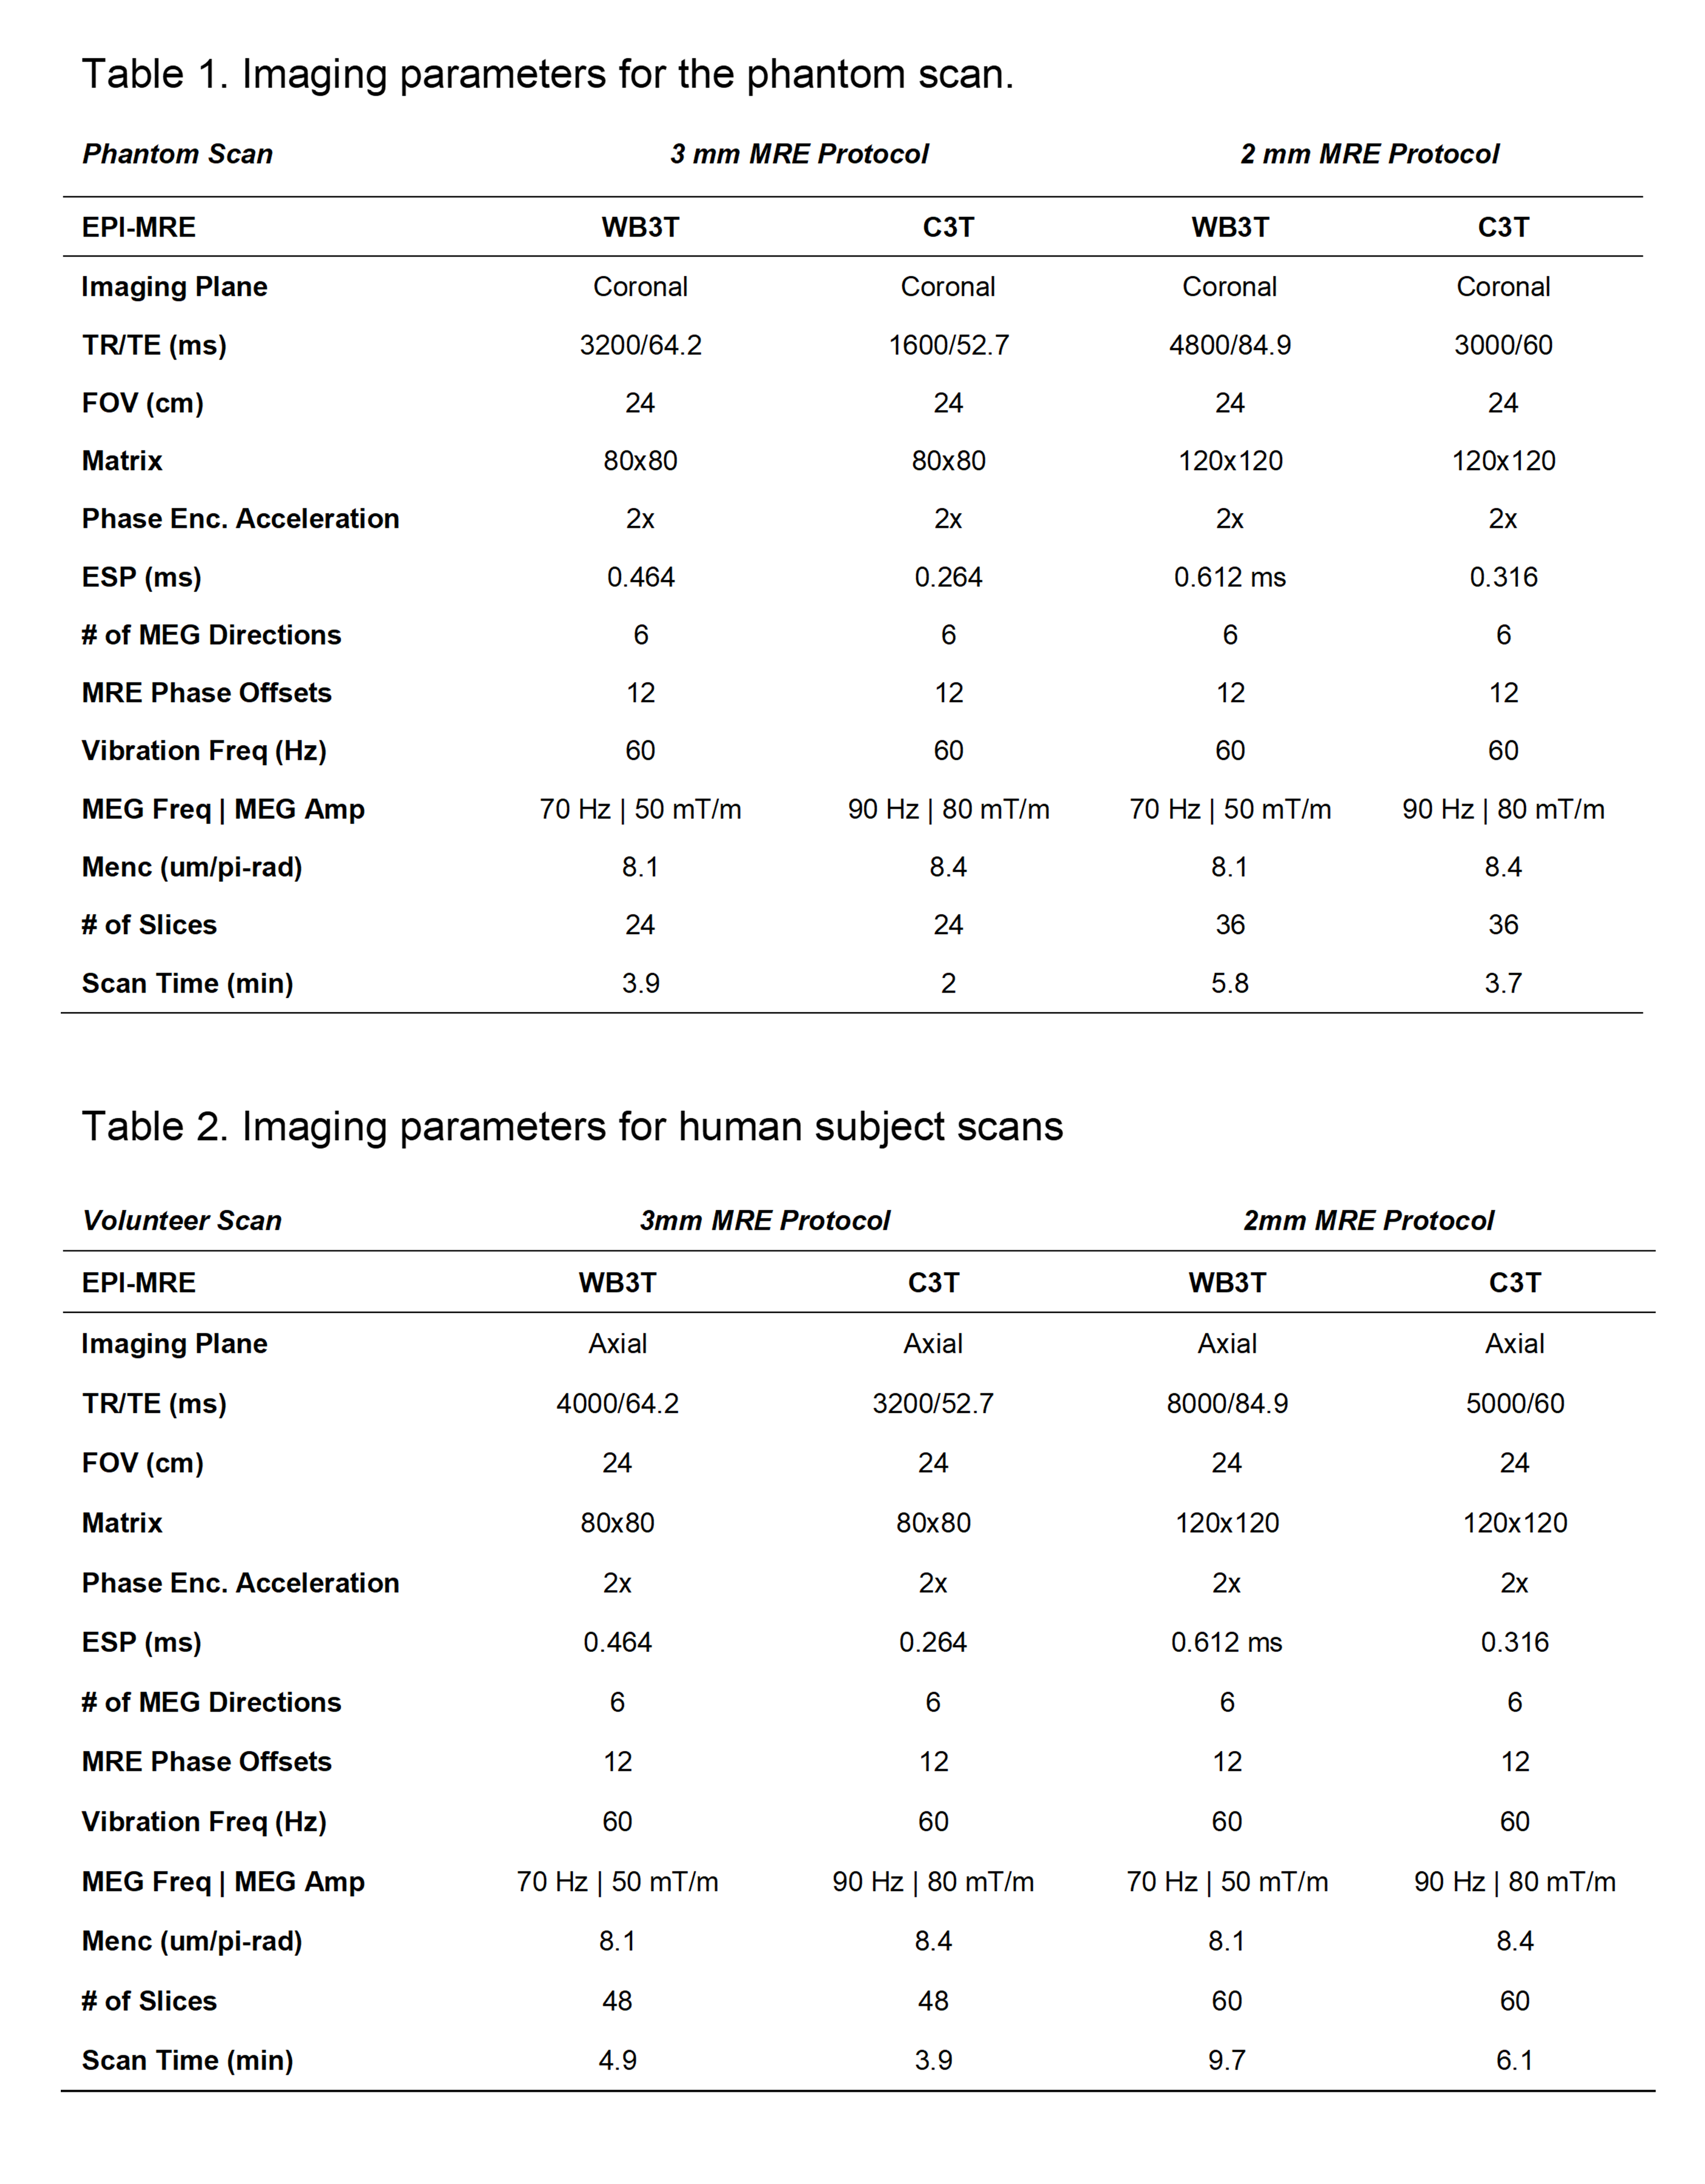
Phantom and healthy volunteer subject studies were conducted on both the C3T scanner and a standard 3T MR system (GE Discovery MR750, GE Healthcare, Waukesha, WI), using identical 8-channel receive-only brain coils (In vivo Diagnostics, Gainesville, FL, USA). The imaging protocol includes a T1-MPRAGE, two 3D multi-slice SE-EPI-MRE scans with 3 mm and 2 mm isotropic resolutions, respectively.Phantom study: A cylindrical MRE QC phantom [8] with known stiffness values (3.22 kPa @ 60Hz) was scanned on both scanners. The imaging parameters are listed in Table 1. For MRE sequences, the MEG amplitudes were set at the allowed maximum gradient amplitude: 80 mT/m on C3T, and 50 mT/m on WB3T. Fractional motion encodings were used to minimize the TE while ensuring the motion encoding efficiency (i.e., MENC). The higher gradient amplitude on C3T allowed a shorter MEG, while keeping the same motion encoding efficiency.
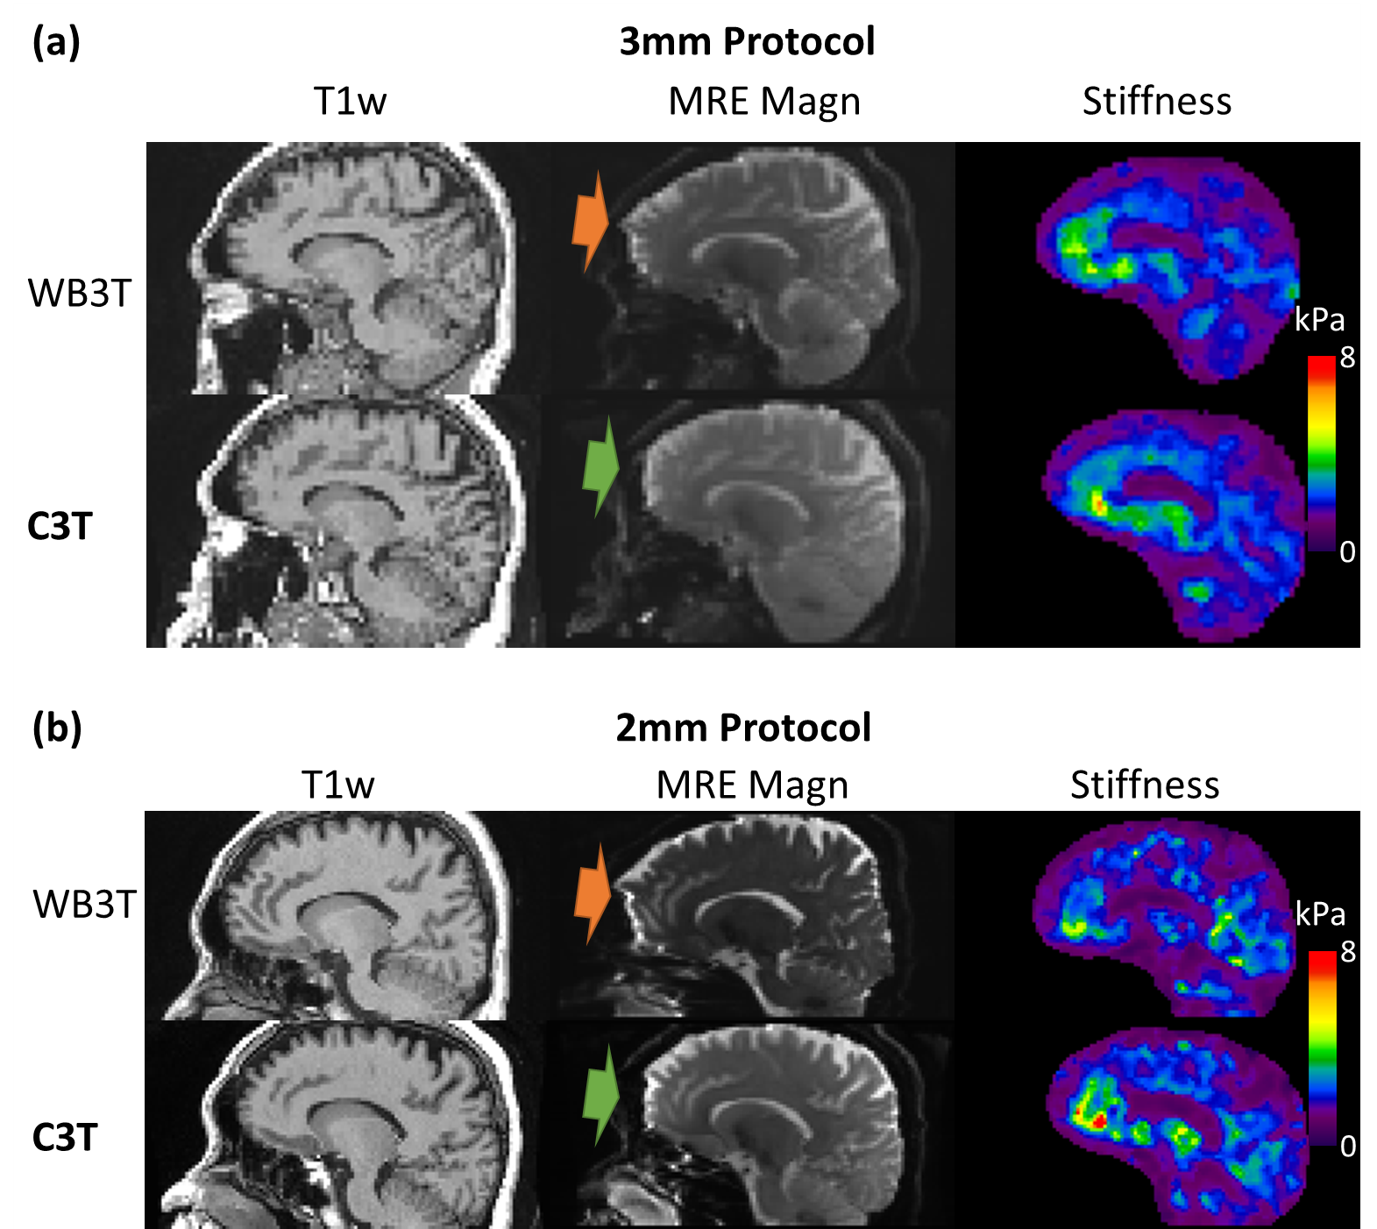
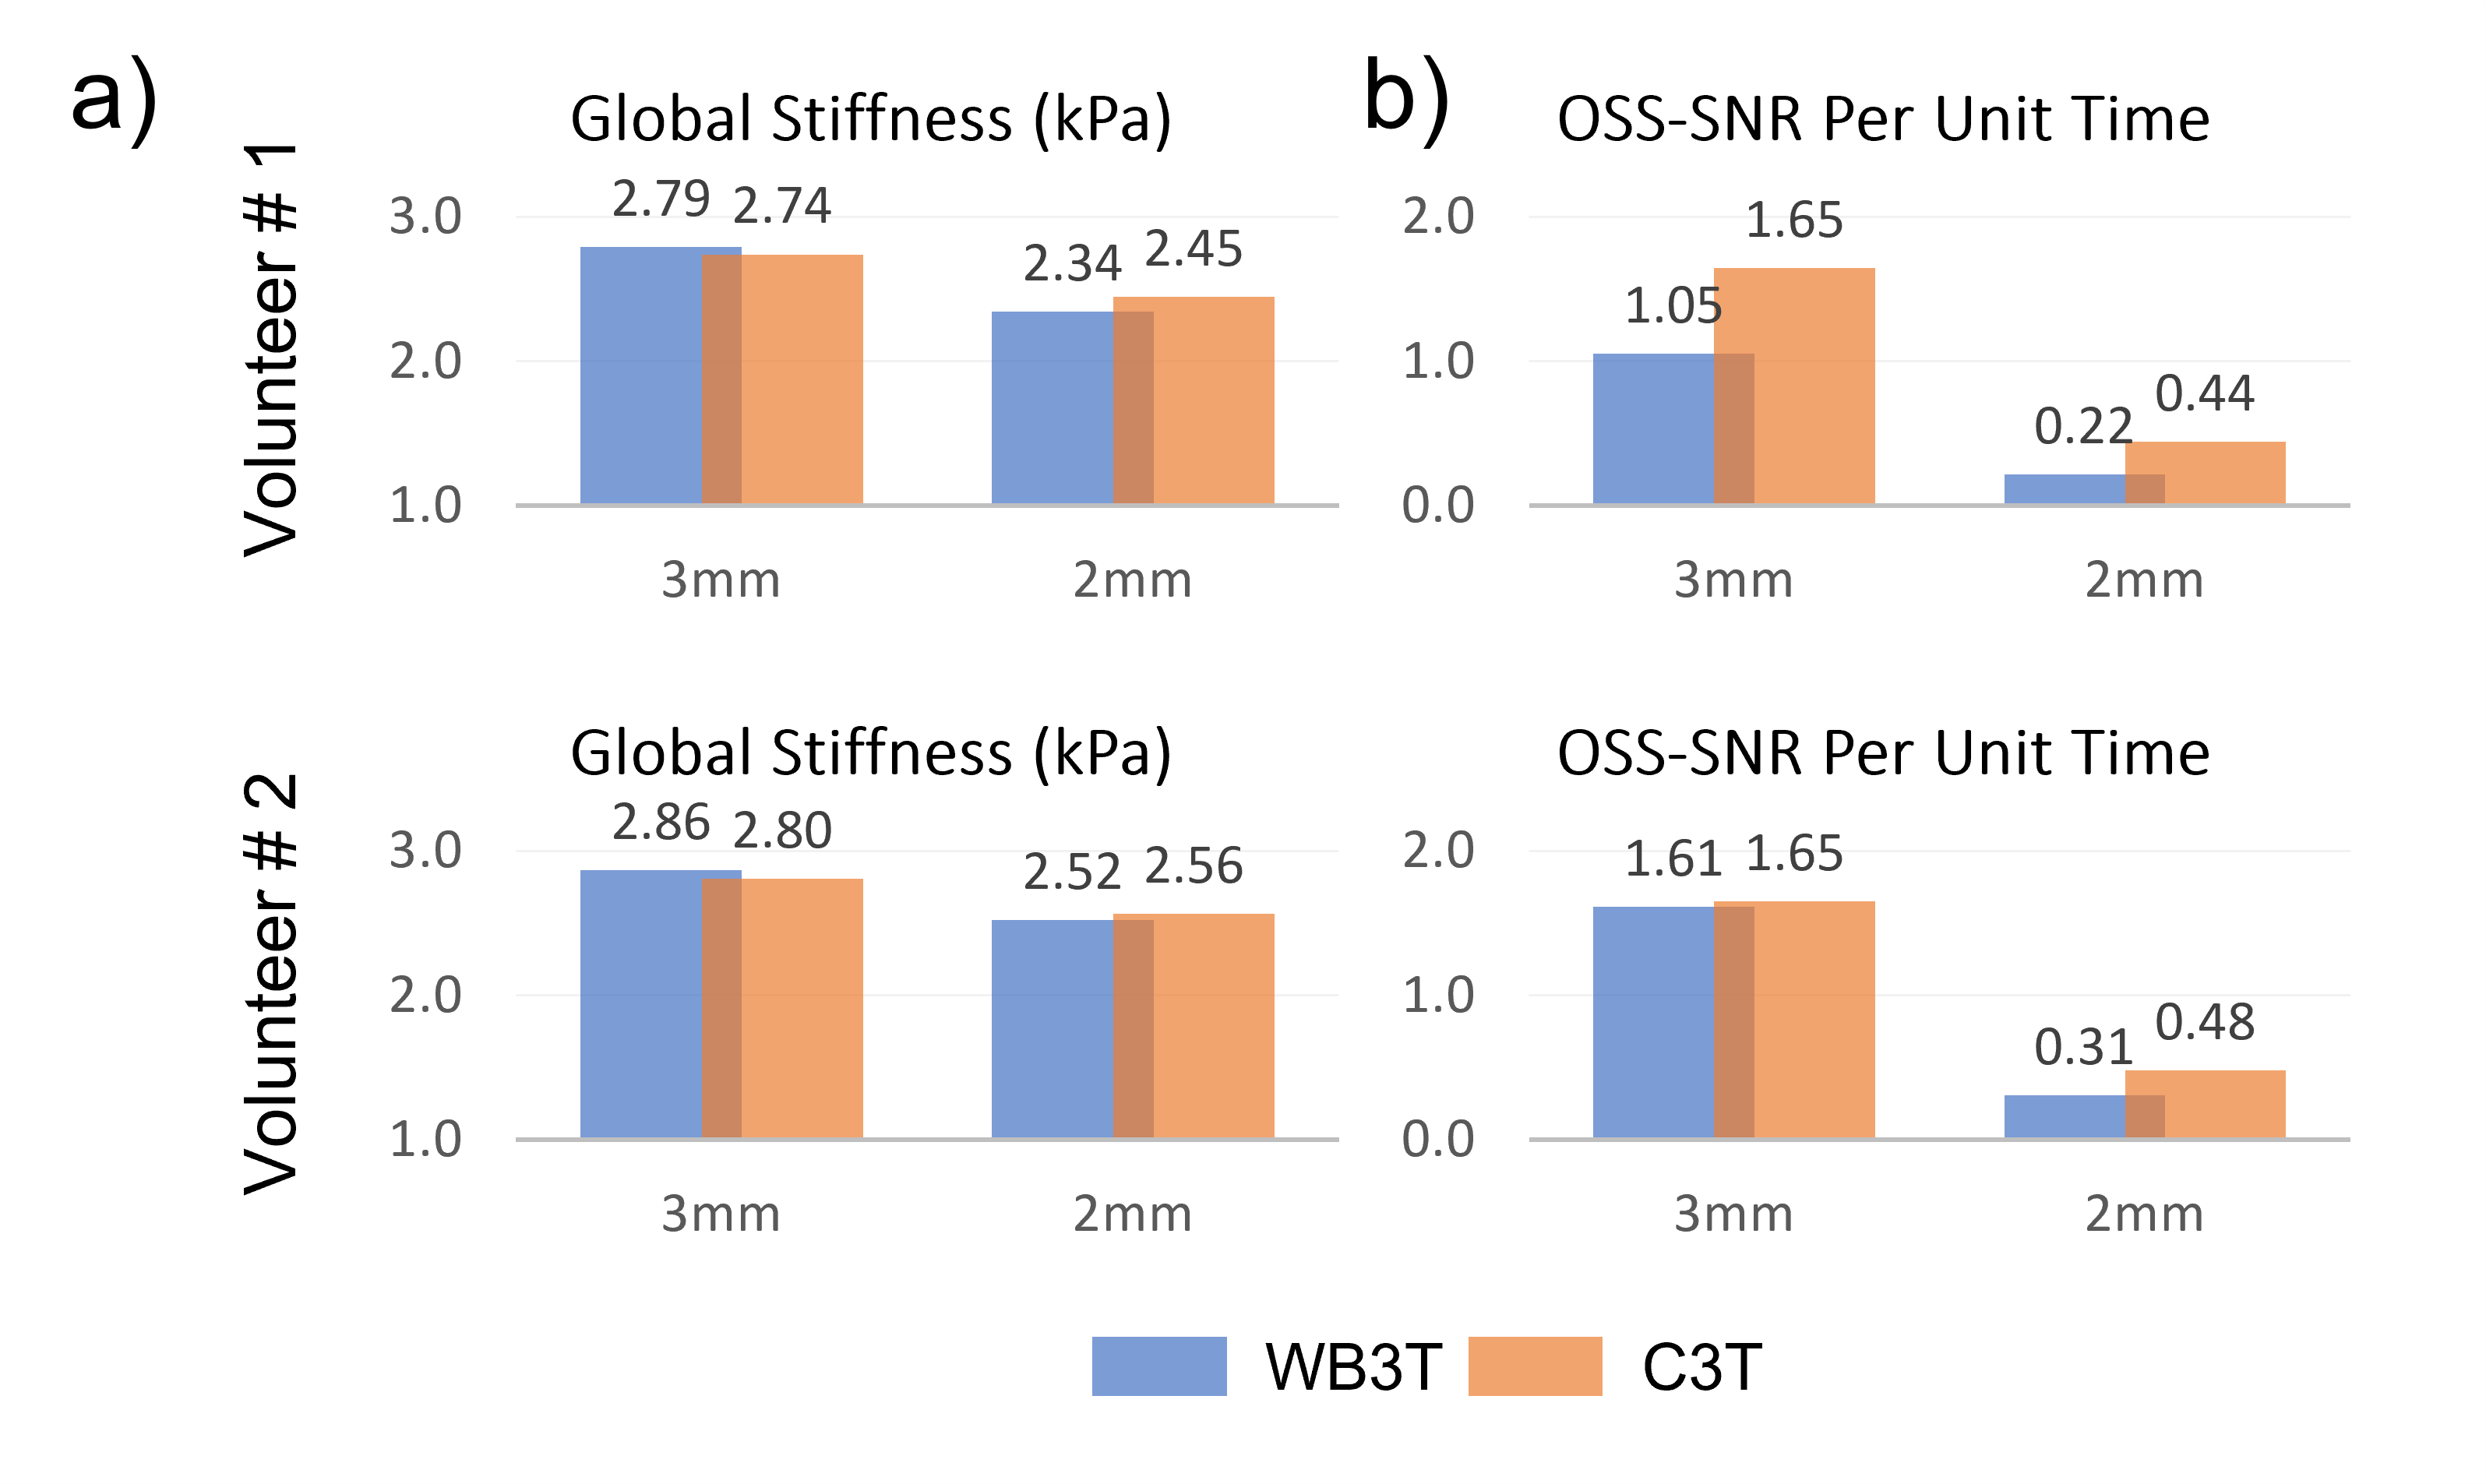
In vivo study: Two healthy volunteers were recruited under an IRB-approved protocol, after obtaining written informed consent. Each subject underwent MRI exams on the two scanners on the same day. The imaging parameters were the same as the phantom scans, except for the number of slices, TR, and scan times as listed in Table 2.
MRE reconstruction: MRE stiffness maps were generated by adaptively calculating the curl of the 3D displacement field, smoothing the curl images, and performing a 3D direct inversion (DI) algorithm to invert the wave field as described in previous studies [9, 10]. The MRE signal-to-noise ratio was quantified by octahedral shear strain SNRs (OSS-SNRs) [11] on a pixel-by-pixel basis.
Data analysis: For the phantom images, two top and two bottom slices of the volume were discarded to avoid the edge effect in the inversion algorithm. The median stiffness values and median OSS-SNR values were calculated over all remaining pixels. For human images, brain masks were created based on segmentations of MP-RAGE images and registered to MRE space [10]. The median stiffness values and median OSS-SNR values were calculated over the whole cerebrum. To compare sequences with different scan times, the OSS-SNR per unit time was calculated from the median OSS-SNR normalized by the square root of the total scan time in minutes.
Results and Discussion
Overall, the geometric distortion is reduced on both the phantom (Fig 1. arrows) and healthy volunteers (Fig 2. arrows) due to reduced echo spacing (see Table 1) achieved by C3T’s high-performance gradients. For the phantom study, stiffness measurements on C3T were within ±6% range of the true stiffness (3.22kPa) for both 3 mm and 2 mm acquisitions. However, the stiffness was underestimated by 10% on WB3T due to its lower SNR (Fig. 3). The volunteer subjects tolerated imaging well on both the C3T and WB3T scanners. For the 2mm high-resolution scan, the C3T can achieve 1.5-2x SNR efficiency compared to WB3T for in vivo scans (Fig. 4), suggesting that C3T can greatly reduce the long scan time for a higher resolution acquisition (e.g., reduce the acquisition time by up to 4x for equivalent SNR).Conclusion
Both the phantom and human scans demonstrated that the C3T scanner provides better image quality than a WB3T scanner for commonly performed brain MRE pulse sequences, especially for the higher-resolution scans. The low distortion, high SNR efficiency, and shorter scan time achieved on C3T could facilitate greater utilization of MRE in high-resolution and low-distortion brain applications.Acknowledgements
This work was supported by grants from the NIH (R01 EB001981, R01 NS113760, and U01EB02445)References
1. Yin, Z., et al., Stiffness and Beyond: What MR Elastography Can Tell Us About Brain Structure and Function Under Physiologic and Pathologic Conditions. Top Magn Reson Imaging, 2018. 27(5): p. 305-318.
2. Murphy, M.C., J. Huston, 3rd, and R.L. Ehman, MR elastography of the brain and its application in neurological diseases. Neuroimage, 2017.
3. Weavers, P.T., et al., Technical Note: Compact three-tesla magnetic resonance imager with high-performance gradients passes ACR image quality and acoustic noise tests. Medical Physics, 2016. 43(3): p. 1259-1264.
4. Foo, T.K.F., et al., Lightweight, compact, and high-performance 3T MR system for imaging the brain and extremities. Magn Reson Med, 2018. 80(5): p. 2232-2245.
5. Camerucci, E., et al., Improved Brain MR Imaging from a Compact, Lightweight 3T Scanner with High-Performance Gradients. J Magn Reson Imaging, 2022. 55(1): p. 166-175.
6. In, M.H., et al., Distortion-free imaging: A double encoding method (DIADEM) combined with multiband imaging for rapid distortion-free high-resolution diffusion imaging on a compact 3T with high-performance gradients. J Magn Reson Imaging, 2019.
7. Kang, D., et al., The benefit of high-performance gradients on echo planar imaging for BOLD-based resting-state functional MRI. Phys Med Biol, 2020. 65(23): p. 235024.
8. Pepin, K.M., et al., Magnetic resonance elastography of the liver: everything you need to know to get started. Abdom Radiol (NY), 2022. 47(1): p. 94-114.
9. Manduca, A., et al., Magnetic resonance elastography: Non-invasive mapping of tissue elasticity. Medical Image Analysis, 2001. 5(4): p. 237-254.
10. Murphy, M.C., et al., Measuring the characteristic topography of brain stiffness with magnetic resonance elastography. PLoS One, 2013. 8(12): p. e81668.
11. McGarry, M.D., et al., An octahedral shear strain-based measure of SNR for 3D MR elastography. Phys Med Biol, 2011. 56(13): p. N153-64.
Figures