5148
A Biomechanical Analysis Framework for Co-Correlation of 7T MR Elastography Measures and Amyloid Beta Deposition1Mechanical Engineering, University of Washington, Seattle, WA, United States, 2Biomedical Engineering and Imaging Institute, Ichan School of Medicine at Mount Sinai, New York City, NY, United States, 3Graduate School of Biomedical Sciences, Ichan School of Medicine at Mount Sinai, New York City, NY, United States
Synopsis
Keywords: Elastography, Brain, 7T, Alzheimer's Disease, PET
Previous studies have implied the future use of MRE metrics to track disease progression and as a tool for AD diagnosis, potentially replacing or augmenting methods that use ionizing radiation. In this pilot study, we have therefore developed a novel framework for performing ultrahigh field (7T) MRE at high resolution on subjects who have previously undergone PET scans and performing joint analysis of biomechanical and pathologic markers on these subjects. We have successfully created a framework for measurement of high-resolution brain mechanical properties for co-correlation with traditional PET measures to be used on AD patients in the future.Introduction
Alzheimer’s disease (AD) is a neurodegenerative disease caused by abnormal deposits of amyloid plaques and intracellular neurofibrillary tangles of the protein tau1. Damage is initially found in the hippocampus and entorhinal cortex, where the connections between neurons are lost and those neurons die over time2. Over the progression of AD, the damage spreads throughout the brain, shrinking the volume of the overall brain tissue. Symptoms include memory loss, confusion, and cognitive difficulties. Early diagnosis of AD is still challenging because of the subtlety of the microstructural changes it initially causes in the brain, which is particularly troubling, as most treatments for AD can only be used to slow its progression, not reverse it, and are often far more successful when started early. Pivotal studies applying MRE have shown a progressive softening of white and gray matter tissue in AD patients compared to healthy controls (especially in the frontal, parietal and temporal lobes) in line with the known topography of AD pathology3,4. This implies the future use of MRI and MRE metrics to track disease progression and as a tool for AD diagnosis, potentially replacing methods that require patients to undergo ionizing radiation on a regular basis.Although MRE studies on AD patients have identified tissue softening, there might be different spatiotemporal effects of tau and amyloid beta on brain tissue mechanics due to the intracellular and extracellular nature of their deposition. There might be competing effects of tissue atrophy and plaque formation on the measured brain mechanical properties. Therefore, one of the limitations of using MRE on AD patients is the lack of understanding of microstructural causes that induce tissue viscoelasticity variations. This difficulty limits the current predictive value of MRE for early diagnosis and for the assessment of individual risk of developing cognitive decline. To overcome this challenge, in this pilot study, we developed a novel framework for performing 7T MRE at high resolution on subjects who have previously undergone PET scans, and performing joint analysis of biomechanical and pathologic markers on these subjects. This approach has the potential to provide physical understanding regarding the meaning of these MRE parameters in the context of dementia and neurodegeneration.
Methods
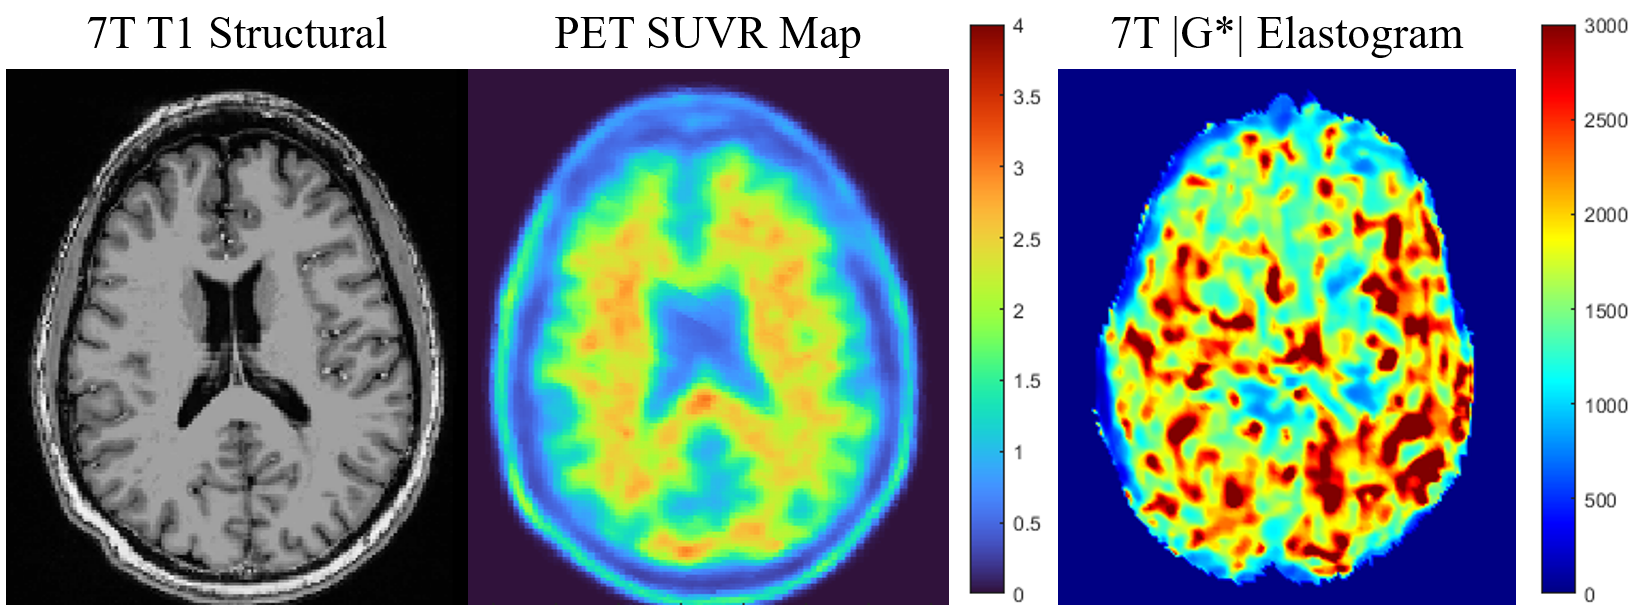
Full brain coverage MRE (using a custom SE-2D-EPI-based sequence5) was performed on six healthy human subjects (Avg. age 73.2 years) at 1.1mm isotropic resolution and 50Hz vibration frequency6, using a 32-channel head coil (Nova Medical) on a 7T Siemens Magnetom MRI scanner (TR/slice=140ms, TE=65ms, GRAPPA=3, Partial Fourier 7/8). Raw data were collected for each of these scanning sessions, and images were reconstructed post-hoc using Gadgetron to reduce the occurrence of phase singularities often found in standard reconstructions of this type. Images were denoised using a MP-PCA algorithm5 and unwrapped using Segue 4D unwrapping7. Curl filtering, Fourier decomposition, and a quartic smoothing kernel7 were used to acquire wavefield images, before Algebraic Inversion of the Helmholtz Equation was used to calculate the complex shear stiffness8 (Figure 1). T1 images were segmented using Freesurfer and co-registered to the magnitude images of the MRE acquisition such that a transformation matrix was generated. This transformation matrix was then applied to the masks to be directly applied to the calculated elastograms.These six subjects have also previously undergone a Aβ burden measurement with F18–labeled florbetaben simultaneous positron emission tomography and magnetic resonance (PET-MR) imaging on a Siemens Biograph mMR using standardized protocols in accordance with FDA labeling instructions. Attenuation-corrected data from 90-110 minute post-injection are measured in 1-minute windows and corrected for motion. PET data are expressed as a selective uptake value (SUV) (Figure 1). These PET images were also co-registered to the T1 images captured during the 7T MRI scanning session and previously generated Freesurfer masks applied.
Results
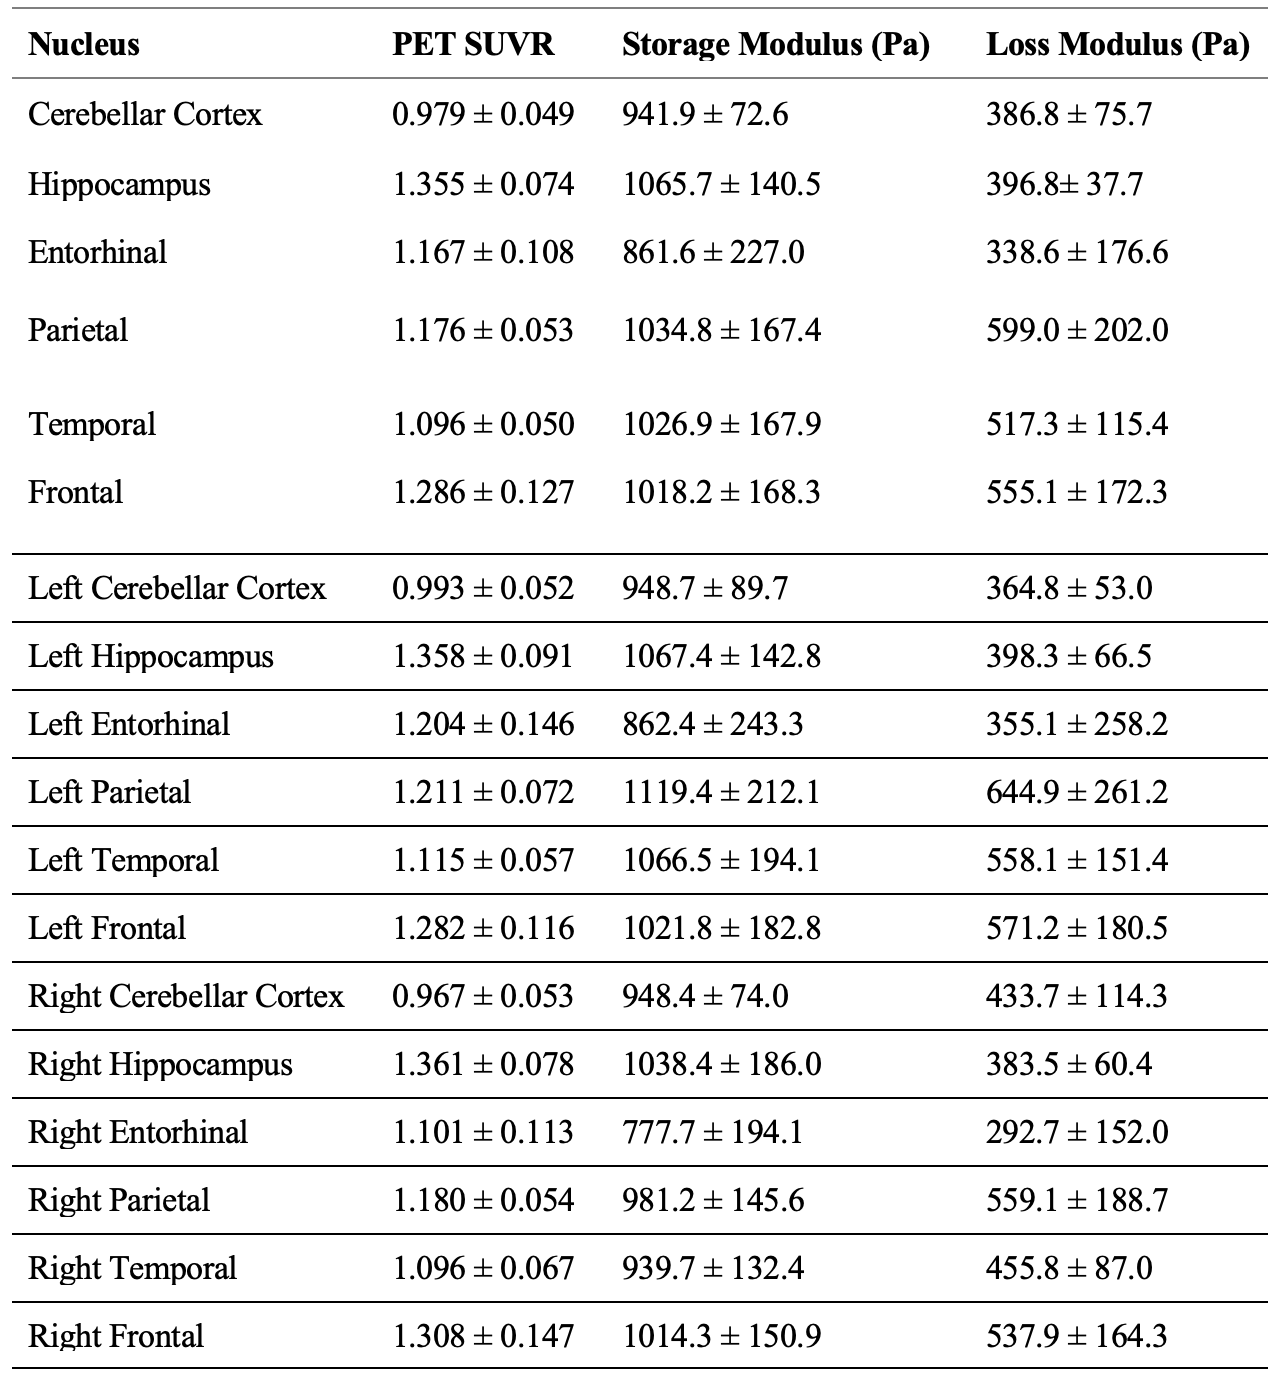
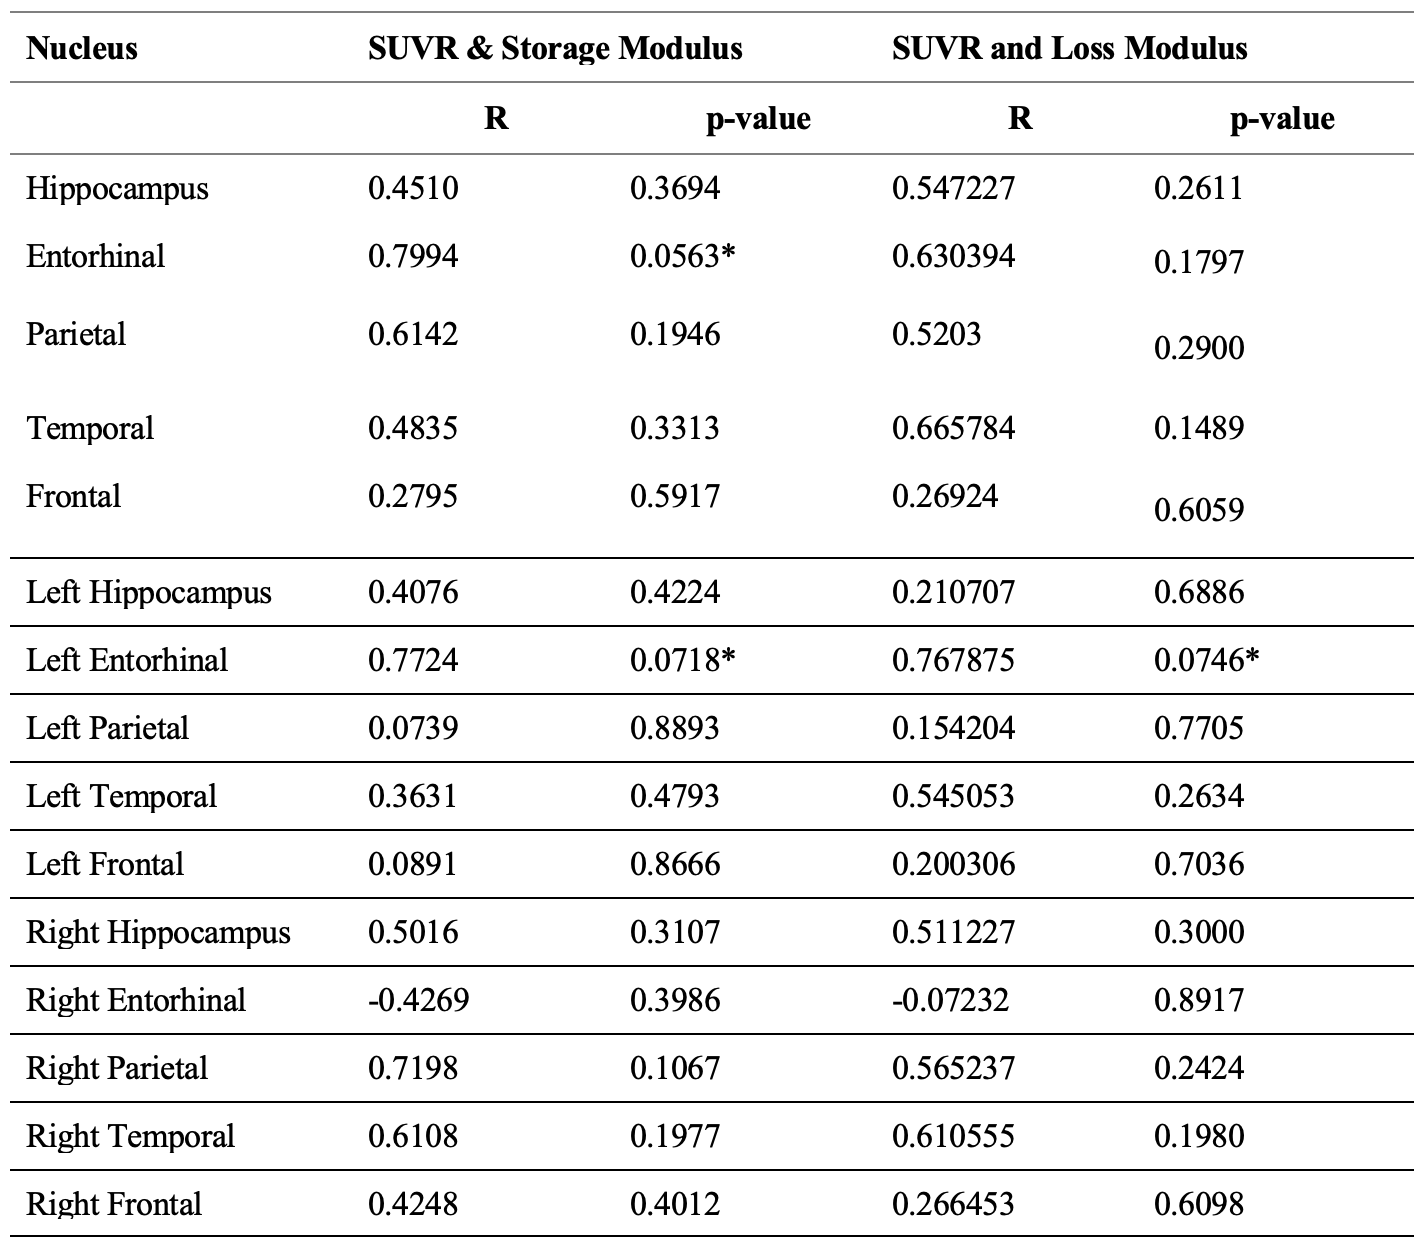
Using 7T neuroimaging and advanced signal processing techniques, we have successfully created a framework for measurement of high-resolution brain mechanical properties. Average Loss Modulus, Storage Modulus, and SUVR for each brain region for each subject was calculated and can be found listed in Table 1. A regression for each brain region between average SUVR and average Loss and Storage Modulus was also performed. The correlation coefficients and p-values for each brain region can be found in Table 2.Discussion
Based on these correlation coefficients, for healthy older adults, there is a strong positive correlation between SUVR and Storage Modulus that is approaching significance in the Entorhinal cortex, as well as a strong positive correlation between SUVR and Storage Modulus and SUVR and Loss Modulus that is approaching significance in the Left Entorhinal cortex. With continued recruitment of subjects with AD and MCI, we hope to expand this method to perform joint analysis of biomechanical, connectomic and pathologic markers in AD patients and bring novel insights in our understanding of the mechanisms of AD onset and progression. We also intend to perform voxel-wise comparisons within brain regions in the future, control for age and sex, as well as include analysis of Tau and Dopamine PET metrics as this study progresses.Conclusion
Our biomechanical analysis framework has promise to determine correlations between various MRI and PET measures for AD and MCI subjects, providing a physical understanding between tissue mechanics and AD pathophysiology.Acknowledgements
The authors would like to acknowledge Dr. Veraart (NYU) for providing the MP-PCA denoising algorithm, and support from funding sources P30AG066514 and NIH R21AG071179.References
1. Double, K. L. et al. Topography of brain atrophy during normal aging and Alzheimer’s disease. Neurobiol. Aging 17, 513–521 (1996).
2. Blinkouskaya, Y. & Weickenmeier, J. Spatiotemporal Atrophy Patterns in Healthy Brain Aging and Alzheimer’s Disease. in IMECE (2021).
3. Murphy, M. C. et al. Regional brain stiffness changes across the Alzheimer’s disease spectrum. NeuroImage Clin. 10, 283–290 (2016).
4. Hiscox, L. V et al. Mechanical property alterations across the cerebral cortex due to Alzheimer’s disease. Brain Commun. 2, (2019).
5. Triolo, E. et al. Development and validation of an ultra-high field compatible MR elastography actuator. in Summer Biomechanics, Bioengineering and Biotransport Conference SB3C2021-325 (2021).
6. Triolo, E. R. et al. Design, Construction, and Implementation of a Magnetic Resonance Elastography Actuator for Research Purposes. Curr. Protoc. 2, 1–26 (2022).
7. Karsa, A. & Shmueli, K. SEGUE: A Speedy rEgion-Growing Algorithm for Unwrapping Estimated Phase. IEEE Trans. Med. Imaging 38, 1347–1357 (2019).
8. Maharjan, S. et al. Directional Filter, Local Frequency Estimate and Algebraic Inversion of Differential Equation of Psoas Major Magnetic Resonance Elastography. Open J. Med. Imaging 10, 1–16 (2020).
Figures