5147
Characterization of Functional MR Elastography Responses to Variations in Visual Stimulus Frequency and Contrast1Department of Radiology, Mayo Clinic, Rochester, MN, United States
Synopsis
Keywords: Elastography, Elastography, Functional MR Elastography
The response of BOLD fMRI to changes in both visual contrast frequency and contrast intensity have been well documented. Recently, an increase in the stiffness of activated regions of the visual cortex due to a controlled variation of block duration has been demonstrated with fMRE elastograms. The current study aims to investigate the relationship between BOLD fMRI and fMRE due to a controlled variation of both contrast intensity and contrast frequency of a visual stimulation. This study demonstrates that the fMRE-measured stiffness change varies linearly with the underlying neural activity, which can be modulated by stimulus parameterization.Introduction
Investigating the relationship between functional MRE (fMRE) and fMRI in response to an external stimuli has recently become possible1-10. Lan et al.11 reported a 6-11% increase in the stiffness of select regions of the visual cortex in response to visual stimulus. Regions of activation were found to be similar between fMRI and fMRE, however no significant spatial correlations were reported between the two methods. Unlike fMRI12-15, the response of fMRE to visual stimulus flickering frequency and contrast intensity is unknown. Therefore, the current work aims to measure the stiffness response as a function of underlying neural activity due to a controlled variation of both flickering frequency and intensity of contrast during controlled visual stimulus.Method
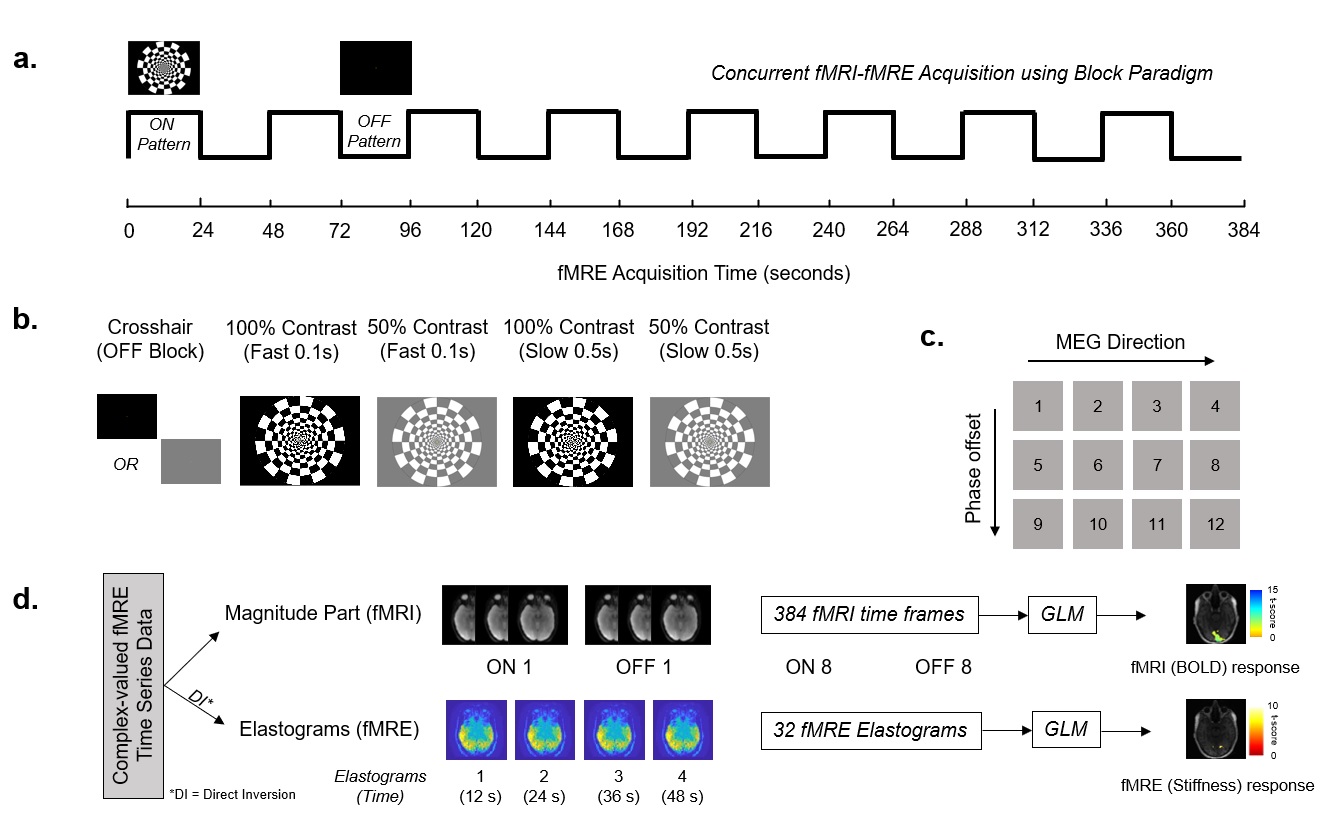
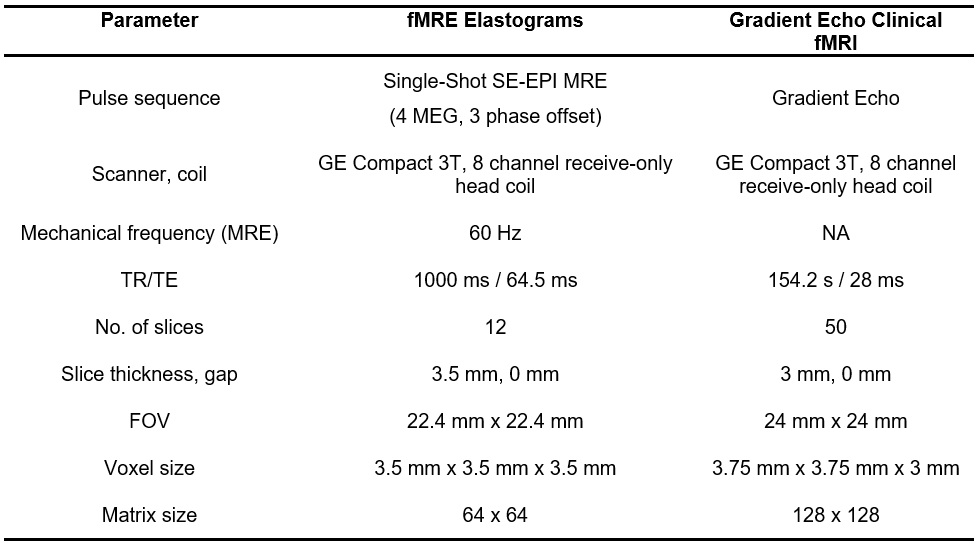
With institutional review board approval and written informed consent, 6 subjects underwent a fMRI/fMRE exam. The clinical fMRI and simultaneous fMRE/fMRI data acquisition parameters are summarized in Table 1. A visual checkerboard pattern was displayed at the time of data acquisition as shown in Figure 1. Four paradigms of contrast and flickering frequency were tested: i) 100% contrast with fast flipping (0.1 s), ii) 50% contrast with fast flipping (0.1 s), iii) 100% contrast with slow flipping (0.5 s) and iv) 50% contrast with slow flipping (0.5 s). Complex-valued time series data acquired during each scan was separated into magnitude and phase components (Figure 1d) and a general linear model (GLM) was used to model activation maps by fitting experimental data to a standard hemodynamic response function (HRF) for BOLD fMRI and with a modified HRF with time to peak modified from 12 s to 8s for the fMRE elastograms.Results
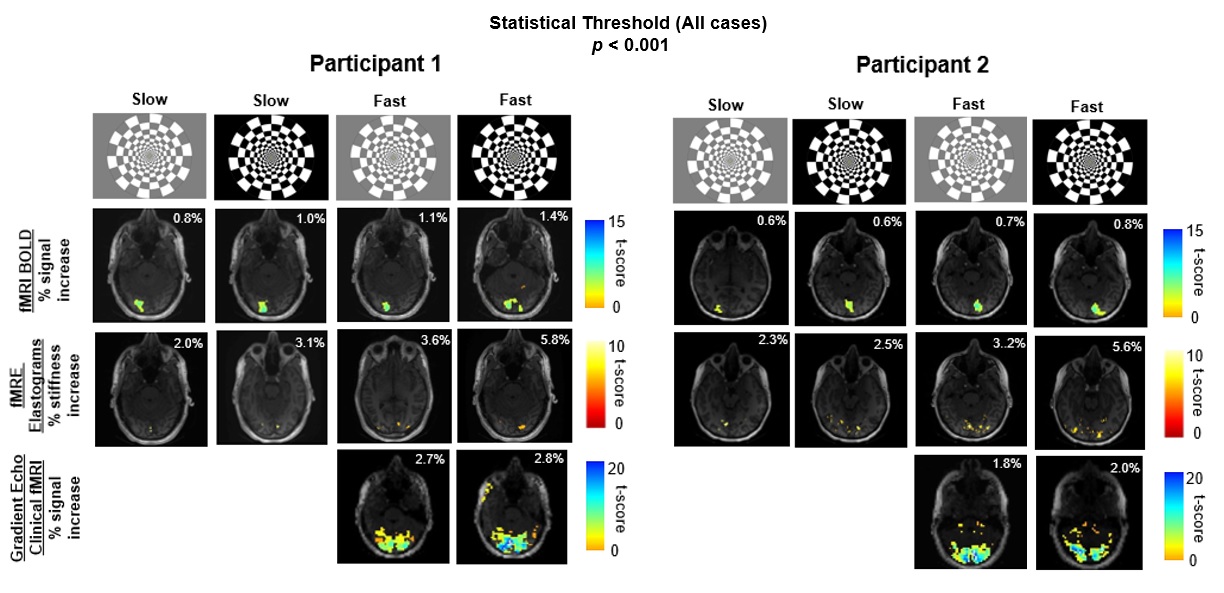
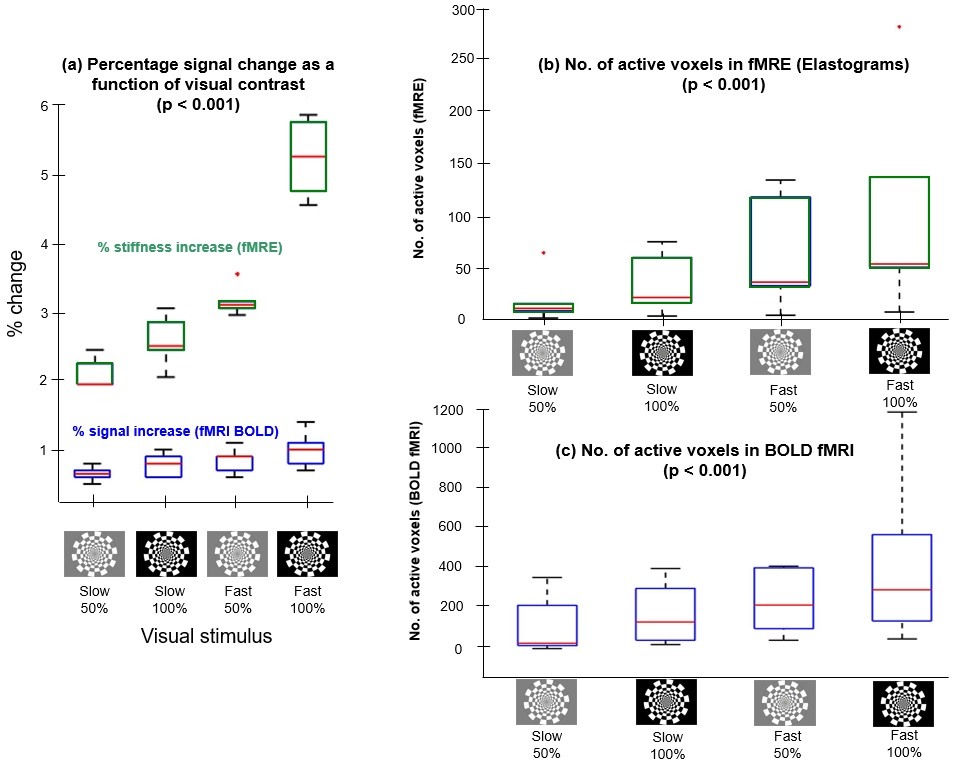
Typical experimental outputs of regional activation maps for 2 participants with a statistical threshold of p < 0.001 are shown in Figure 2. BOLD fMRI from fMRE magnitude data, fMRE elastograms, and clinical GRE fMRI activation maps are shown in Figure 2 rows 2, 3, and 4 respectively. The regions of activation for fMRI BOLD (row 2) and fMRE elastograms in row 3 do not overlap despite coming from the same data set. A comparison between percentage signal change associated with fMRI BOLD and the percentage of fMRE stiffness increase as a function of contrast and frequency of visual stimulus (p < 0.001) is shown in Figure 3. Both fMRI (% signal) and fMRE (% stiffness) increased with the contrast and frequency of the stimulus (Figure 3a). In regions of activation, stiffness increased by ~5% while the BOLD signal change was observed to increase ~1%. The number of active voxels included in the regions of interest for BOLD fMRI and fMRE stiffness are plotted as a function of contrast intensity and frequency of flicker in figures 3(b) and 3(c), respectively. Many more active voxels were observed with fMRI BOLD than with fMRE stiffness. A linear mixed effect model analysis with fixed effects for both frequency of stimulus and contrast intensity showed that fMRE signal was significantly impacted by both the frequency of the stimulus (p < 0.0001) and the contrast intensity (p < 0.001).Discussion
This study demonstrates the sensitivity of fMRE to changes in stiffness resulting from both the intensity and frequency of flickering of a visual stimulus. A 5-6% increase in the stiffness of activated regions in the visual cortex (100% contrast, fast flickering) is reported. A comparison of activation regions between fMRI (BOLD) and fMRE elastograms shows very little overlap between the regions of activation. The regions of activation shown in fMRE elastograms are much smaller in comparison to BOLD fMRI, which most likely suggests that our fMRE data is at the lower limits of the SNR needed to detect this signal. Future work will be aimed at improving fMRE SNR.Conclusion
Functional MRE signal response in the visual cortex increases with both frequency and contrast intensity of the visual stimulus. Future studies are needed to explore the relatively small overlap of regions of fMRI BOLD and fMRE stiffness responses.Acknowledgements
No acknowledgement found.References
1. de Arcos J, F.D., Schregel K, Neji R, Patz S, Sinkus R. Imaging primary neuronal activity in the human optical cortex at 1.35 Hz. in ISMRM. 2018.
2. de Arcos J, F.D., Neji R, Patz S, Sinkus R. Spatial-temporal dynamics of the visual cortex stiffness driven by a flashing checkerboard stimulus. in ISMRM. 2019.
3. Fehlner A, H.S., Guo J, Braun J, Sack I. The viscoelastic response of the human brain to functional activation detected by magnetic resonance elastography. in Proceedings of International Society of Magnetic Resonance in Medicine. 2014.
4. Forouhandehpour R, B.M., Gilbert G, Butler R, Whittingstall K, Van Houten E, Cerebral stiffness changes during visual stimulation: Differential physiological mechanisms characterized by opposing mechanical effects. Neuroimage, 2021. 1.
5. Holub O, L.S., Schregel K, Bilston L, Patz S, Sinkus R. Fingertapping Experiment Observed by Brain Magnetic Resonance Elastography. 2015.
6. Mishra S, D.B., Hoge WS, Tie Y, Annio G, Sinkus R, Patz S. Imaging Neuronal Activity at Fast Timescales in Humans using MR Elastography. in ISMRM. 2022.
7. Patz S, F.D., Schregel K, Nazari N, Palotai M, Barbone PE, et al., Imaging localized neuronal activity at fast time scales through biomechanics. Sci Adv, 2019(5): p. eaav3816.
8. Patz S, F.D., Schregel K, Nazari N, Palotai M, Barbone PE, Fabry B, Hammers A, Holm S, Kozerke S, Nordsletten D. Mapping neural circuitry at high speed (10hz) using functional magnetic resonance elastography (fmre). in ISMRM 26th Annual Meeting. 2018.
9. Patz S, N.N., Earborne P. Functional neuroimaging in the brain using magnetic resonance elastography. in Proceedings of International Society of Magnetic Resonance in Medicine. 2017.
10. Patz S, S.K., Muradyan I, Kyriazis A, Wuerfel J, Mukundan S, Sinkus R. Observation of Functional Magnetic Resonance Elastography (fMRE) in Mouse Brain. in Proceedings of International Society of Magnetic Resonance in Medicine. 2015.
11. Lan, P.S., et al., Imaging brain function with simultaneous BOLD and viscoelasticity contrast: fMRI/fMRE. Neuroimage, 2020. 211: p. 116592.
12. Boynton G M, E.S.A., Heeger D J, Linear systems analysis of the fMRI signal. Neuroimage, 2012. 62(2): p. 975-84.
13. Chiacchiaretta P, R.G., Ferretti A, Sensitivity of BOLD response to increasing visual contrast: Spin echo versus gradient echo EPI. Neuroimage, 2013. 82: p. 35-43.
14. Henrie JA, S.R., LFP power spectra in V1 cortex: the graded effect of stimulus contrast. Journal of Neurophysiology, 2005. 94(1): p. 479-490.
15. Hadjipapas A, L.E., Roberts MJ, Peter A, De Weerd P., Parametric variation of gamma frequency and power with luminance contrast: A comparative study of human MEG and monkey LFP and spike responses. Neuroimage, 2015(112): p. 327-340.
Figures