5145
Testing the potential of DWI-based virtual elastography in patients with brain cancer1Department for Physics and Computational Radiology, Oslo University Hospital, Oslo, Norway, 2Department for Physics, University of Oslo, Oslo, Norway, 3Universitat Politècnica de València, BDSLab, Instituto Universitario de Tecnologías de la Información y Comunicaciones, València, Spain, 4Department for Radiography, Oslo University Hospital, Oslo, Norway, 5Department for Radiology, Oslo University Hospital, Oslo, Norway
Synopsis
Keywords: Elastography, Elastography
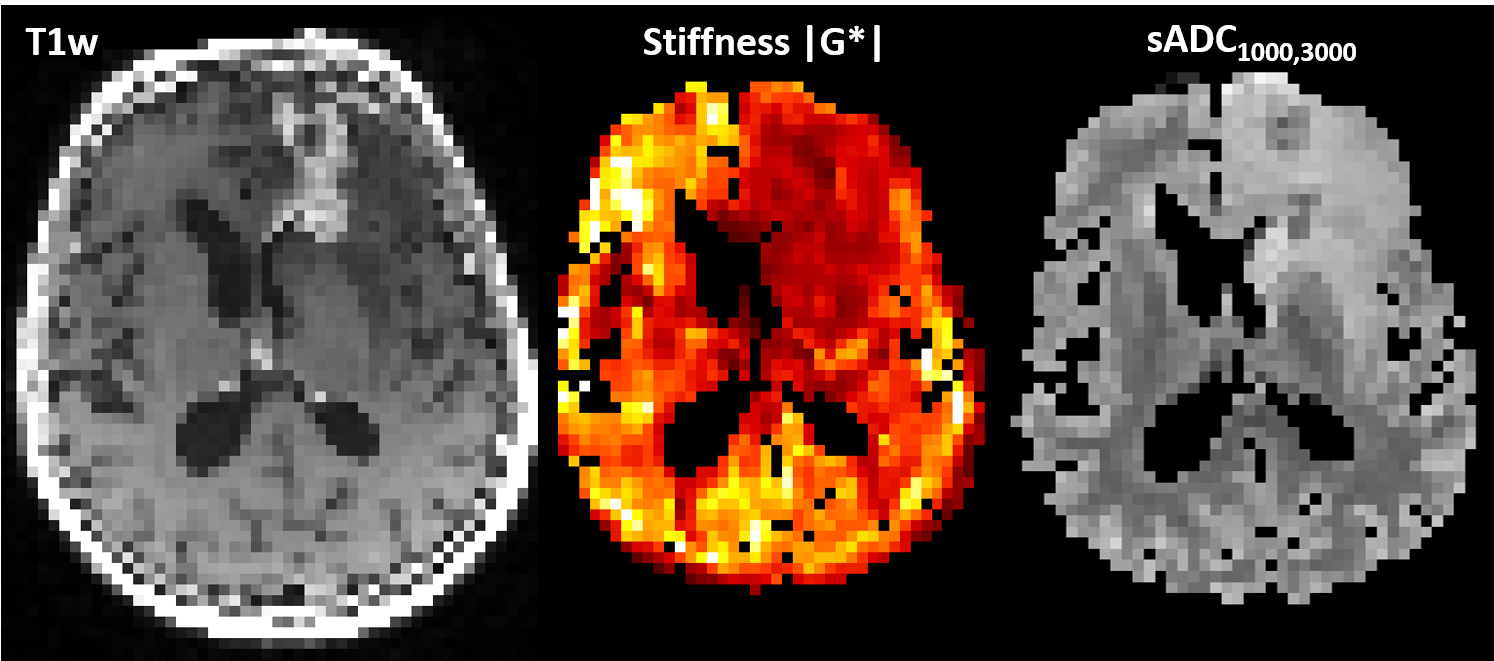
A previous study in the liver suggested that DWI can be used for virtual elastography. Here, we investigate the potential correlations between DWI-derived parameters and MR elastography (MRE) stiffness measurements in sixteen patients with brain cancer. The highest cross-correlation was obtained between stiffness and the shifted ADC map with b-values 1000 and 3000 s/mm² (median cross correlation 0.91). However, no correlation between mean values of MRE and sADC1000,3000 was found in normal-appearing white and gray matter, nor in tumor regions. This could be due to a too simple diffusion model and the anisotropic tissue structure of the brain.Background:
MR Elastography (MRE) is used to quantify tissue stiffness, but requires special hardware and software. In the liver, a study by Bihan et al. suggested that diffusion-weighted imaging (DWI) can provide measures correlated to the shear stiffness1. In their study, a shifted apparent diffusion coefficient (sADC) calculated using the b-values 200 and 1500 s/mm² showed a significant negative, linear correlation with shear stiffness. The authors concluded that DWI could provide a virtual elastography. Here, we investigate any correlation between potential DWI-derived parameters of stiffness and MRE measurements in patients with brain cancer.Methods:
Sixteen patients were included, (9 with newly diagnosed glioblastoma (nGBM), after tumor resection, 7 with recurrent glioblastoma (rGBM)). The study was approved by the Regional Ethics Committee. The exams were performed on a 3T GE Signa Premier MRI scanner.MRE was performed using a mechanical transducer vibrating at 50 Hz2. We used a multi-slice gradient-echo acquisition3 with 13 slices, 3 mm isotropic resolution, TE/TRslice=12/205 ms, and a 64 × 64 matrix size. We used motion-encoding 53 mT/m gradients of in three orthogonal directions, plus a reference scan without motion encoding. The MRE was reconstructed using a curl-based method4. The MRE reconstruction produces maps of stiffness |G*|, elasticity G’ and viscosity G’’.
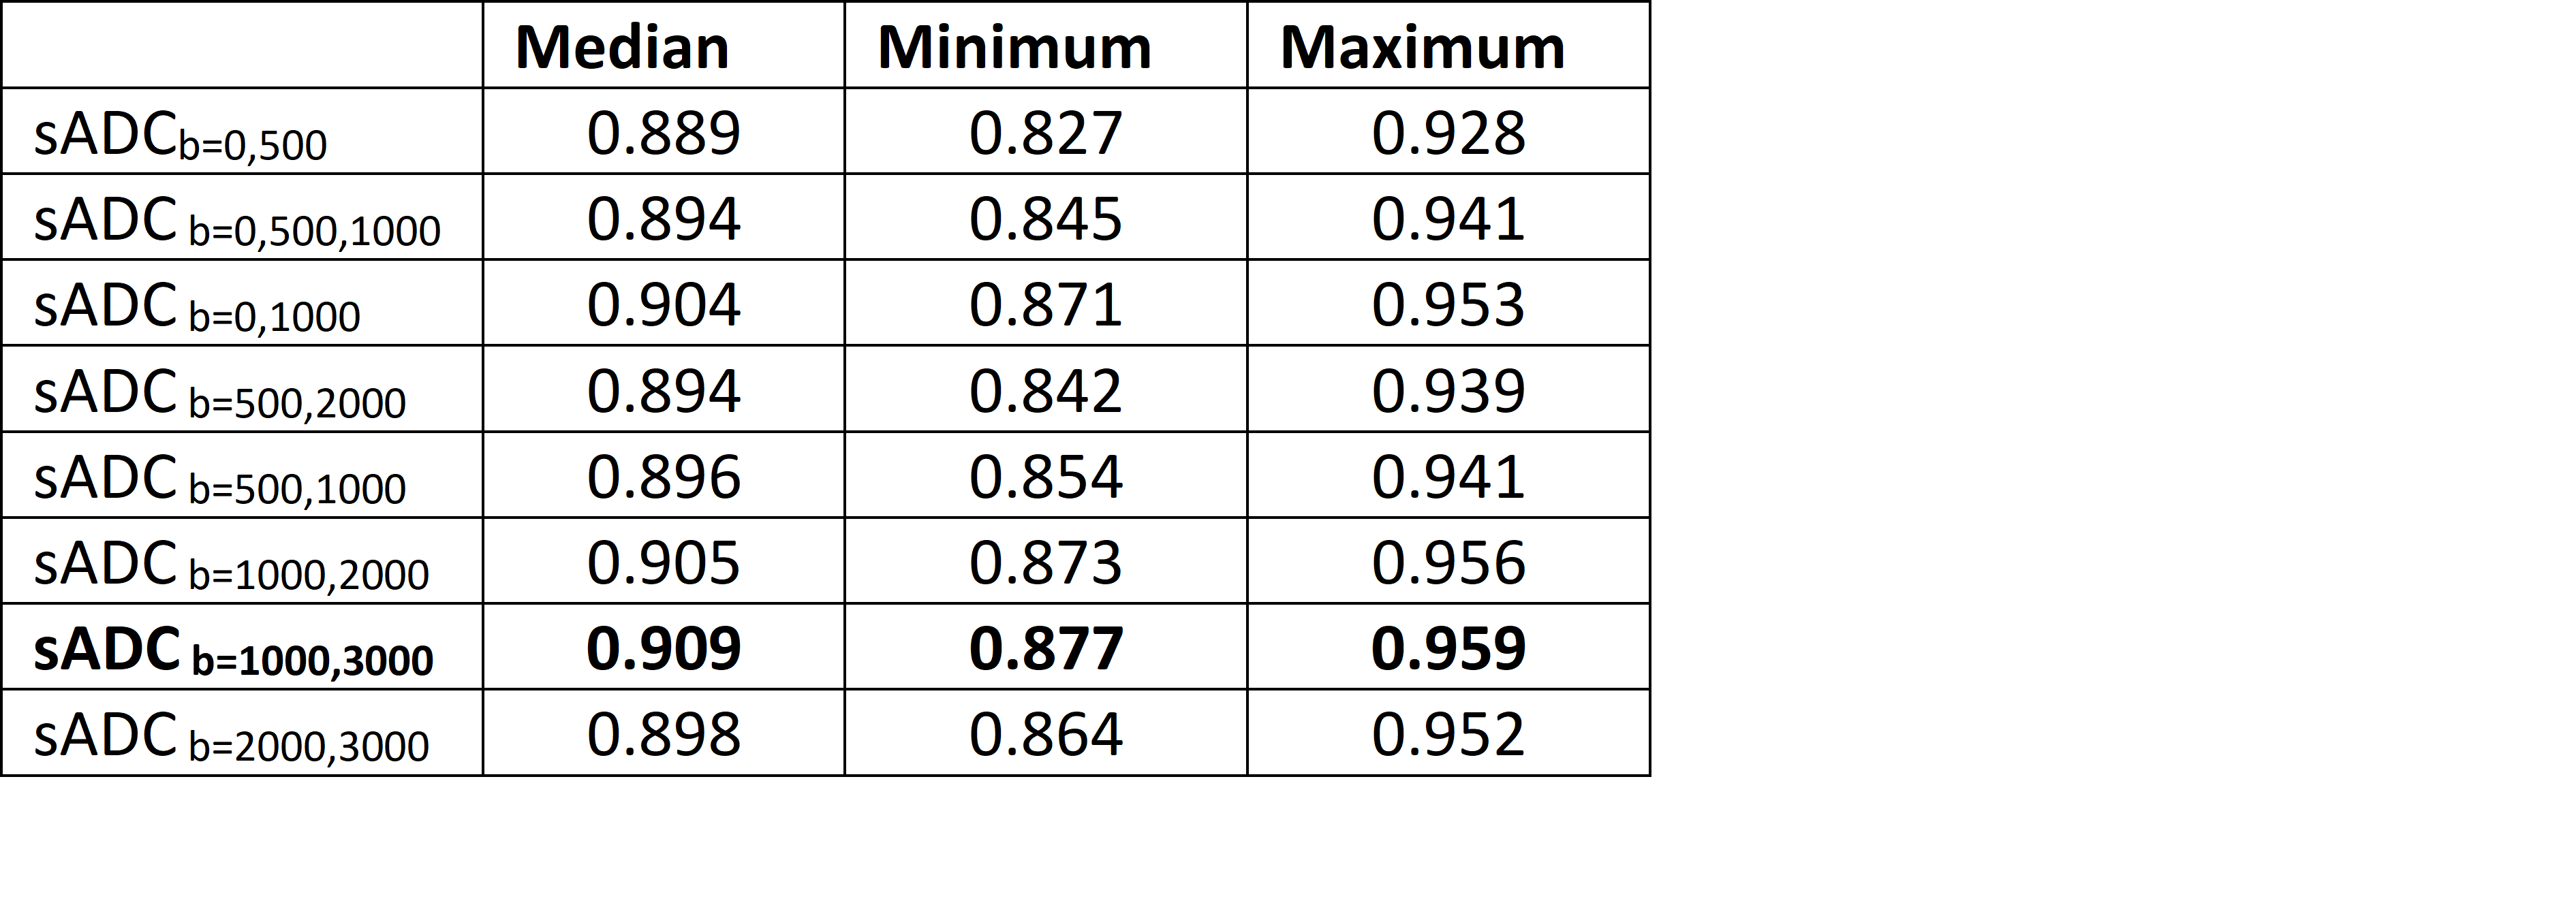
For the diffusion weighted sequence, a multishell acquisition was used, with the following b-values: 0 (4 directions), 500 (6 directions), 1000 (15 directions), 2000 (15 directions) and 3000 s/mm² (60 directions). The resolution was 2 mm isotropically with 69 slices, a 120x120 matrix and TE/TR=0.077/3300 ms. Preprocessing of DWI data included denoising, Gibbs compensation, eddy current, B0 distortion, and motion correction. sADC maps with the following combinations of b-values were calculated (all in s/mm²): 0 and 500; 0, 500 and 1000, 0 and 1000; 500 and 1000; 500 and 2000; 1000 and 2000; 1000 and 3000; 2000 and 3000 (Table 1).
In addition to DWI and MRE, the scan protocol included pre- and post-contrast T1-weighted scans, a T2-weighted scan and FLAIR-T2 MRI. . Using Oncohabitats5, we obtained tissue segmentations of contrast-enhancing tumor, normal-appearing gray and white matter, and cerebrospinal fluid, which were controlled by a radiologist.
Because MRE measurements are invalid in the fluid-filled ventricles, voxels containing mainly cerebrospinal fluid were removed from both MRE maps and diffusion maps before testing for similarities. To compare image similarities on a voxel level, diffusion maps were transformed to MRE space using ANTSapplytransform with nearest-neighbor interpolation. Similarities between MRE maps and diffusion maps in each patient were calculated using ANTs MeasureImageSimilarity, using the cross-correlation metric.
Mean values of the MRE and DWI map with the highest correlation were then calculated in the following regions: normal-appearing gray and white matter, contrast-enhancing tumor for rGBM, and a peritumoral region between 5 mm and 10 mm away from the resection cavity for nGBM.
Results:
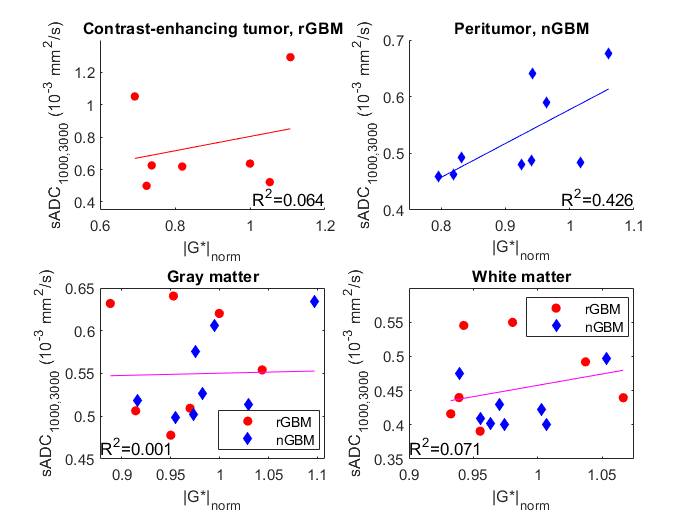
For all patients and all sADC maps, the highest cross-correlation with MRE measures was found with the stiffness |G*|, which will be reported on subsequently. The highest cross-correlation was obtained between |G*| and the sADC map with b-values 1000 s/mm² and 3000 s/mm² (sADC1000,3000) with a median cross correlation of 0.909 (range 0.877-0.959) (Table 1 and Figure 1). sADC1000,3000 had higher cross-correlation to stiffness than the clinical ADC (p<0.01).Figure 2 shows mean values of stiffness and sADC1000,3000 in normal-appearing gray and white matter, and tumor and peritumor for rGBM and nGBM, respectively. A linear regression between stiffness and sADC1000,3000 explain little of the variation in the data (Figure 2). The R2 of linear fits ranged from 0.001 in gray matter to 0.426 in peritumor for nGBM. Using a Spearman rank correlation test, no correlation between mean values of MRE and sADC1000,3000 was found in any of the regions.
Discussion:
Considering voxel-by-voxel, we found a high cross-correlation between stiffness and shifted ADC maps.As sADC1000,3000 decreases with higher cellularity, we expect any correlation between stiffness and sADC1000,3000 to be negative, as Bihan et al. reported in the liver. However, no significant correlations between mean values in pathologic and normal-appearing regions were observed. Any trend in the plots is toward a positive rather than a negative correlation.
There are several differences between our study and the previously reported study in the liver1. In our study, we did not use the exact same b-values as Bihan et al. We found the best cross-correlation with stiffness at b=1000, and b=3000. The high correlation found in the liver study (R2=0.89) may be attributed to the larger differences in liver stiffness between patients compared to the relatively subtle differences in brain tissue stiffness. The MRE reconstruction technique assumes tissue isotropy in both studies. Compared to liver tissue, this assumption is more violated in the brain, because of the white matter tracts. The anisotropy of the brain might contribute to the lack of correlation between stiffness and sADC1000,3000.
A relationship between tissue stiffness and water diffusion is expected, but a simple mono-exponential model of diffusion using only two b-values is unable to capture any correlation in the patients with brain cancer.
Conclusion:
Although DWI-derived sADC1000,3000 images show a high correlation with stiffness, DWI cannot replace MRE in the brain.Acknowledgements
We gratefully acknowledge support from the European Union’s Horizon 2020 Programme: ERC Grant [758657-ImPRESS], Marie Skłodowska-Curie grant [844646-GLIOHAB]; South-Eastern Norway Regional Health Authority [2017073, 2013069, 2021057]; The Research Council of Norway Grant [261984, 325971]; and the Spanish State Research Agency, Subprogram for Knowledge Generation [PROGRESS, No PID2021-127110OA-I00].References
1. Le Bihan D, Ichikawa S, Motosugi U. Diffusion and Intravoxel Incoherent Motion MR Imaging-based Virtual Elastography: A Hypothesis-generating Study in the Liver. Radiology. 2017; 285(2):609-619.
2. Runge JH, Hoelzl SH, Sudakova J, et al. A novel magnetic resonance elastography transducer concept based on a rotational eccentric mass: preliminary experiences with the gravitational transducer. Phys. Med. Biol. 2019; 64(4):045007.
3. Guenthner C, Sethi S, Troelstra M, Dokumaci AS, Sinkus R, Kozerke S. Ristretto MRE: A generalized multi-shot GRE-MRE sequence. NMR Biomed. 2019; 32(5):e4049.
4. Sinkus R, Tanter M, Xydeas T, Catheline S, Bercoff J, Fink M. Viscoelastic shear properties of in vivo breast lesions measured by MR elastography. Magn. Reson. Imaging. 2005; 23(2):159-165.
5. Juan-Albarracin J, Fuster-Garcia E, Manjon JV, et al. Automated glioblastoma segmentation based on a multiparametric structured unsupervised classification. PLoS One. 2015; 10(5):e0125143.
Figures