5140
Blind Source Separation Improves the Precision and Robustness of Self-Gated Motion Extraction in Free-Running 4D Whole-Heart MRI1Department of Radiology, Lausanne University Hospital (CHUV) and University of Lausanne (UNIL), Lausanne, Switzerland, 2CIBM Center for BioMedical Imaging, Lausanne, Switzerland, 3Cardiology Service, Cardiovascular Department, Lausanne University Hospital (CHUV) and University of Lausanne (UNIL), Lausanne, Switzerland
Synopsis
Keywords: Heart, Image Reconstruction
Several cardiac and respiratory motion-resolved free-running acquisition techniques have recently been developed, but automated self-gated motion extraction with principal component analysis (PCA) alone remains challenging and sometimes fails to correctly identify the components related to cardiac motion. We combined three blind source separation algorithms (fastICA, ICASSO and SOBI) with PCA and compared them with gold-standard ECG R-wave triggers in 10 healthy volunteers to determine the most precise and robust self-gated cardiac trigger extraction. Of these tested techniques, PCA combined with SOBI resulted in the lowest variability of the cardiac intervals relative to ECG intervals (p=0.03) and the sharpest images (p=0.03).Introduction
A free-running framework with self-gating1 was recently proposed to simplify cardiac examination by acquiring cardiac and respiratory motion-resolved whole-heart images without the need for ECG triggering or respiratory navigators.In fully self-gated free-running motion-resolved 5D MRI1, principal component analysis (PCA) has been used to extract the respiratory and cardiac motion states from the repeated superior-inferior (SI) projection. PCA reduces data dimensionality and redundancy, which is not always sufficient to correctly extract the cardiac triggers from all data, and can thus be the cause of low-quality images with insufficiently resolved motion. In addition to PCA, blind source separation (BSS) techniques could be used to transform the input data into a set of components (sources) that are not known a priori2, theoretically improving the robust extraction of the motion states.
In this study, we implemented three BSS methods (fastICA, ICASSO, and SOBI) and PCA as the reference method1 for the extraction of cardiac self-gating signals from free-running data. We compared these to the gold-standard ECG to ascertain the most precise and robust technique for cardiac motion extraction in free-running self-gated whole-heart 4D MRI.
Methods
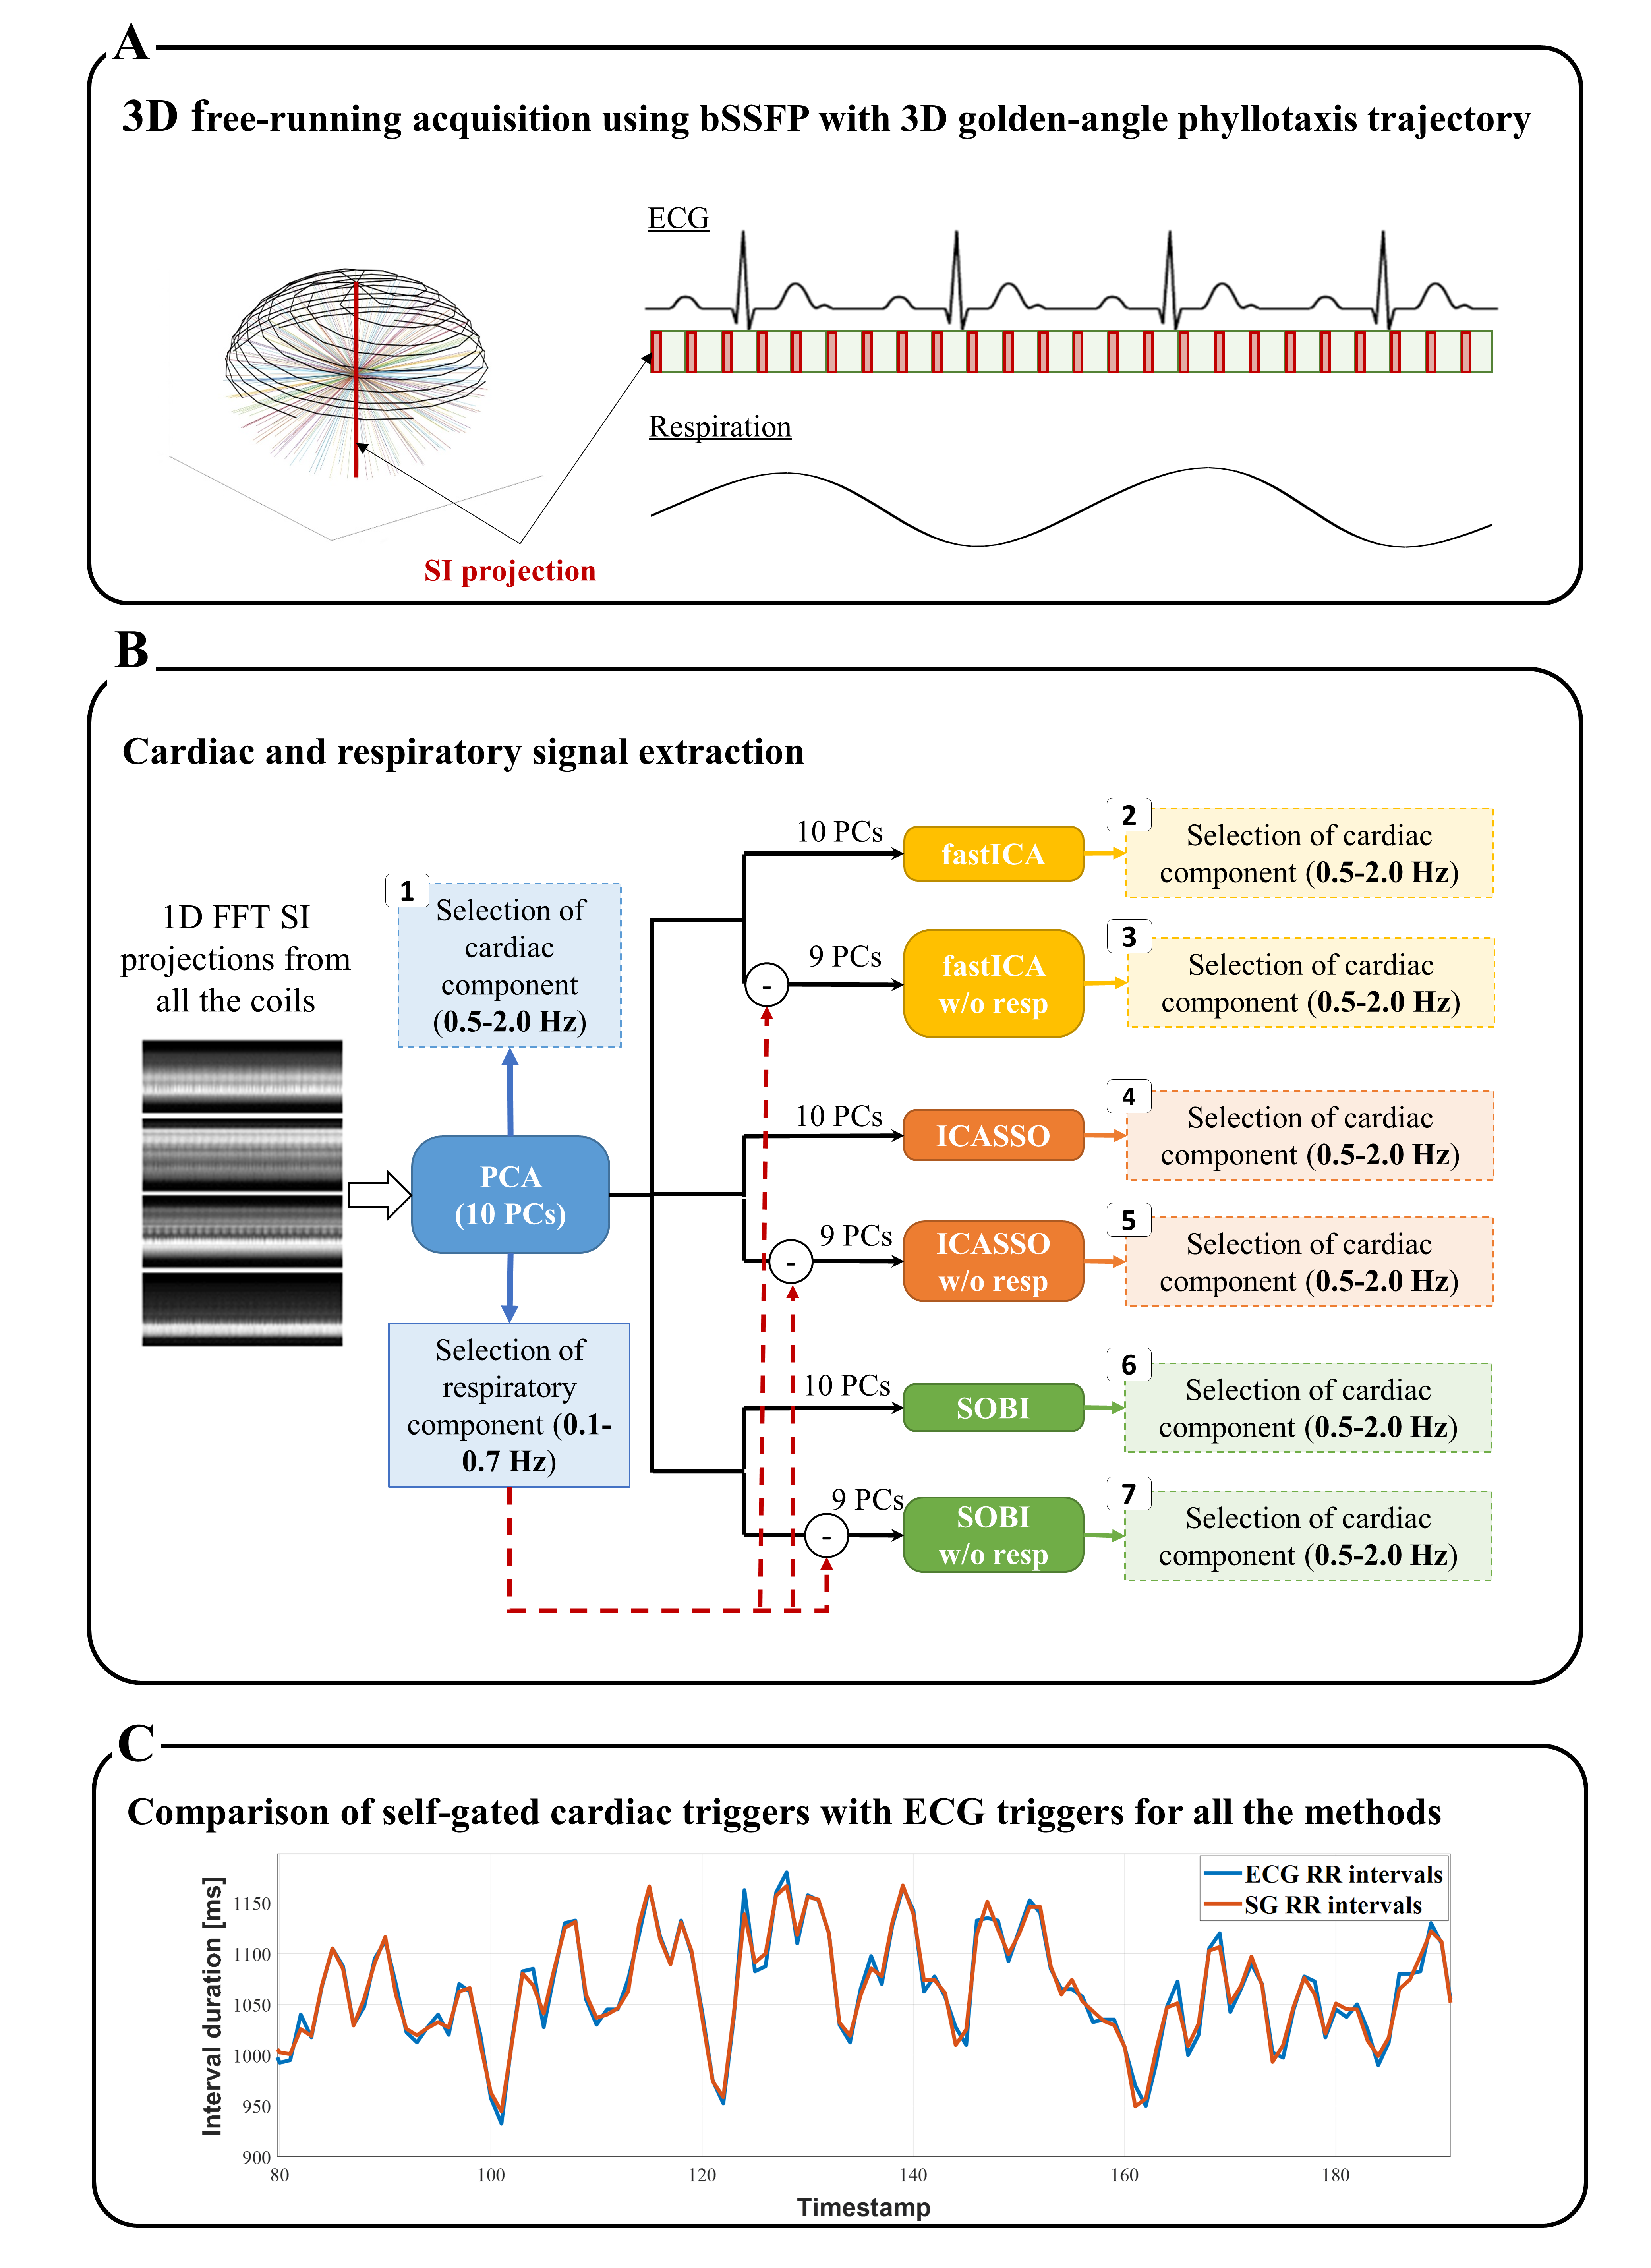
The study was performed on 10 healthy volunteers (27±3y, 7F) as approved by the local ethics committee. The volunteers were scanned on a 1.5T clinical scanner (MAGNETOM Sola, Siemens Healthcare) with a free-running bSSFP3 sequence (isotropic spatial resolution=1.4mm3, field of view=220mm) using a 3D golden-angle spiral phyllotaxis radial trajectory4 (Figure 1A).For motion extraction, PCA was always first applied to the 2D matrix of the Fourier‐transformed SI readouts5 to reduce it to a 10-dimensional space, as more than 90% of its variance was explained by the first 10 principal components. The respiratory motion component was always selected from these components.
Three BSS algorithms were implemented to extract cardiac motion from the 10 principal components. 1) fastICA2 is an independent component analysis (ICA) algorithm that calculates the estimated independent components by maximizing the non-Gaussianity of the input signals using an approximation of negentropy. 2) ICASSO6 iterates the fastICA algorithm with different initial conditions to find a better estimation of the independent components by analyzing their clustering in the signal space. 3) SOBI7 (second-order blind identification) is based on second order statistics and assumes temporally correlated sources with different spectral contents. The three BSS algorithms were also tested after first discarding the respiratory principal component (Figure 1B).
The precision of the cardiac trigger extraction was assessed by calculating the standard deviation σ of the difference between the estimated SG cardiac intervals and their corresponding ground-truth ECG intervals (Figure 1C). A repeated-measured ANOVA and Levene’s test were used to assess the differences, while a one-sided Bonett-Seier test8, a scale test for paired data, was used to test for lower dispersion and thus robustness.
The reference method (PCA) and the method that yielded the lowest difference with ECG triggering were retained. Whole-heart 4D images were reconstructed with both methods in 3 healthy volunteers and 3 patients referred for clinical CMR (58±7y, 7F).
The respiratory motion was corrected using fNAV9 and 4D images were reconstructed using compressed sensing10. The sharpness of images resulting from each signal extraction algorithm was quantified by the average slope of a sigmoid function fit to five manually placed lines perpendicular to the blood pool-myocardium interface11.
Results
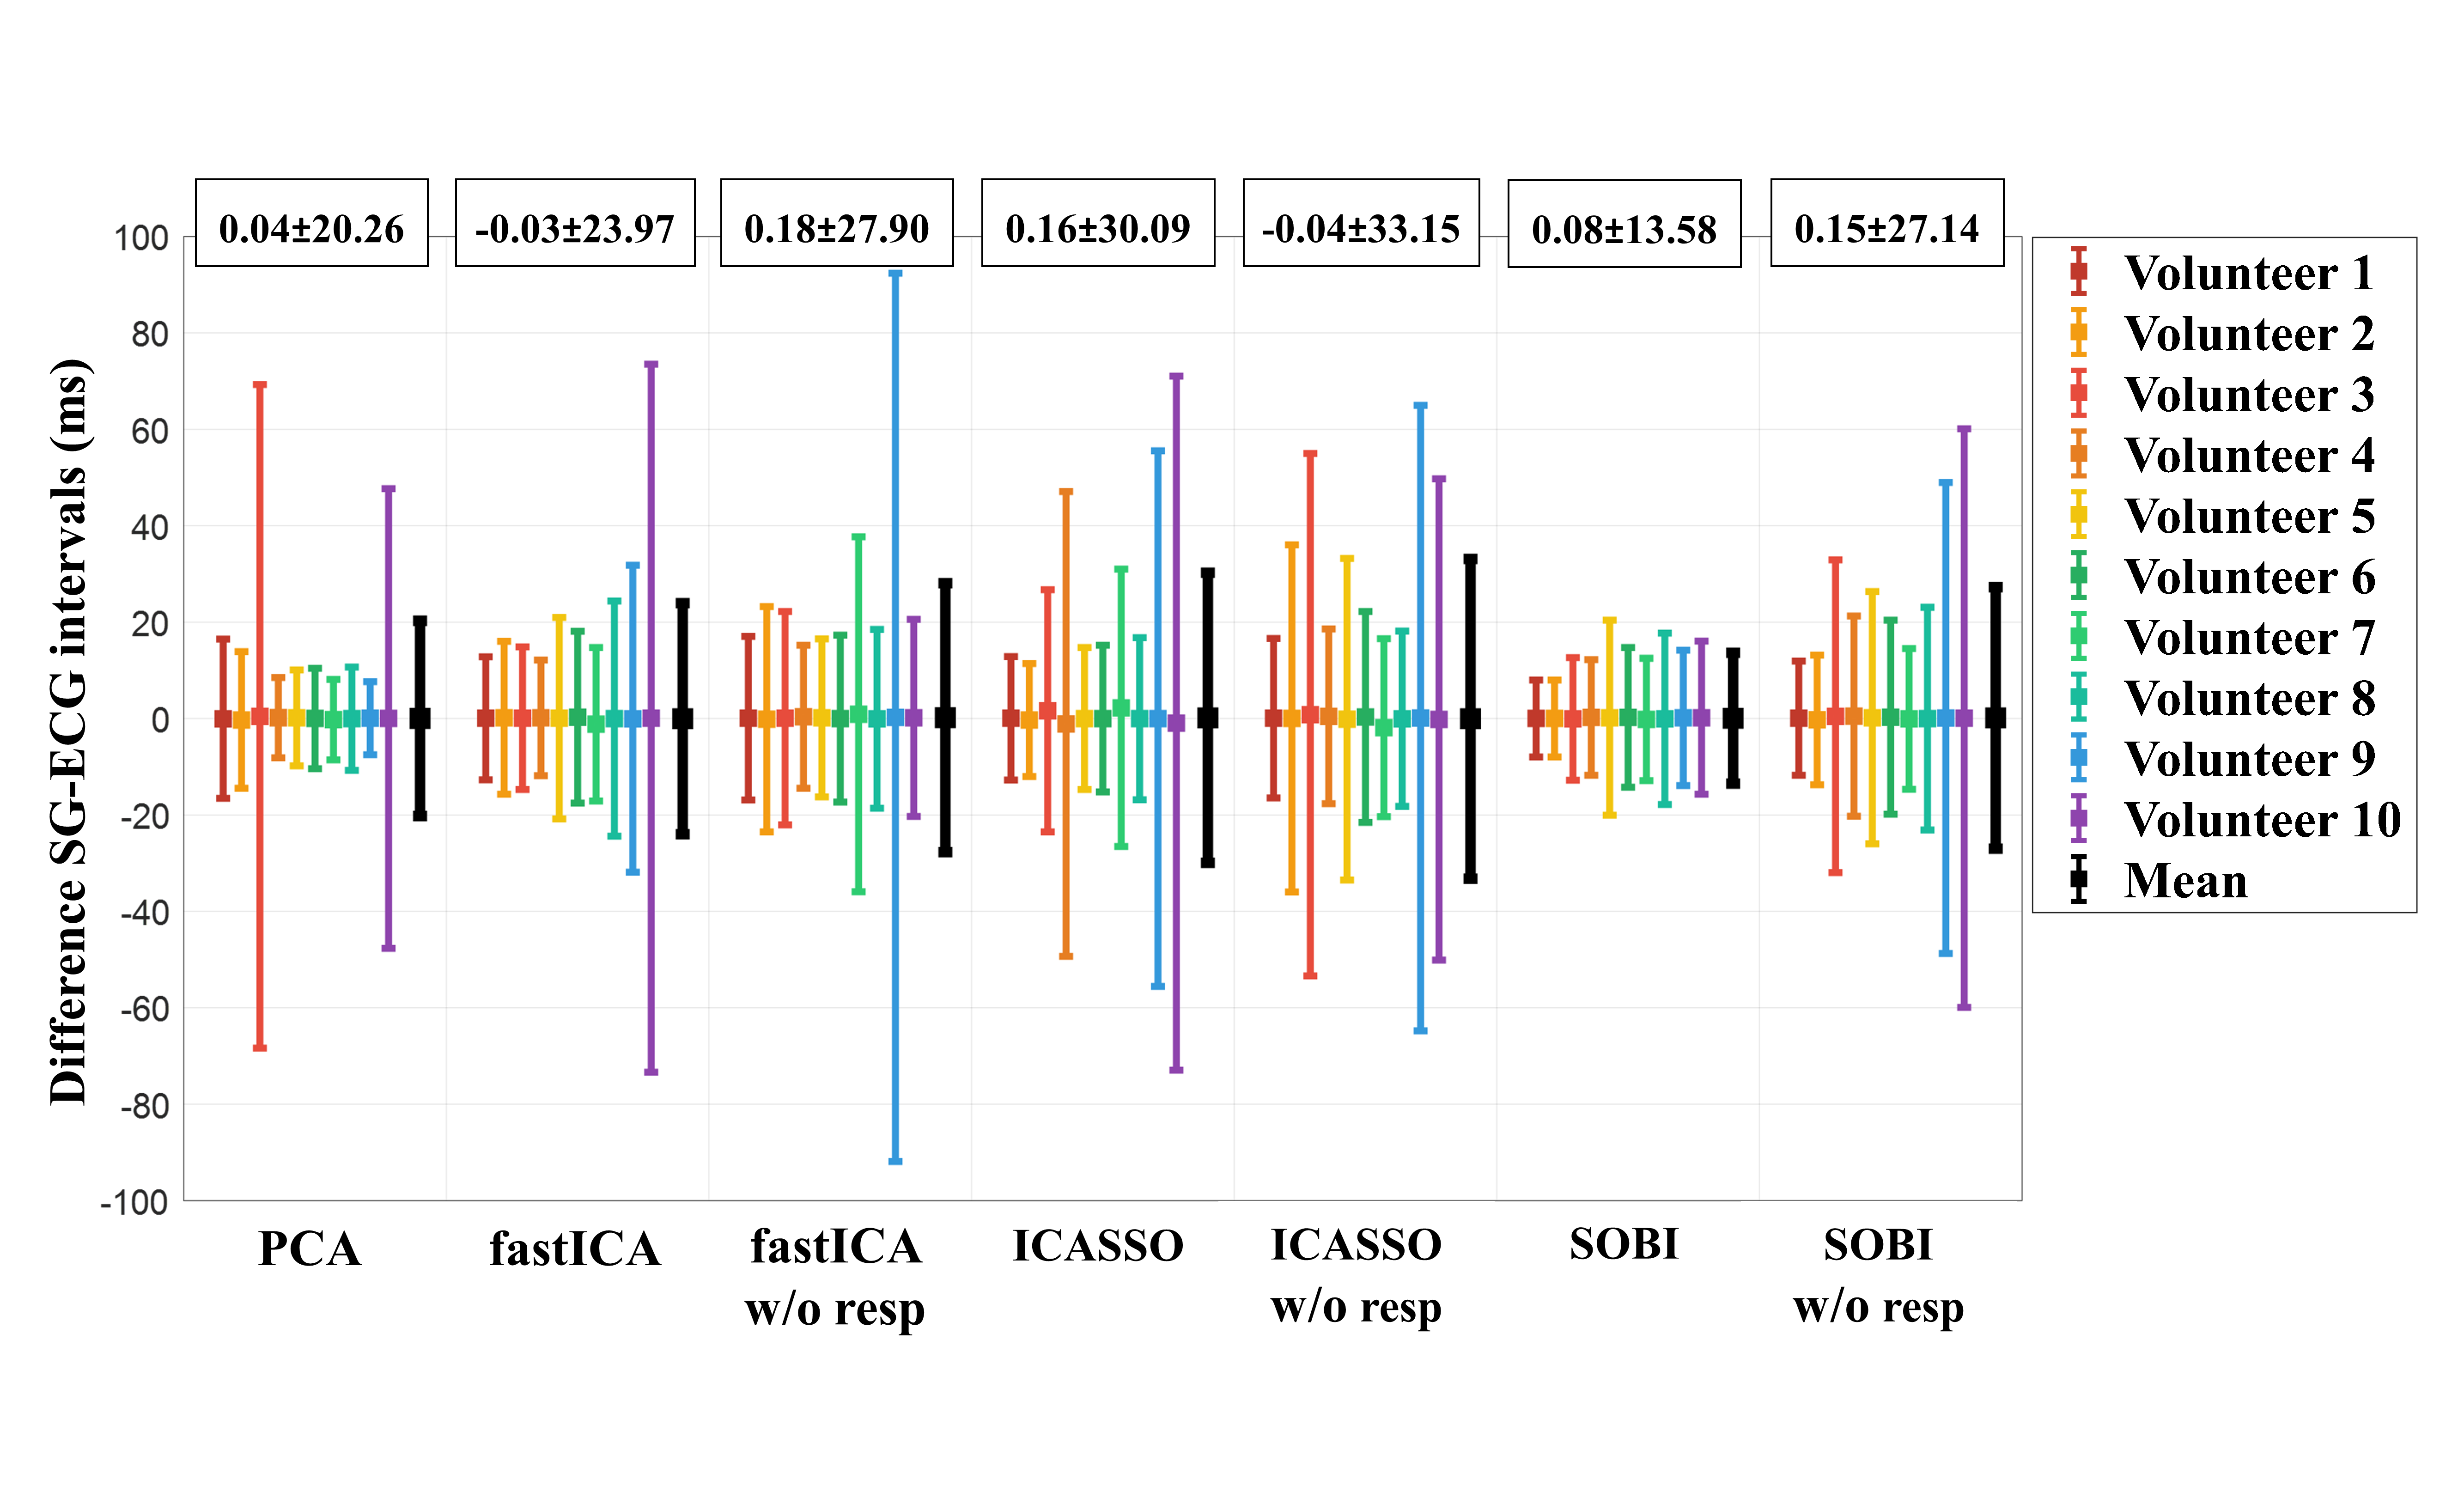
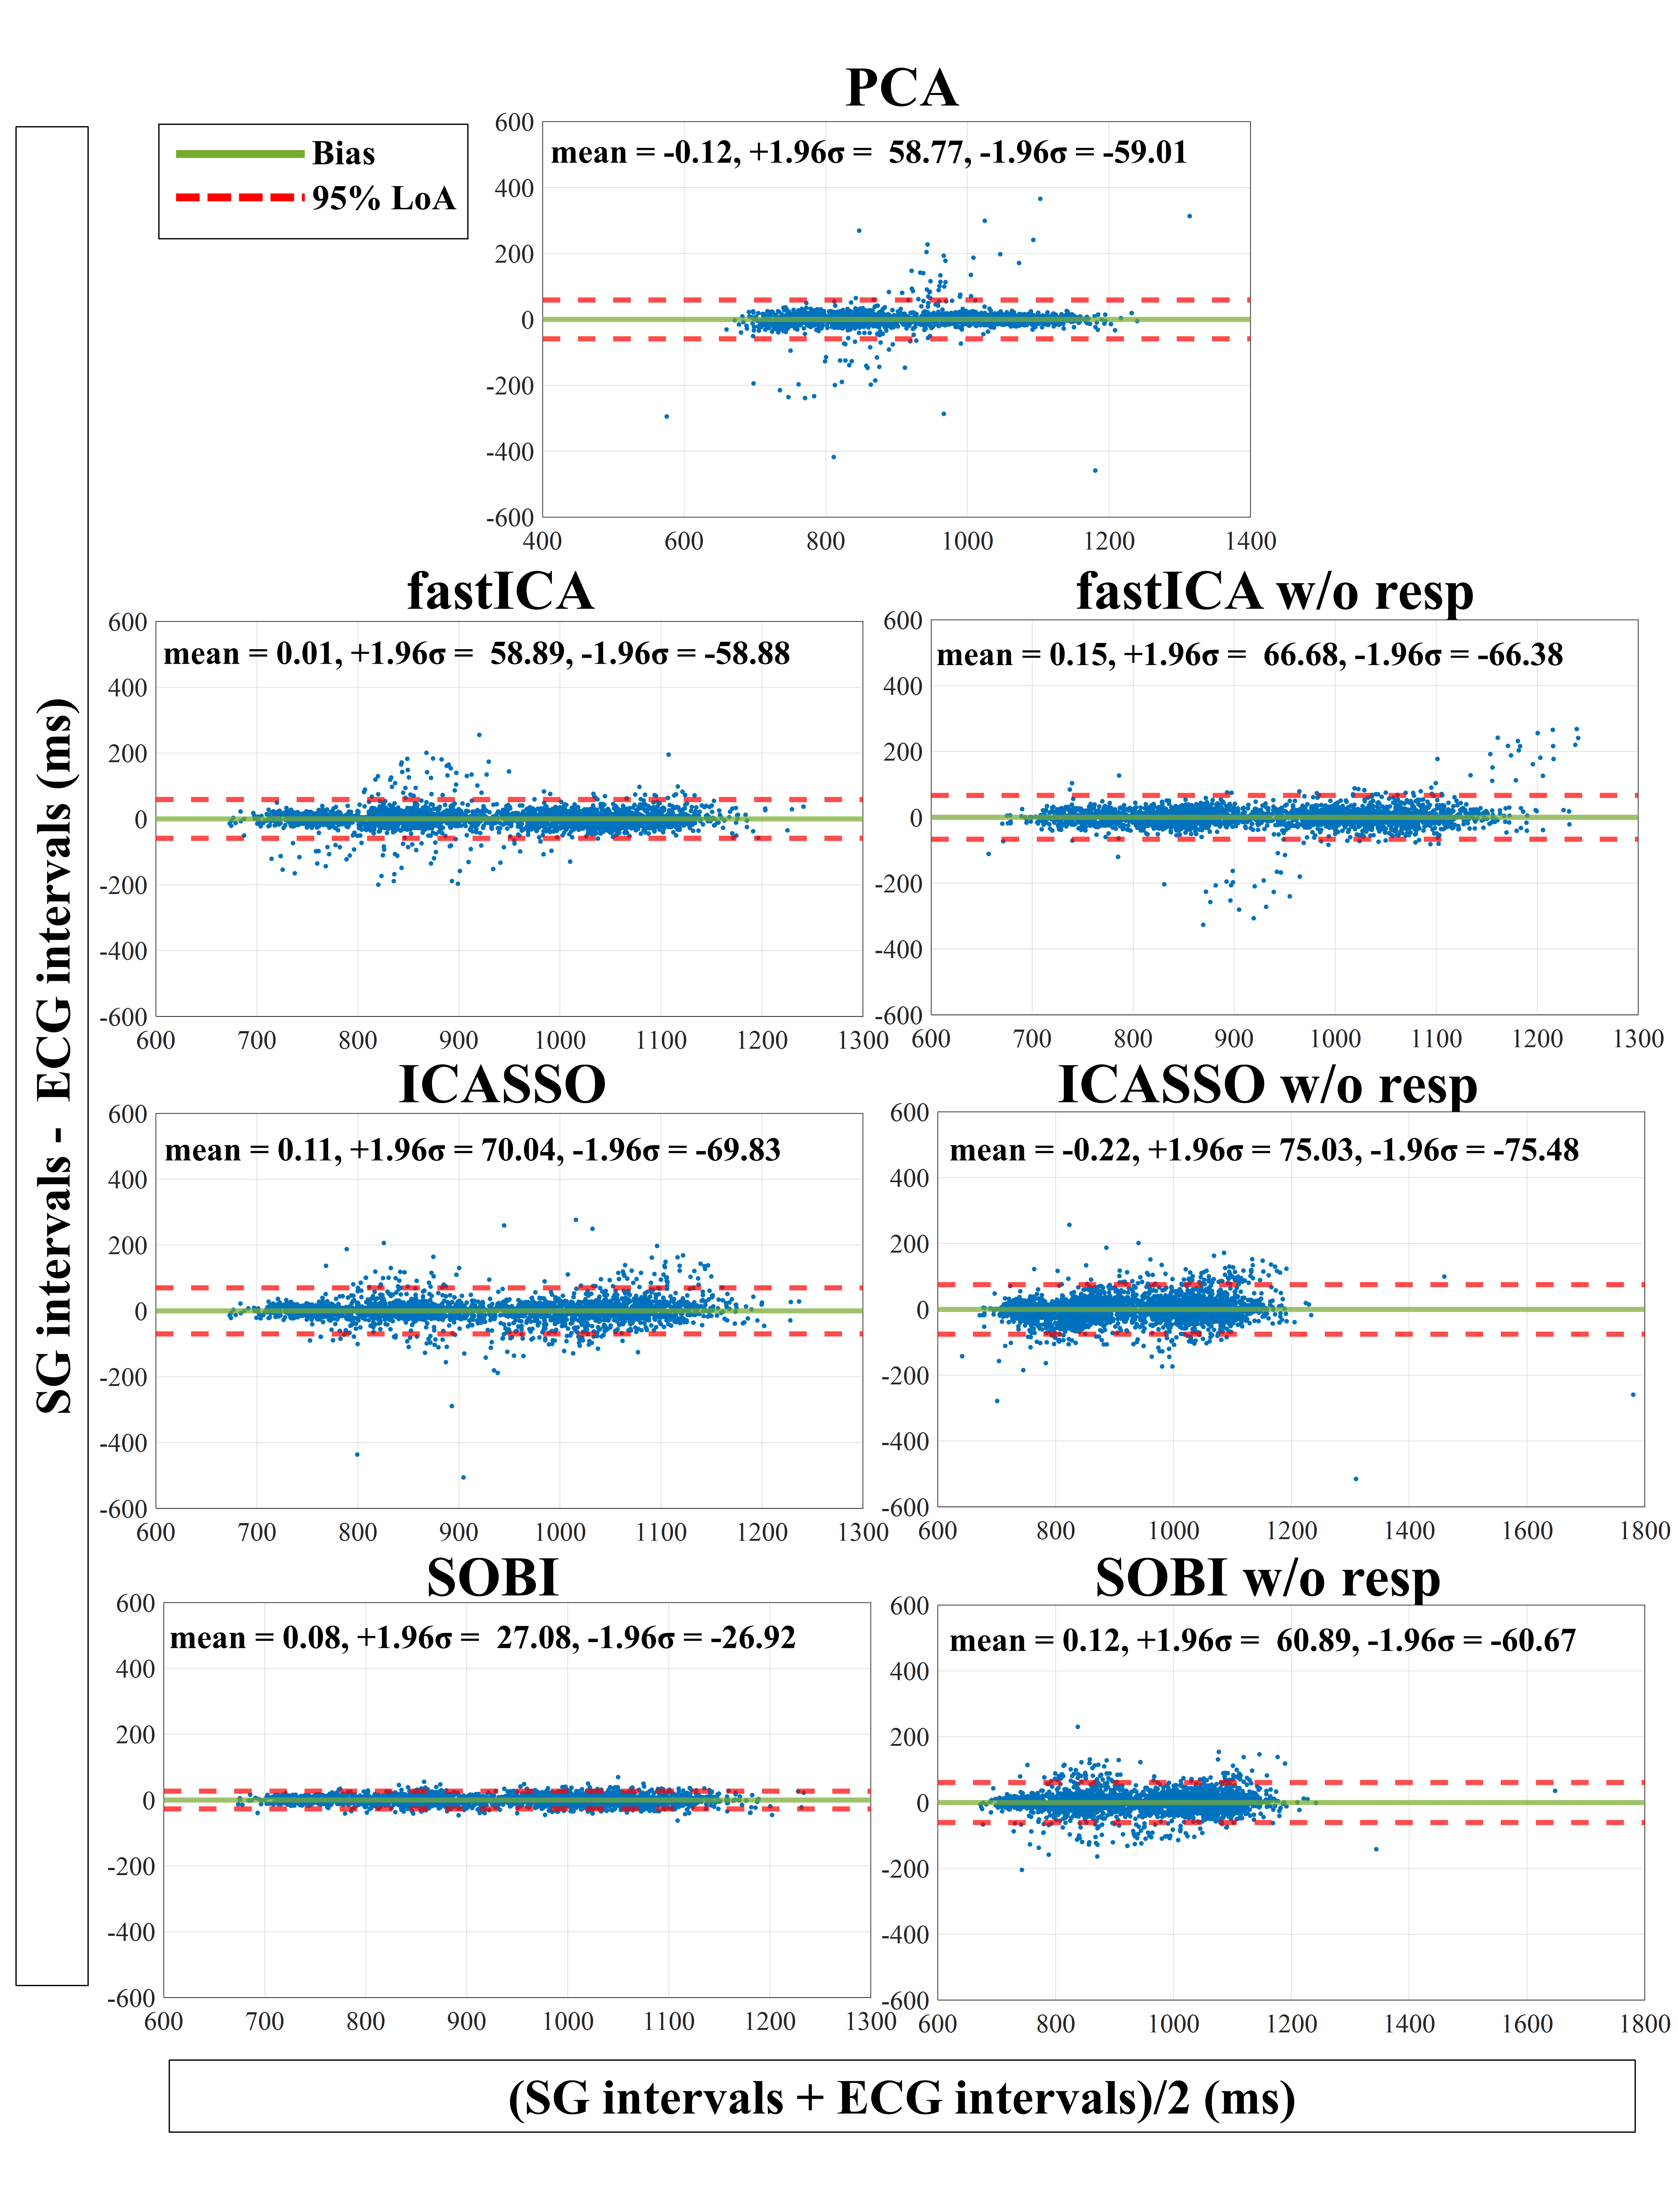
The precision (1/σ) in the estimation of the SG intervals (Figure 2) improved most when applying SOBI after PCA instead of PCA only (σSOBI=13.6±3.9ms and σPCA=20.3±20.8ms, p=0.03). The precision did not significantly improve for the other tested methods.The differences in standard deviations were statistically significant (p=0.045) and Bland-Altman analyses (Figure 3) demonstrated higher agreement in SOBI relative to the rest of the methods.
In general, the precision of the SG cardiac intervals worsened when discarding the respiratory component before applying the BSS techniques (Figure 2, 3).
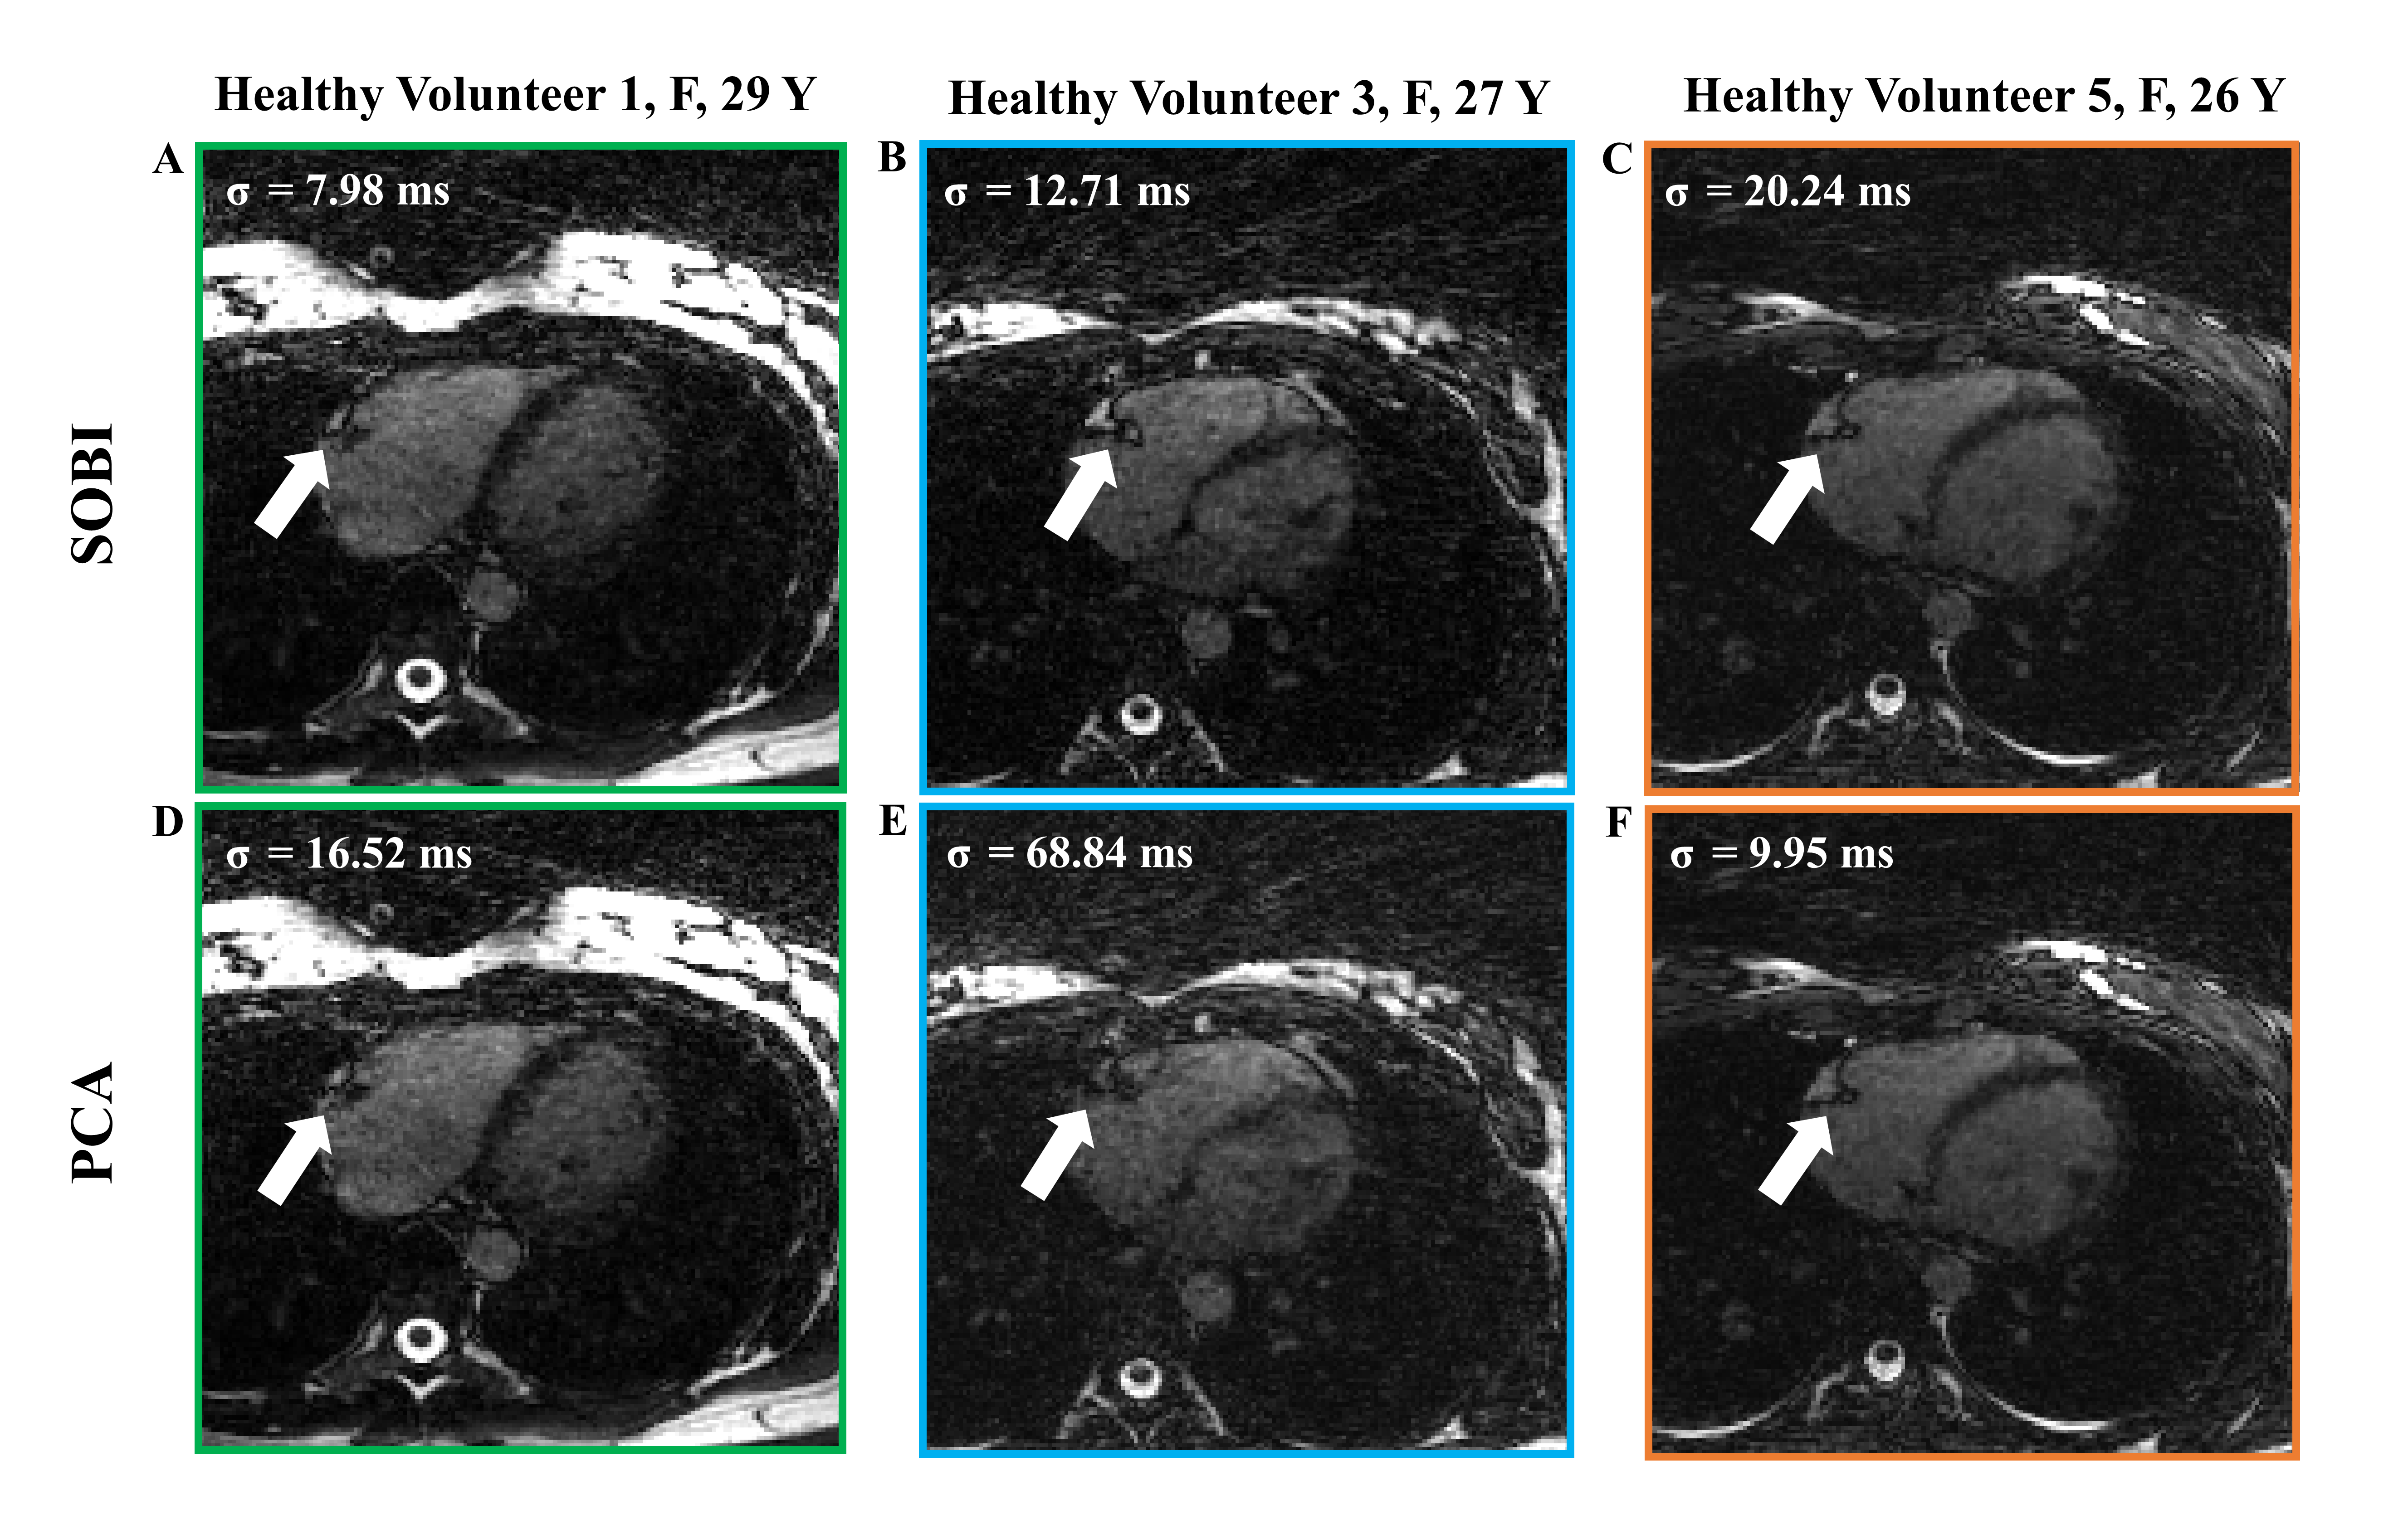
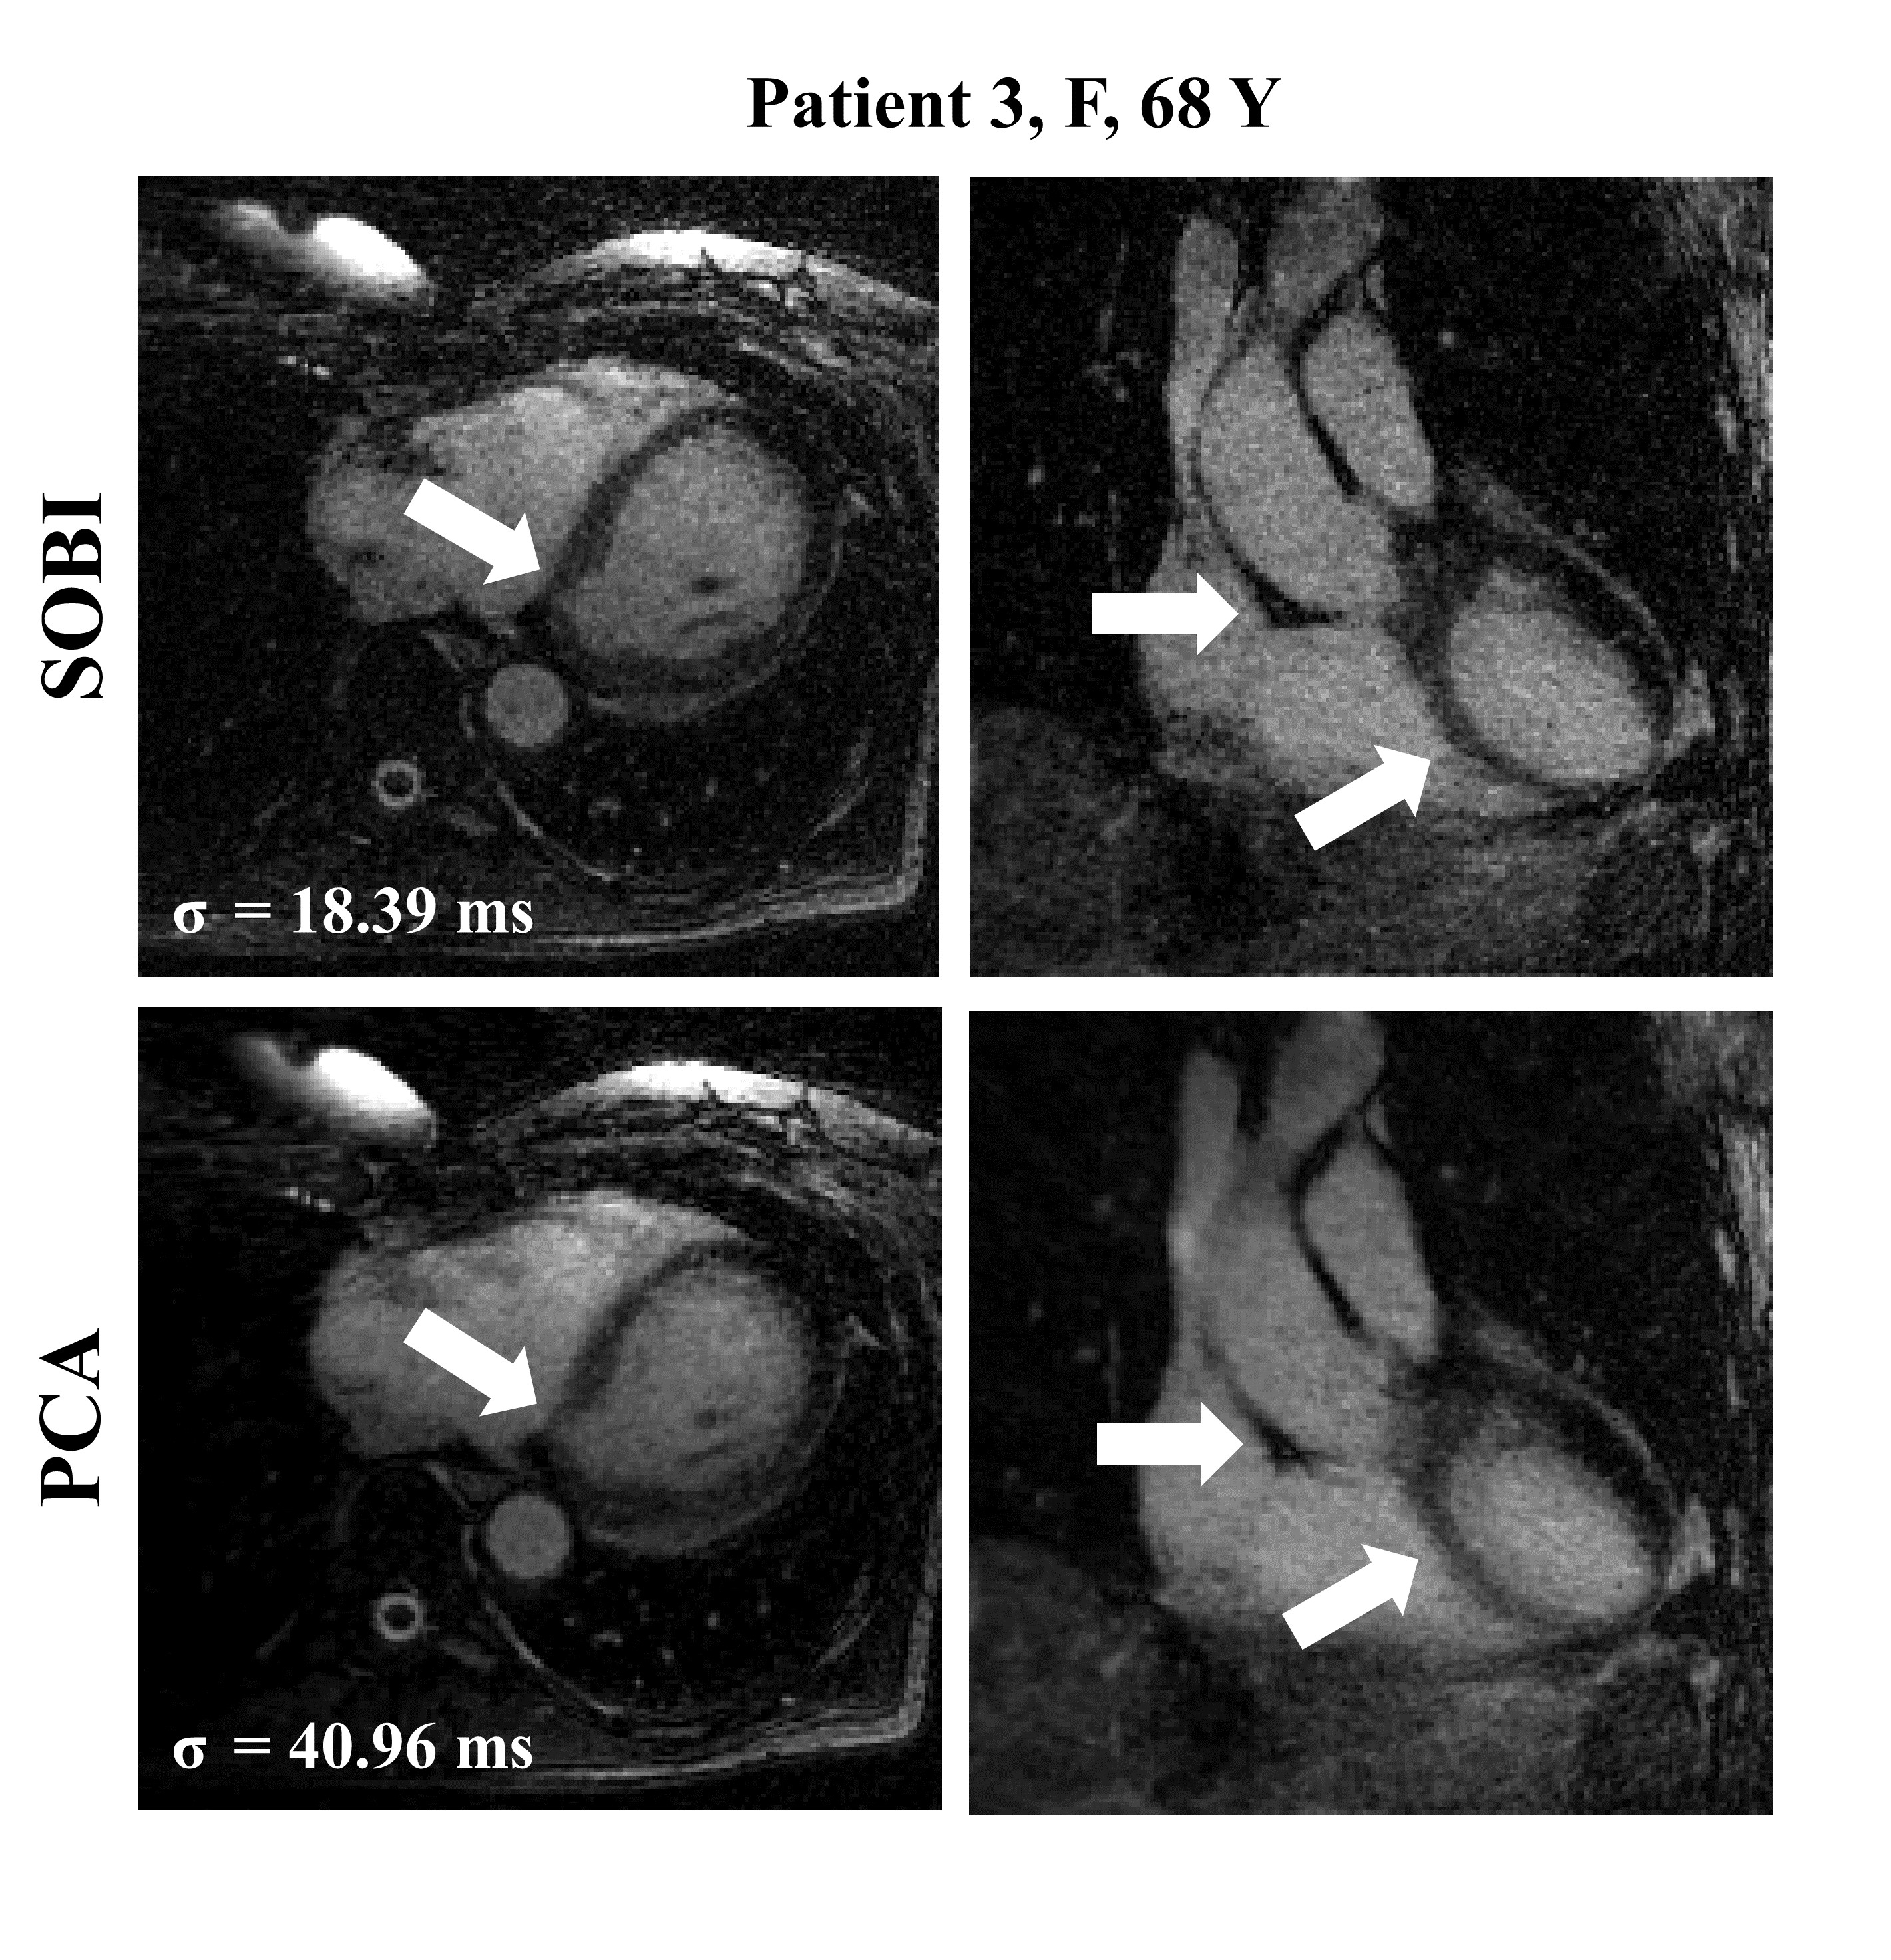
The left-ventricular blood-myocardium sharpness was higher when using SOBI (6.8±2.6) than when using PCA (5.9±2.7, p=0.03), which coincide with the visual inspection of the reconstructed images (Figure 4, 5).
Discussion
We successfully compared 7 algorithms for extracting cardiac self-gating signals from a repeated readout in a free-running whole-heart MRI acquisition. We demonstrated that using the first 10 principal components with the BSS technique SOBI improved the estimation of the SG cardiac intervals. The methods based on ICA (fastICA and ICASSO) did not improve upon the reference method. These algorithms are based on the independence of the estimated sources, and respiratory and cardiac motion are at least partially dependent12. SOBI however relies on the temporal correlation of the source signals and their different spectral contents, which is a representative feature of respiratory and cardiac motion.The removal of the dominant respiratory component surprisingly but consistently diminished the precision of the SG intervals estimation. Removing this component from the data likely caused the elimination of important features related to the cardiac motion, worsening the estimation of the SG intervals.
Conclusion
In this study, we demonstrated that the use of SOBI for the extraction of self-gated cardiac triggers from free-running image data improves the precision and robustness of the cardiac interval estimation and the sharpness of the resulting images.Acknowledgements
No acknowledgement found.References
1. Di Sopra L, Piccini D, Coppo S, Stuber M, Yerly J. An automated approach to fully self‐gated free‐running cardiac and respiratory motion‐resolved 5D whole‐heart MRI. Magnetic resonance in medicine. 2019 Dec;82(6):2118-32. doi: 10.1002/mrm.27898
2. Hyvärinen A, Oja E. Independent component analysis: algorithms and applications. Neural networks. 2000 Jun 1;13(4-5):411-30. doi: 10.1016/S0893-6080(00)00026-5
3. Coppo S, Piccini D, Bonanno G, Chaptinel J, Vincenti G, Feliciano H, Van Heeswijk RB, Schwitter J, Stuber M. Free‐running 4D whole‐heart self‐navigated golden angle MRI: initial results. Magnetic resonance in medicine. 2015 Nov;74(5):1306-16. doi: 10.1002/mrm.25523
4. Piccini D, Littmann A, Nielles‐Vallespin S, Zenge MO. Spiral phyllotaxis: the natural way to construct a 3D radial trajectory in MRI. Magnetic resonance in medicine. 2011 Oct;66(4):1049-56. doi: 10.1002/mrm.22898
5. Piccini D, Littmann A, Nielles‐Vallespin S, Zenge MO. Respiratory self‐navigation for whole‐heart bright‐blood coronary MRI: methods for robust isolation and automatic segmentation of the blood pool. Magnetic resonance in medicine. 2012 Aug;68(2):571-9. doi: 10.1002/mrm.23247
6. Himberg J, Hyvarinen A. Icasso: software for investigating the reliability of ICA estimates by clustering and visualization. 2003 IEEE XIII Workshop on Neural Networks for Signal Processing (IEEE Cat. No.03TH8718). 2003 Sep 17;259-68. doi: 10.1109/NNSP.2003.1318025
7. Belouchrani A, Abed-Meraim K, Cardoso JF, Moulines E. A blind source separation technique using second-order statistics. IEEE Transactions on signal processing. 1997 Feb;45(2):434-44. doi: 10.1109/78.554307
8. Bonett DG, Seier E. A test of normality with high uniform power. Computational statistics & data analysis. 2002 Sep 28;40(3):435-45. doi: 10.1016/S0167-9473(02)00074-9
9. Roy CW, Heerfordt J, Piccini D, Rossi G, Pavon AG, Schwitter J, Stuber M. Motion compensated whole-heart coronary cardiovascular magnetic resonance angiography using focused navigation (fNAV). Journal of Cardiovascular Magnetic Resonance. 2021 Dec;23(1):1-7. doi: 10.1186/s12968-021-00717-4
10. Lustig M, Donoho D, Pauly JM. Sparse MRI: The application of compressed sensing for rapid MR imaging. Magnetic Resonance in Medicine: An Official Journal of the International Society for Magnetic Resonance in Medicine. 2007 Dec;58(6):1182-95. doi: 10.1002/mrm.21391
11. Ahmad R, Ding Y, Simonetti OP. Edge sharpness assessment by parametric modeling: application to magnetic resonance imaging. Concepts in Magnetic Resonance Part A. 2015 May;44(3):138-49. doi: 10.1002/cmr.a.21339
12. Yasuma F, Hayano JI. Respiratory sinus arrhythmia: why does the heartbeat synchronize with respiratory rhythm? Chest. 2004 Feb 1;125(2):683-90. doi: 10.1378/chest.125.2.683
Figures