5121
Myelin Content Imaging Using Ultra-Short TE MRI with Variable Flip Angles1Biomedical Imaging Center, Beckman Institute, University of Illinois at Urbana-Champaign, Urbana, IL, United States, 2Department of Animal Sciences, University of Illinois at Urbana-Champaign, Urbana, IL, United States, 3Neuroscience Program, 2325/21, University of Illinois at Urbana-Champaign, Urbana, IL, United States, 4Carl R. Woese Institute for Genomic Biology, University of Illinois at Urbana-Champaign, Urbana, IL, United States, 5Division of Nutritional Sciences, University of Illinois at Urbana-Champaign, Urbana, IL, United States
Synopsis
Keywords: Relaxometry, Neuro, Myelin, Piglet
Myelin content was measured from the fast T1 relaxation component using bi-exponential T1 relaxation regression. The data was collected using UTE with variable flip angles to detect short T2 signal of myelin and to avoid magnetic susceptibility corruption by T2*-based myelin contrast methods. The estimated myelin content was influenced by CSF, which was suppressed by use of the slow T1 relaxation time. The estimated myelin content was higher in white matter than other brain regions. However, the myelin content was increased in the anterior pole and low in motor areas in this in-vivo piglet data.Introduction
Monitoring myelin content is important in studying brain development and disease pathogenesis [1]. Traditionally, myelin has been measured by T2* mapping using a 3-D gradient echo sequence with multiple echo times [2-4], but it can be corrupted by magnetic susceptibility. To avoid the magnetic susceptibility corruption, myelin content was measured by 3-D T1 mapping in this study [3]. T2 relaxation time of macromolecular protons of myelin can be shorter than 1 ms [3-5]. Therefore, the ultra-short echo time of UTE sequence should increase the sensitivity of the myelin signal when compared to other conventional sequences generated with longer echo times [4-7]. T1 relaxation time of myelin is expected to be faster than other brain signals [5]. Therefore, the MRI signal with fast T1 relaxation time is hypothesized to be contributed from myelin [5, 8, 9]. The faster and slower T1 relaxation times in each voxel can be estimated using biexponential regression from the UTE signals obtained at variable flip angles with a very short repetition time. Here we have tested this feasibility on an In-Vivo piglet brain using a 3D UTE sequence and biexponential T1 regression.Methods
The biexponential regression was performed at each voxel using Matlab’s lsqcurvefit function for the signal model of:S(t)=Mf*sinα*[1-exp(-TR/T1f)]/[1-cosα*exp(-TR/T1f)+Ms*sinα*[1-exp(-TR/T1s)]/[1-cosα*exp(-TR/T1s) (1)
where Mf and Ms represent the fast and slow magnetizations, T1f and T1s represent the fast and slow T1 relaxation times, TR is the repetition time, and a is the RF flip angle.
The fraction of magnetization with the fast T1 relaxation time, Q, was defined at each voxel as
Q = Mf / (Mf + Ms). (2)
In regression of Eq (1), several boundary conditions ofT1f and T1s were tried by assigning the maximum of T1f to 300, 500, and 700 ms. The minimum of T1s was assigned to 100ms above the maximum of T1f.
The contamination of CSF on Q was corrected by introducing a CSF suppression weight, β, that was estimated from the slow T1 relaxation time T1s at each voxel by the following equation:
β = cos[(T1s – T1smin) / (T1smax – T1smin)*π /2], (3)
where T1smax and T1smin represent the maximum and minimum of T1s over the brain, respectively.
We scanned one piglet (29 days old, body weight=13.5 kg, brain weight=42 g, male) and collected T1w, T2w, and UTE at 8 different using a 15-ch transceive knee RF coil at 3T. T1w and T2w were collected using 3-D MPRAGE and SPACE sequences, respectively. UTE was collected using a 3-dimensional RSD (rotation of spiral disc) sequence with variable flip angles of 2, 3, 4, 5, 7, 9,12, and 15 degrees [10]. Scan parameters of the UTE sequence were: TE=0.23 ms, TR=3.09 ms, field-of-view=128 mm, spatial resolution=0.8 mm isotropic, and 25,452 shots. Spatial resolution of T1w and T2w was 0.5 mm isotropic. Brain was segmented from the T1w image using 3D Slicer program and the brain images were aligned to AC-PC line using the piglet brain template [11].
Results
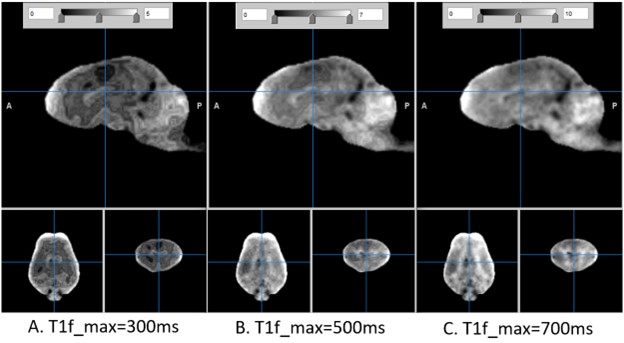
The T1w and T2w images are shown in Fig. 1 in comparison with the sum-of-square of UTE images. The UTE image was slightly less T1 contrasted than T1w. The estimated T1 relaxation time is shown in Fig. 2 for mono and bi-exponential regression of UTE images. The fraction of fast magnetization, Q, is shown in Fig. 3 with Mf and Ms. This Q map was corrected for contamination by CSF as shown in Fig. 4 using the T1s map. It was interesting to see how the fast magnetization fraction Q was sensitive to the boundary condition as demonstrated in Fig. 5. As the boundary condition was longer, a smoother transition in Q was observed.Discussion
The fraction of fast T1 magnetization, Q, was generally higher in white matter than gray matter. Moreover, Q was higher in white matter of cerebellum when compared to white matter of cerebra. However, Q was high in the anterior pole of frontal lobe, a finding which has not been previously reported. Therefore, we cautiously predict that Q could indicate a new measure of brain myelination or myelin water fraction and could be sensitive to the effect of environmental factors on brain maturation. The scan time can be minimized by collecting only 4 variable flip angles for biexponential regression in Eq. (1).Conclusion
UTE with variable flip angles was successfully applied to the separation of brain tissue into biexponential T1 relaxation with extremely short echo time. The fraction of the fast T1 relaxation was in line with expected white matter but reveals newer contrast in many regions. This will be further investigated to correlate the fraction of fast T1 with myelin content.Acknowledgements
No acknowledgement found.References
1. Mudd, A.T. and R.N. Dilger, Early-Life Nutrition and Neurodevelopment: Use of the Piglet as a Translational Model. Adv Nutr, 2017. 8(1): p. 92-104.
2. Du, Y.P., et al., Fast multislice mapping of the myelin water fraction using multicompartment analysis of T2* decay at 3T: a preliminary postmortem study. Magn Reson Med, 2007. 58(5): p. 865-70.
3. Piredda, G.F., et al., Probing myelin content of the human brain with MRI: A review. Magn Reson Med, 2021. 85(2): p. 627-652.
4. Ma, Y.J., et al., Volumetric imaging of myelin in vivo using 3D inversion recovery-prepared ultrashort echo time cones magnetic resonance imaging. NMR Biomed, 2020. 33(10): p. e4326.
5. Ma, Y.J., et al., Ultrashort echo time (UTE) magnetic resonance imaging of myelin: technical developments and challenges. Quant Imaging Med Surg, 2020. 10(6): p. 1186-1203.
6. Sheth, V., et al., Magnetic resonance imaging of myelin using ultrashort Echo time (UTE) pulse sequences: Phantom, specimen, volunteer and multiple sclerosis patient studies. Neuroimage, 2016. 136: p. 37-44.
7. Sheth, V.R., et al., Inversion recovery ultrashort echo time magnetic resonance imaging: A method for simultaneous direct detection of myelin and high signal demonstration of iron deposition in the brain - A feasibility study. Magn Reson Imaging, 2017. 38: p. 87-94.
8. Warntjes, M., et al., Modeling the Presence of Myelin and Edema in the Brain Based on Multi-Parametric Quantitative MRI. Front Neurol, 2016. 7: p. 16.
9. Labadie, C., et al., Myelin water mapping by spatially regularized longitudinal relaxographic imaging at high magnetic fields. Magn Reson Med, 2014. 71(1): p. 375-87.
10. Jung, K.-J. and B. Sutton. Three-dimensional sodium MRI using a rotation of spiral disc (RSD) trajectory. in Int Soc Magn Reson Med. 2021.
11. Stanke, K., et al., Automated identification of piglet brain tissue from MRI images 1 using Region-Based Convolutional Neural Networks. bioRxiv, 2021.
Figures
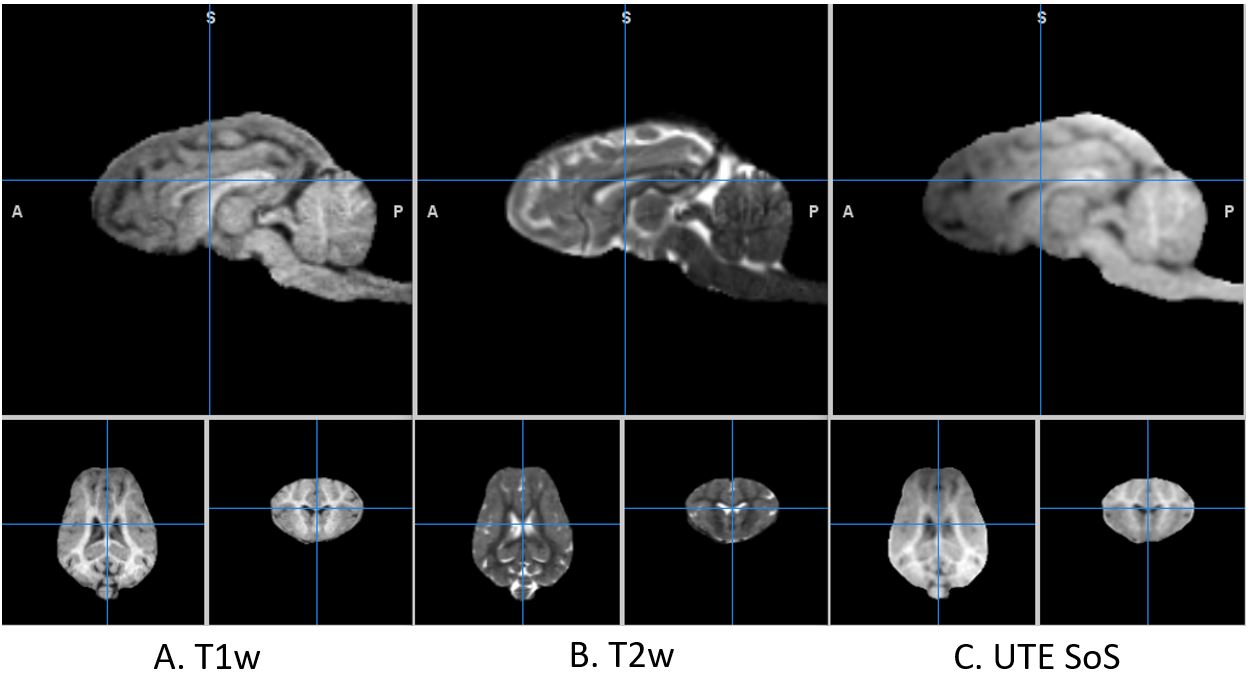
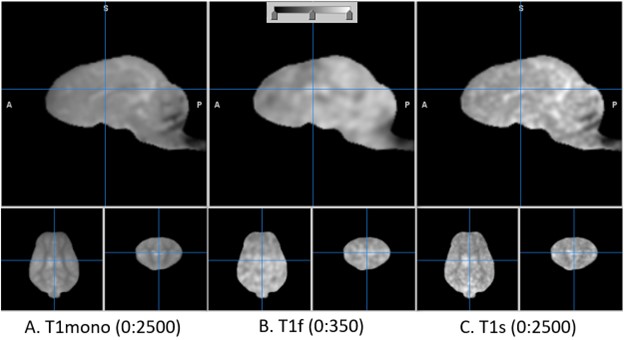
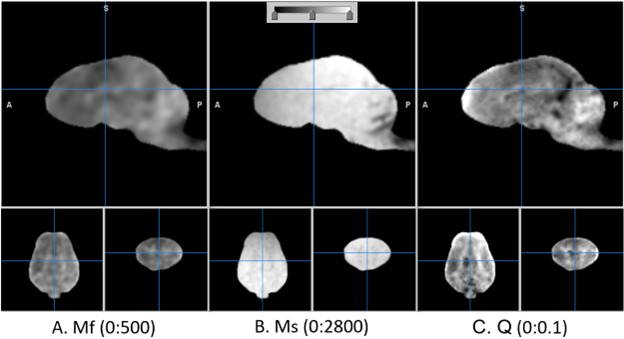
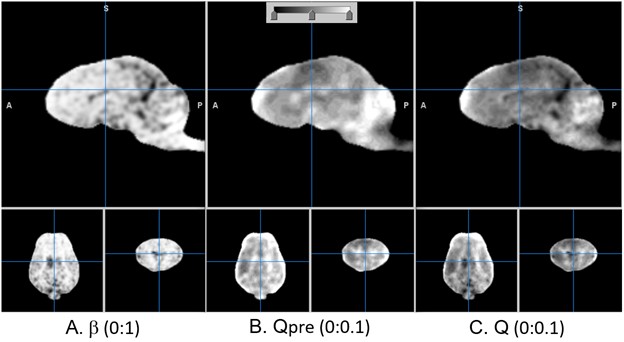
Figure 4. Suppression of CSF on T1f component fraction map Q. b is the CSF suppression factor that was multiplied to Qpre, resulting in Q. The boundary condition of biexponential regression was 700 ms. The numbers in the parentheses represent display window.