5113
Quantitative Ultrashort Echo-Time MRI to Assess In Vivo Rotator Cuff Tendon Degeneration1Radiology and Biomedical Imaging, University of California, San Francisco, San Francisco, CA, United States, 2UCSF-UC Berkely Graduate Program in Bioengineering, University of California, San Francisco, San Francisco, CA, United States, 3Department of Orthopaedic Surgery, San Francisco, CA, United States
Synopsis
Keywords: Tendon/Ligament, Quantitative Imaging
Rotator cuff tears are a common source of pain and disability. Surgical treatment is normally considered for patients who fail in non-operative management, but a failure of tendon healing after surgery can be dependent on tendon quality. In this work, we applied two ultrashort-echo time (UTE) quantification imaging methods, UTE T2* quantification as well as UTE magnetization transfer (MT) quantification, on healthy subjects and patients with rotator cuff tears, and evaluated their ability to assess tendon degeneration. Significant difference was observed for quantified T2* and MT parameters over segmented supraspinatus tendon between the healthy control and patient groups.Introduction
Rotator cuff tears are a common source of pain and disability in the upper extremity. Surgical treatment is normally considered for patients who fail in non-operative management, but a failure of tendon healing after surgery (retear) is a common complication1. One of important factors that influence surgical outcome is tendon quality2. Multiple studies demonstrated that ultrashort echo-time (UTE) T2* quantification can be useful in evaluating tendon degeneration3-4; bi-exponential T2* fitting has been also suggested to improve tendon characterization by separately assessing collagen-bound water and free water5. Whereas, quantitative UTE magnetization transfer (MT) imaging has been proposed for rotator cuff tendon evaluation because of its ability to measure macromolecule content (collagen) with less sensitivity to magic angle effects6-7. In this work, we performed UTE T2* mapping and UTE MT quantification on both healthy subjects and patients with rotator cuff tears to compare sensitivity of assessing tendon degeneration in in vivo shoulders.Methods
Six healthy subjects (age: 41.0±8.9 years) and five patients having a full-thickness tear in the supraspinatus tendon (age: 55.4±7.4 years) were imaged using a GE Signa Premier 3T scanner (GE Healthcare, Waukesha, WI) and a 16-channel shoulder-coil array after informed consent. After clinical 2D fast spin echo (FSE) acquisition, fat-suppressed coronal multi-echo 3D UTE Cones imaging8 was performed for T2* quantification using a 16 x 16 cm2 FOV, 0.8 mm in-plane resolution, 20 slices, 3 mm slice thickness, 15 TEs over 0.17-30 ms (5 TEs per one TR), 36 ms TR, 17° flip angle, and 11 min scan time. Quantitative UTE MT imaging was also performed using 3D UTE Cones with equivalent resolution and spatial coverage, by applying a Fermi-shaped MT saturation pulse and a fat suppression pulse every 12 spoke acquisition9. A 7° excitation flip angle, five MT frequency offsets (2, 5, 10, 20, and 50 kHz), and three MT powers (300, 600, and 1000°) were employed (13 min scan time). To incorporate T1 for MT quantification, variable flip angle T1 mapping10 was additionally performed using 4.5° and 25° flip angles and 15 ms TR for 3 min.After image reconstruction and rigid registration between echoes, multi-echo UTE images were used for mono-exponential T2* fitting (T2*m) as well as bi-exponential T2* fitting (signal model: S(TE)=S*(fs*exp(-TE/T2*s)+(1-fs)*exp(-TE/T2*l))). Here, short and long T2* relaxation times (T2*s and T2*l) and short T2* fraction (fs) were estimated using a non-linear least squares. With MT-UTE images, the macromolecule fraction (MMF) was quantified incorporating the Sled and Pike’s rectangular pulse fitting method to two-pool modeling11 using qMRLab open-source software12. For analysis, a supraspinatus tendon region from the greater tuberosity attachment to the humeral head was manually segmented over 4-6 slices. With patient data, tears filled with fluid were not included for segmentation, and both medial stumps and lateral stumps (if existed) were segmented for retracted supraspinatus tendon. T2*m, T2*s, T2*l, fs, and MMF over segmented tendon regions were compared between healthy subjects and patients.
Results
Figure 1 illustrates our T2* and MT fitting over representative tendon voxels on a healthy subject and a patient with a small full-thickness tear (1 mm width) near the insertion. Improvement of T2* fitting with the use of the bi-exponential model over the mono-exponential model was shown for both voxels. With MT-UTE, the pixel with less signal changes over an increased MT was provided a reduced MMF. Figure 2 shows quantified maps of that healthy subject, T2*m, T2*s, T2*l, and fs maps from multi-echo UTE images, and an MMF map from MT-UTE images. Orientation dependence of quantified T2* parameters was observed for both mono-exponential and bi-exponential fitting while MMF was not much affected by tendon orientation. Results from two patients, one in Figure 1 and the other with a retracted supraspinatus tendon are shown in Figure 3. In tendinosis lesions near tears, increased T2*m and T2*l, decreased fs, and decreased MMF were observed.Figure 4 compares T2*m, T2*s, T2*l, fs and MMF over the mean value of each ROI between the healthy subject group and patient groups using box plots. Significant difference was observed between the two groups based on a two-sample t-test (*p < 0.05 for T2*s and MMF, **p < 0.001 for T2*m, T2*l, and fs). The scatter plots of MMF versus T2*m, T2*s, T2*l, fs and MMF are shown in Figure 5. Based on the Pearson correlation coefficient, MMF and T2*m as well as MMF and T2*l were weakly correlated.
Discussion and Conclusion
We have demonstrated the potential of quantifying degeneration in vivo supraspinatus tendons using quantitative UTE MRI. Quantified T2* parameters from both mono- and bi-exponential fitting were affected by tendon orientations, but significant difference was observed between the healthy subject and patient groups for all quantified parameters. A benefit of bi-exponential fitting in a presence of magic angle effects needs further investigation. A weak negative correlation between T2*m versus MMF and T2*l versus MMF was measured but T2* and MT quantification might provide complementary information about tendon quality, alteration in bound/free water content and collagen matrix, respectively. Applying these methods to patients with various tendon degeneration will allow for further evaluating clinical utility of these two quantitative UTE techniques.Acknowledgements
We would like to thank to GE Healthcare for general research support and funding sources, NIH/NIAMS K01AR075895, UCSF-CTSI UL1 TR001872, and NIH/NIAMS P30AR075055.References
[1] Reilly P, Macleod I, Macfarlane R, Windley J, Emery R. Dead men and radiologists don't lie: a review of cadaveric and radiological studies of rotator cuff tear prevalence. Ann R Coll Surg Engl. 2006;88(2):116-121.
[2] Nho SJ, Brown BS, Lyman S, Adler RS, Altchek DW, MacGillivray JD. Prospective analysis of arthroscopic rotator cuff repair: prognostic factors affecting clinical and ultrasound outcome. J Shoulder Elbow Surg 2009;18(1):13-20.
[3] Juras V, Zbyn S, Pressl C, Valkovic L, Szomolanyi P, Frollo I, Trattnig S. Regional variations of T2* in healthy and pathologic achilles tendon in vivo at 7 Tesla: preliminary results. Magn Reson Med. 2012;68(5):1607-1613.
[4] Grosse U, Syha R, Hein T, Gatidis S, Grözinger G, Schabel C, Martirosian P, Schick F, Springer F. Diagnostic value of T1 and T2* relaxation times and off-resonance saturation effects in the evaluation of Achilles tendinopathy by MRI at 3T. J Magn Reson Imaging. 2015;41(4):964-973.
[5] Kijowski R, Wilson JJ, Liu F. Bicomponent ultrashort echo time T2* analysis for assessment of patients with patellar tendinopathy. J Magn Reson Imaging. 2017;46(5):1441-1447.
[6] Zhu Y, Cheng X, Ma Y, Wong JH, Xie Y, Du J, Chang EY. Rotator cuff tendon assessment using magic-angle insensitive 3D ultrashort echo time cones magnetization transfer (UTE Cones-MT) imaging and modeling with histological correlation. J Magn Reson Imaging. 2018;48(1):160-168.
[7] Ashir A, Ma Y, Jerban S, Jang H, Wei Z, Le N, Du J, Chang EY. Rotator Cuff Tendon Assessment in Symptomatic and Control Groups Using Quantitative MRI. J Magn Reson Imaging. 2020;52(3):864-872.
[8] Gurney PT, Hargreaves BA, Nishimura DG. Design and analysis of a practical 3D cones trajectory. Magn Reson Med 2006;55(3):575-582.
[9] Ma YJ, Chang EY, Carl M, Du J. Quantitative magnetization transfer ultrashort echo time imaging using a time-efficient 3D multispoke Cones sequence. Magn Reson Med. 2018;79(2):692-700.
[10] Fram EK, Herfkens RJ, Johnson GA, et al. Rapid calculation of T1 using variable flip angle gradient refocused imaging. Magn Reson Imaging. 1987;5(3):201-208.
[11] Sled JG, Pike GB. Quantitative interpretation of magnetization transfer in spoiled gradient echo MRI sequences. J Magn Reson. 2000;145(1):24-36.
[12] Karakuzu A, Boudreau M, Duval T, et al. qMRLab: Quantitative MRI analysis, under one umbrella. Journal of Open Source Software 2020. 5(53), p2343.
Figures
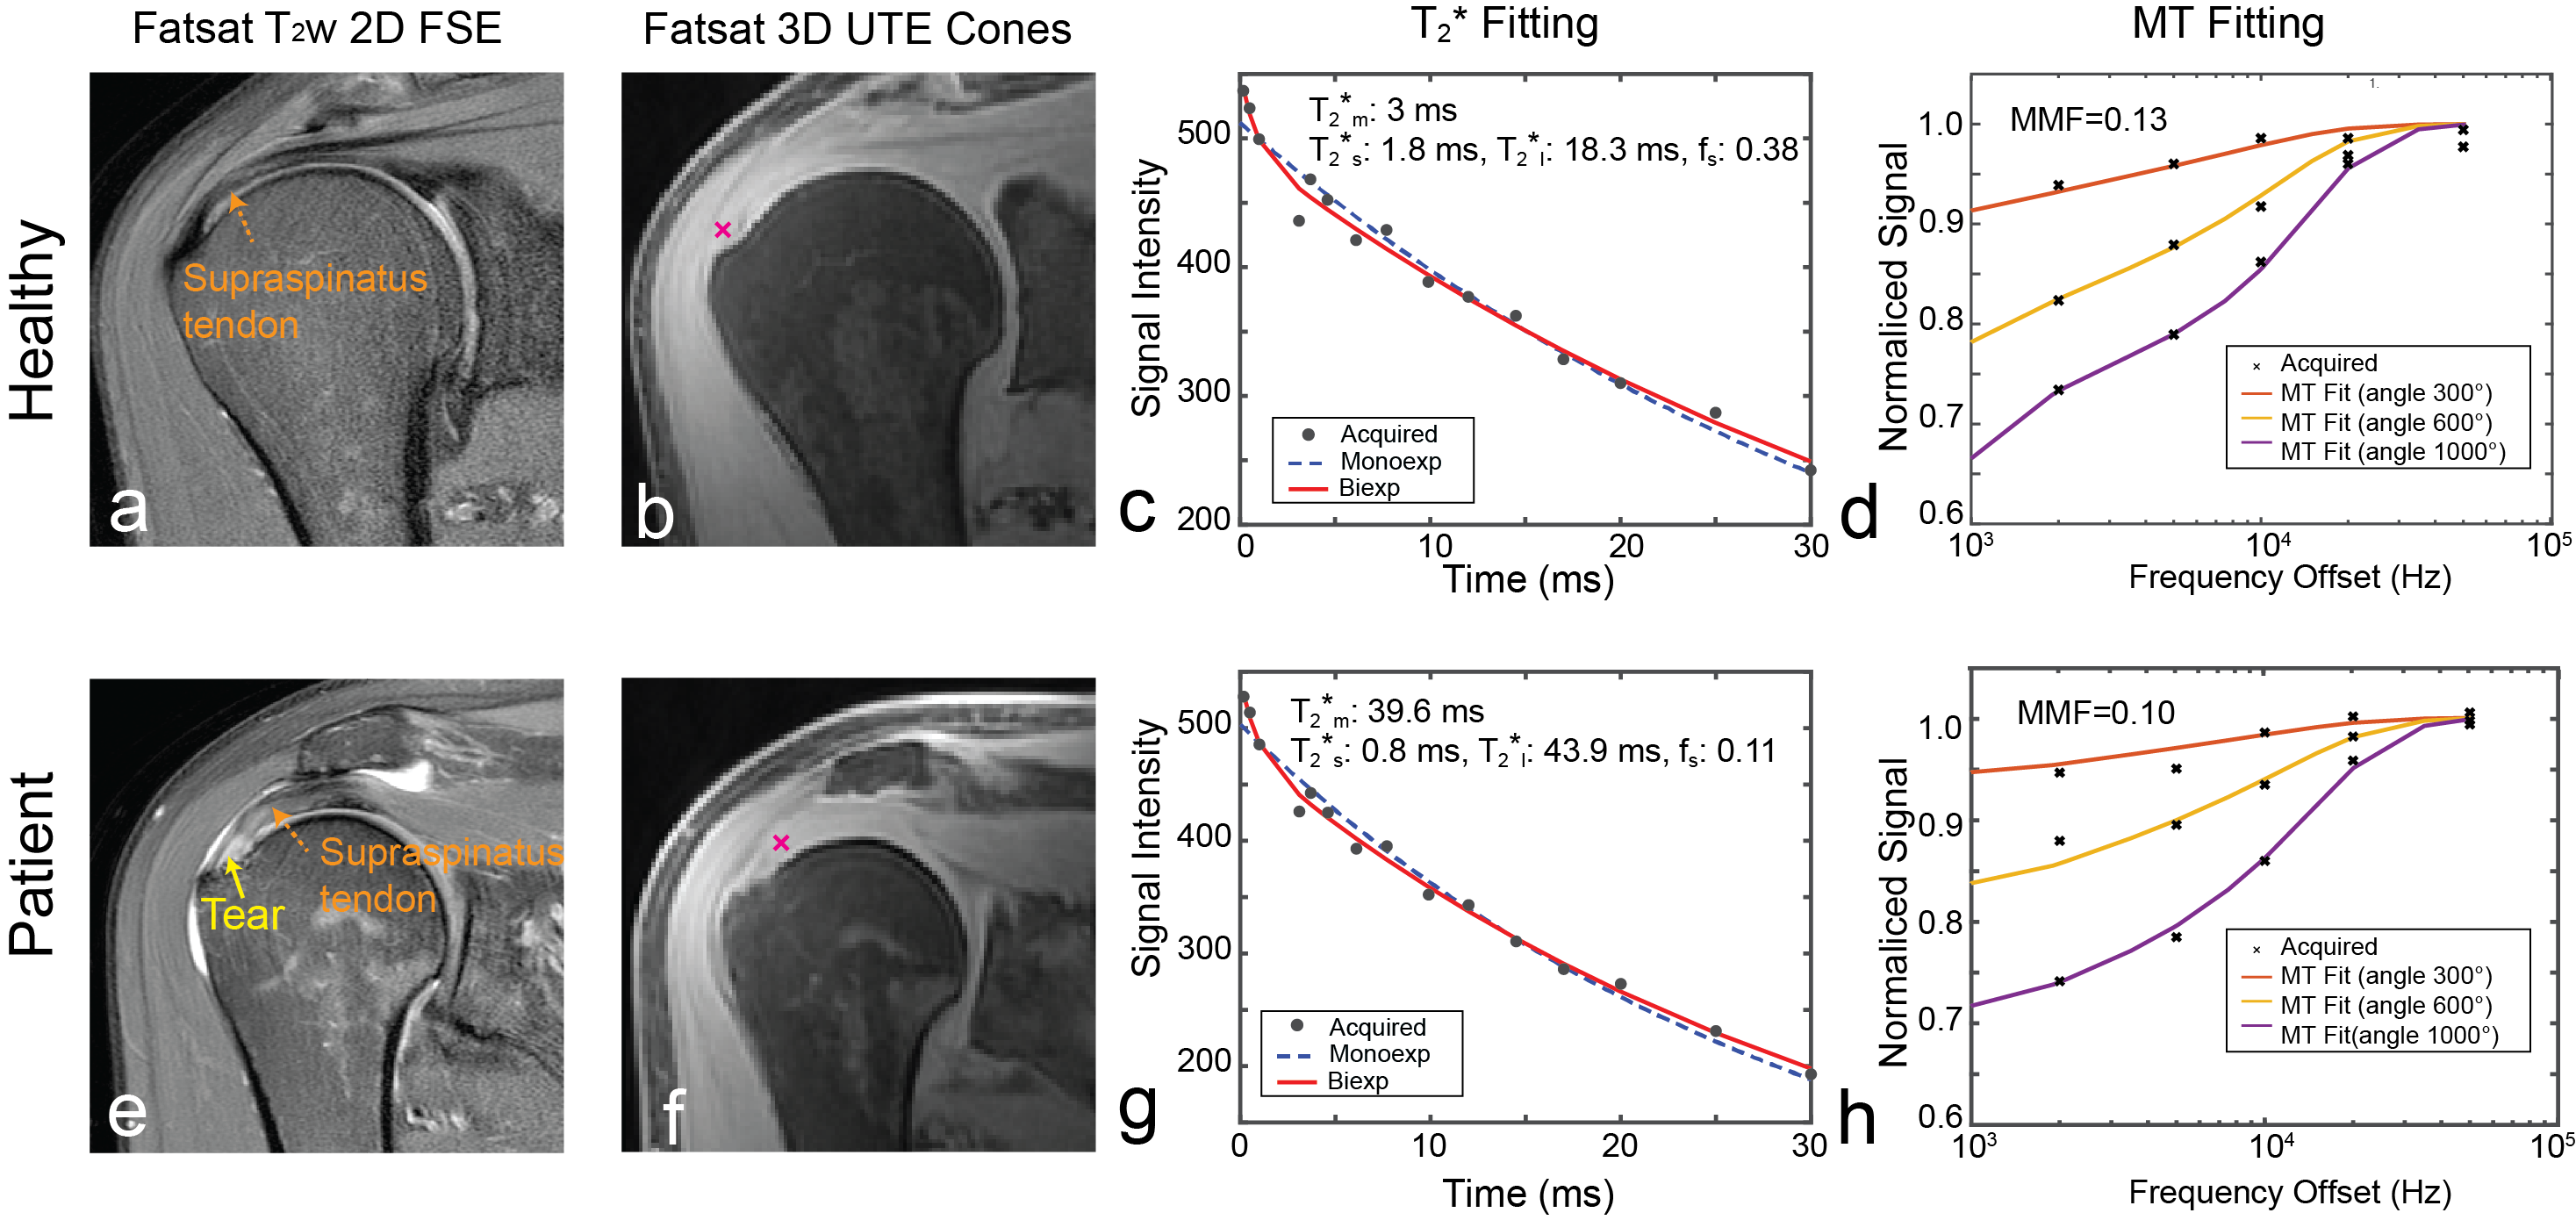
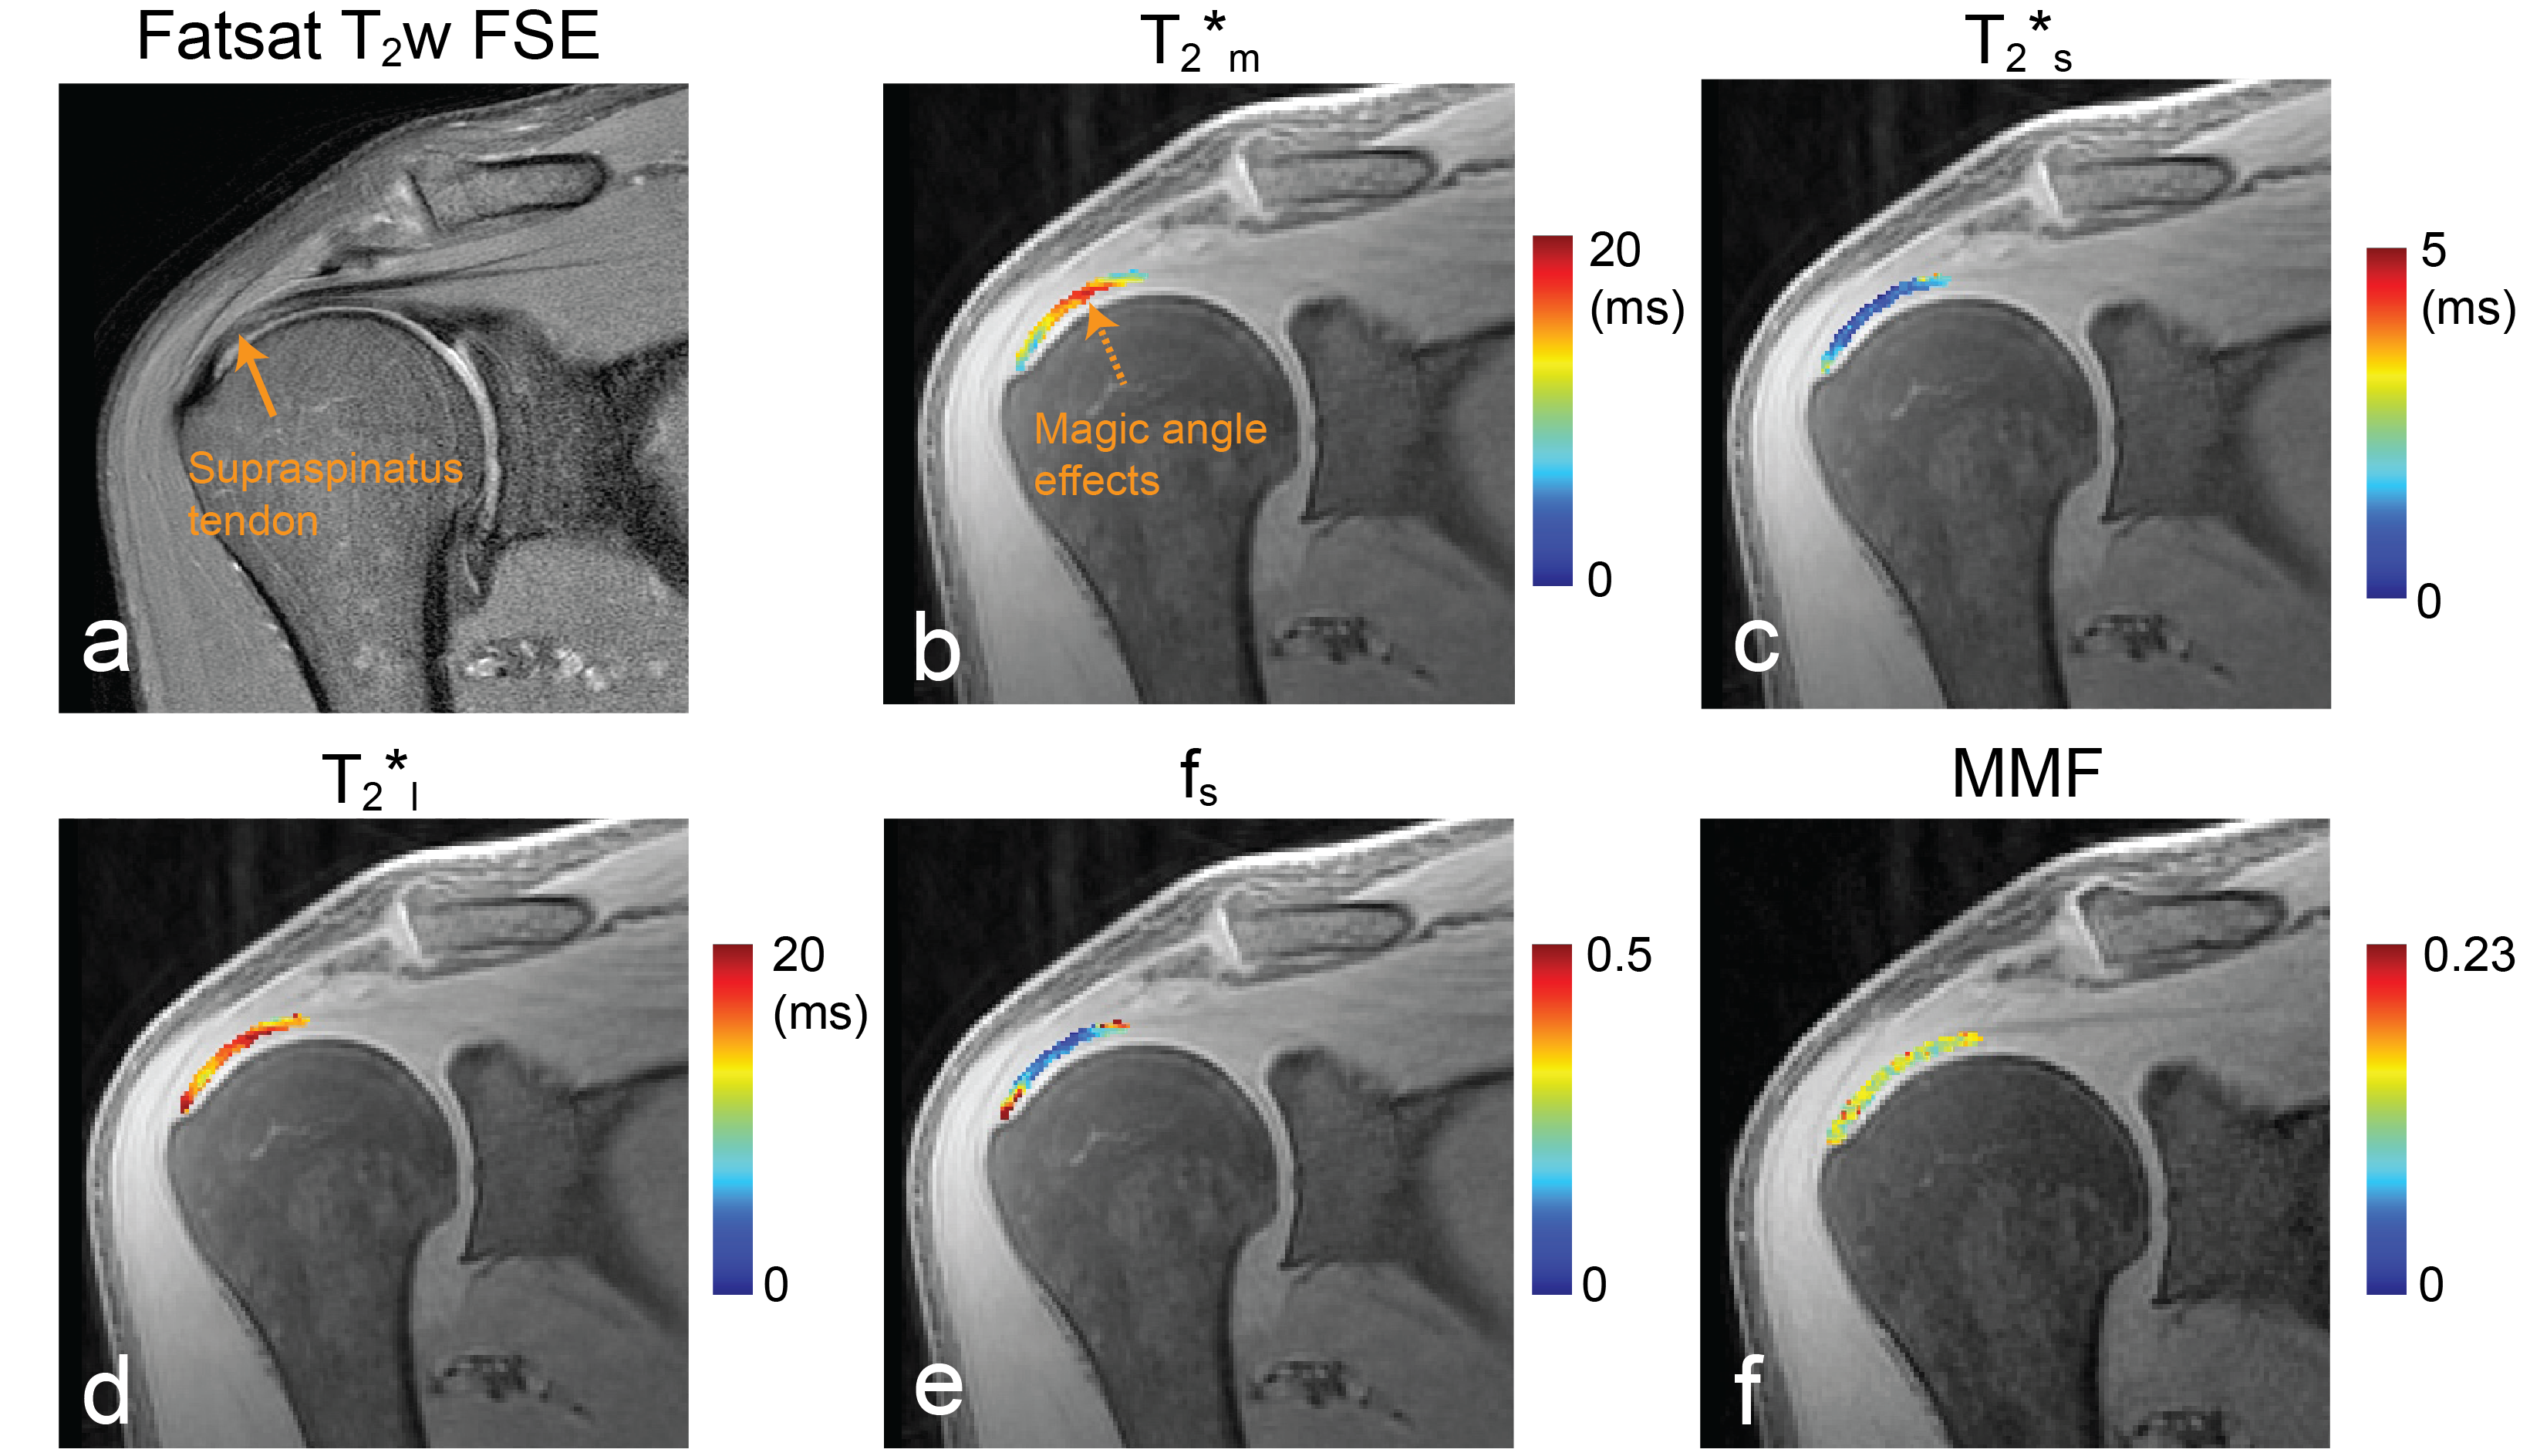
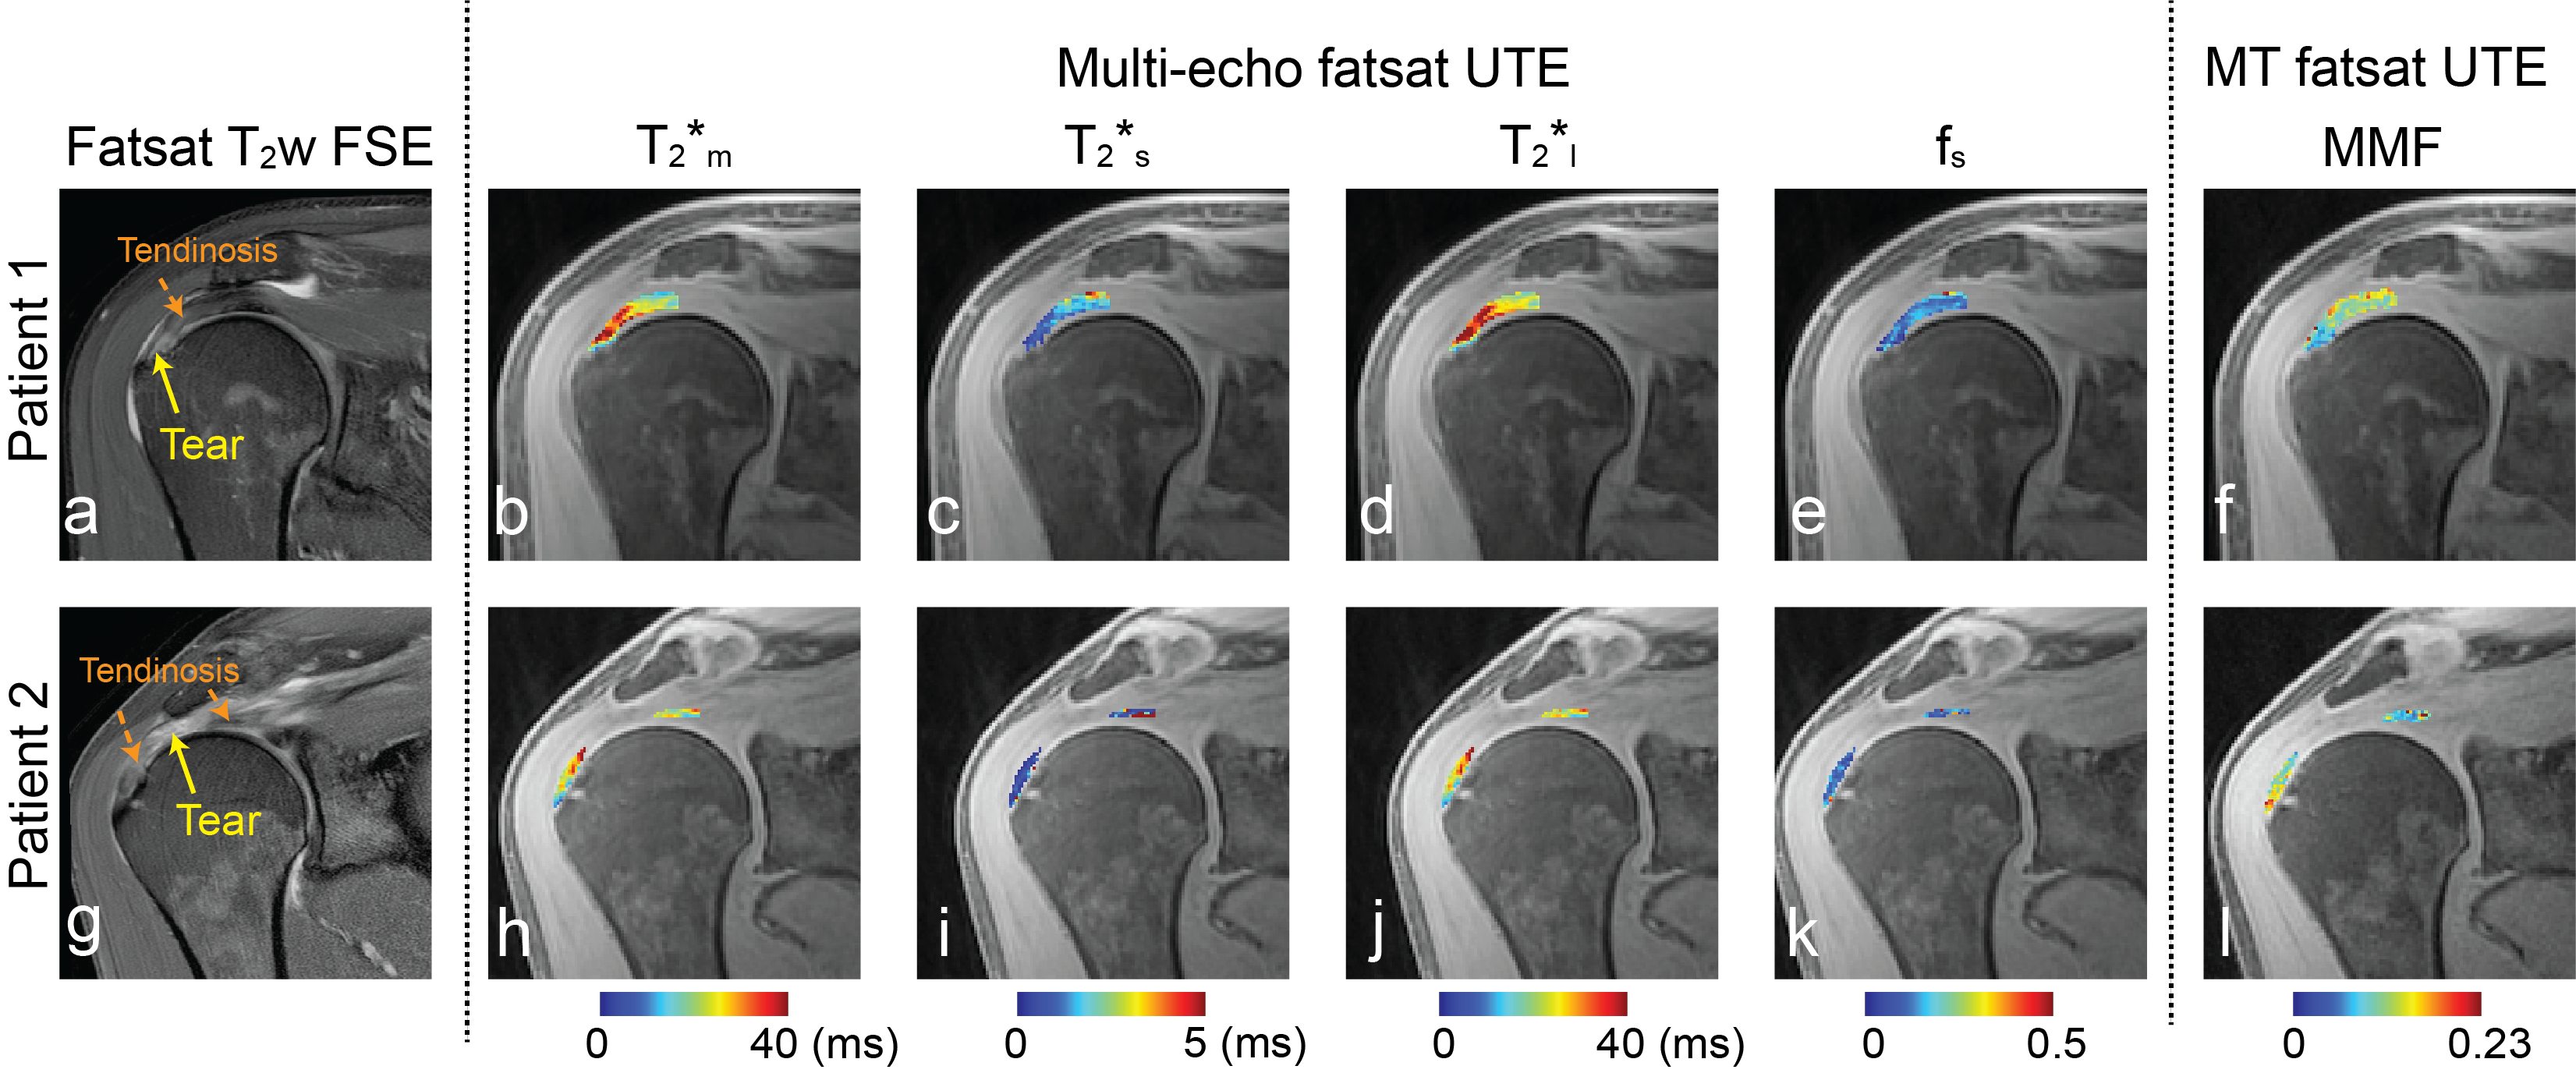
Figure 3. Results from two patients with tears in supraspinatus tendon. (a,g) Fat-saturated T2-weighted 2D FSE images and (b-e, h-k) T2*m, T2*s, T2*l, fs, and (f) MMF maps in segmented supraspinatus tendon regions. Increased T2*m and T2*l, decreased fs, and decreased MMF was observed in regions of tendinosis.
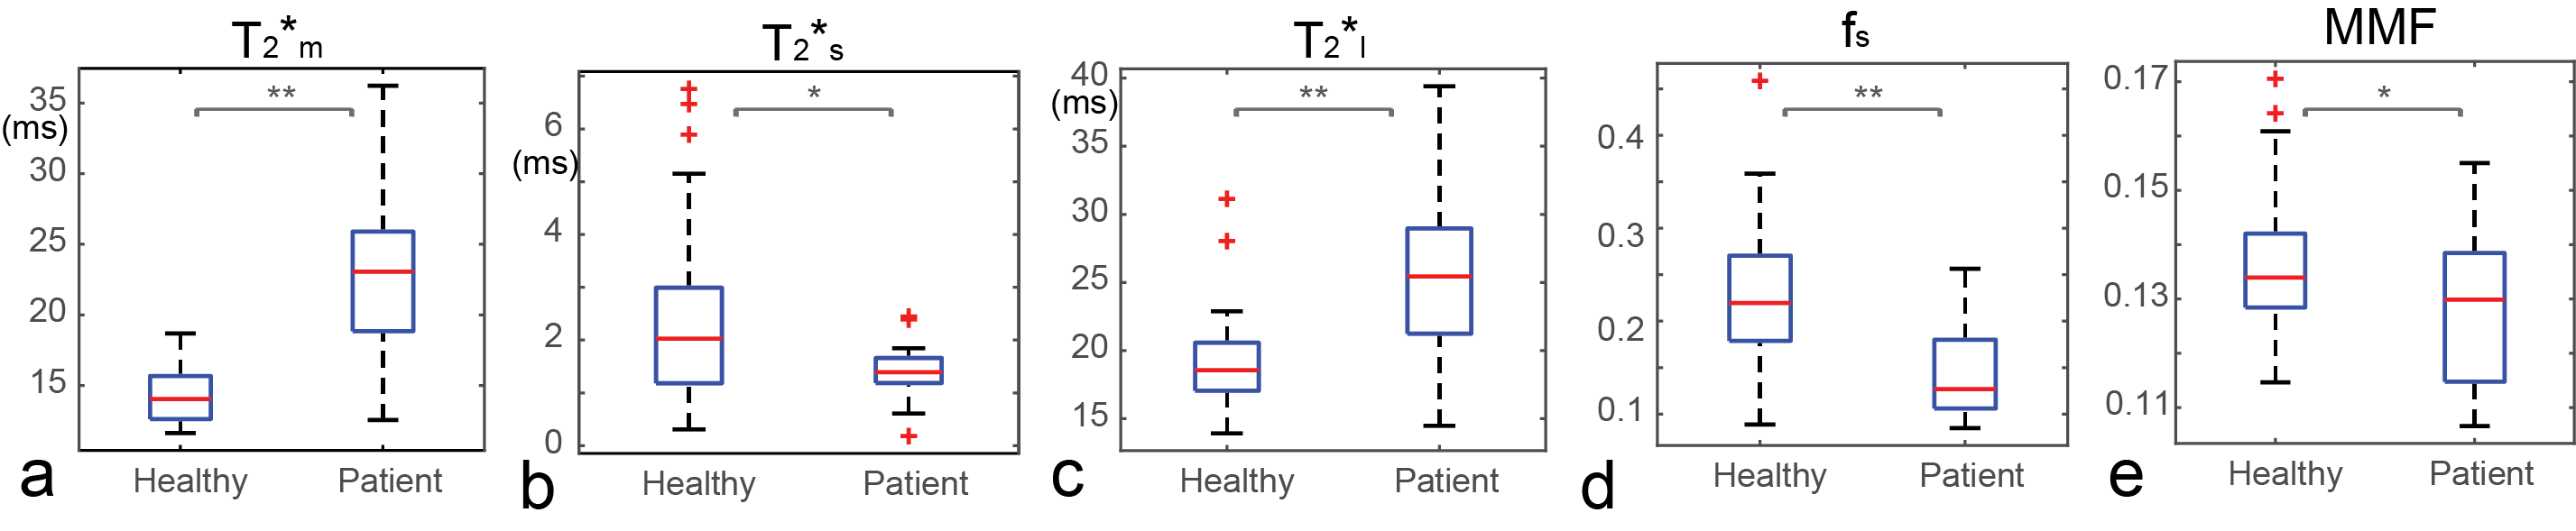
Figure 4. (a-e) Boxplots of the mean T2*m, T2*s, T2*l, fs, and MMF over each ROI for the healthy subject and patient groups. The minimum, first quartile, median, third quartile, and maximum values are shown, and outliers are denoted as red crosses. Significant difference was observed for all parameters between the healthy subject and patient groups based on two-sample t-tests (indicated by *p < 0.05 and **p < 0.001).
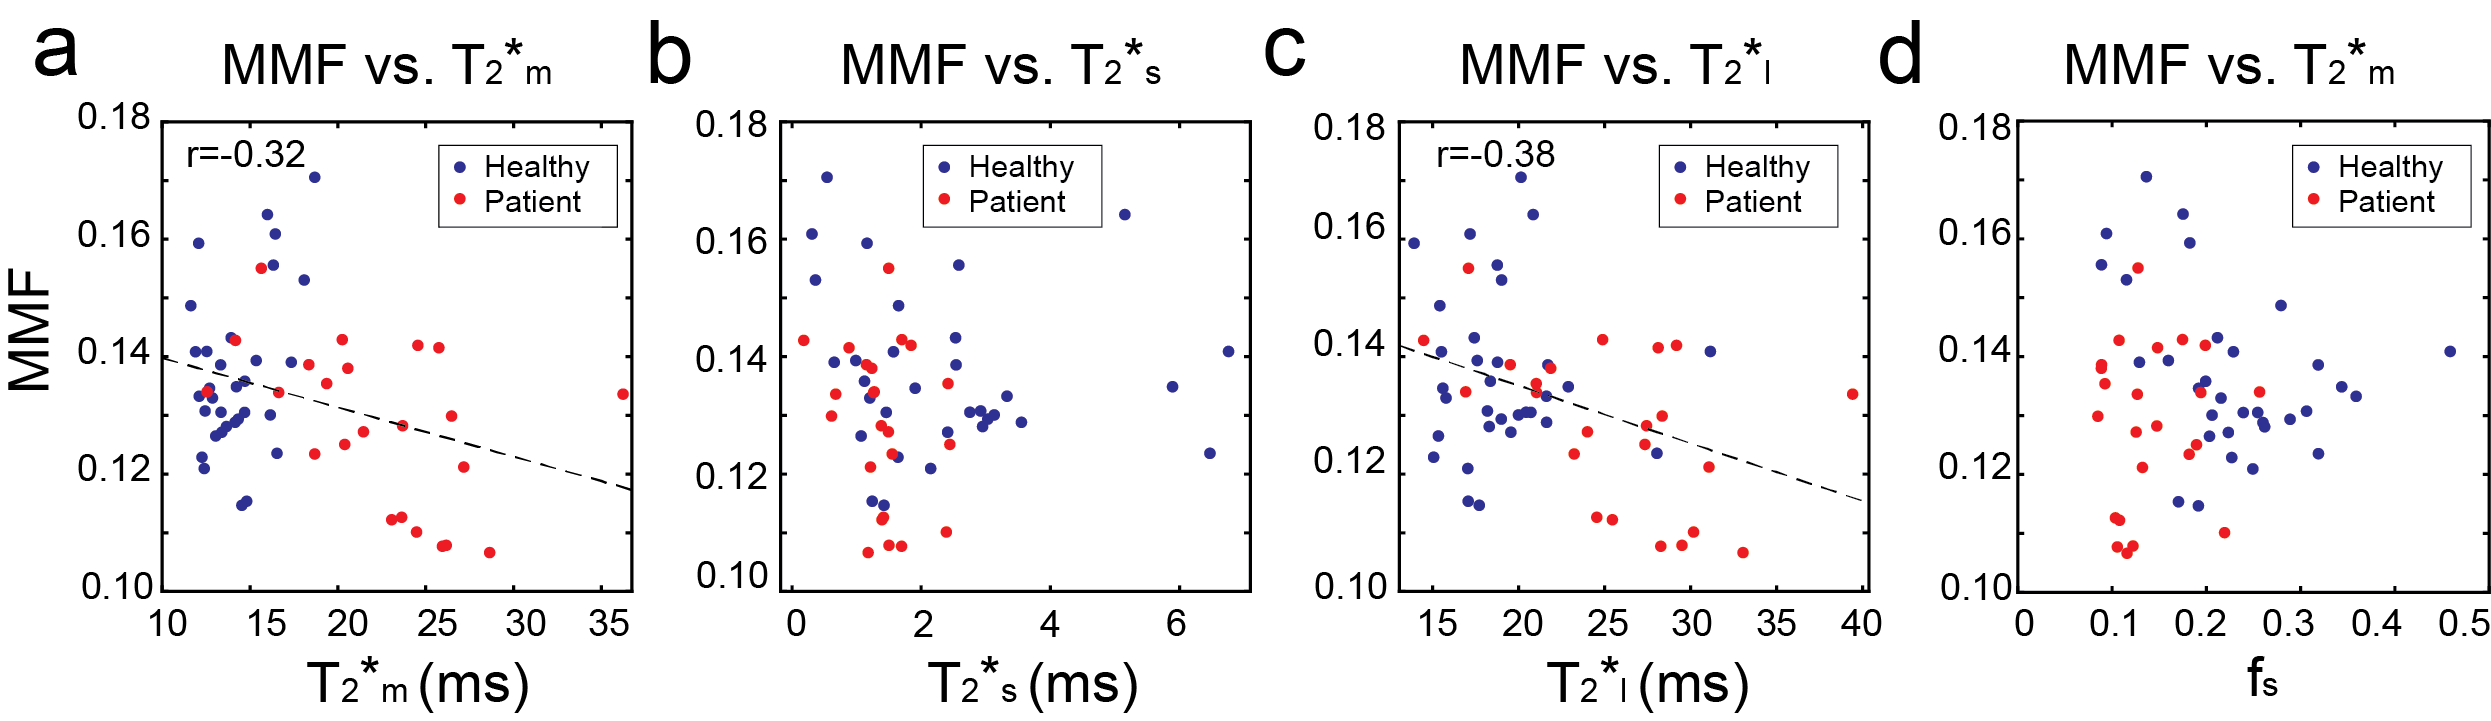
Figure 5. (a-d) The scatter plots of MMF versus T2*m, T2*s, T2*l, and fs over all tendon ROIs. A week negative correlation was measured between MMF and T2*m as well as between MMF and T2*l.