5112
Quantification of Hemosiderin Deposition in Hemophilic Arthropathy Using Ultrashort Echo Time Quantitative Susceptibility Mapping (UTE-QSM)1Department of Radiology, University of California San Diego, San Diego, CA, United States, 2Department of Orthopaedic Surgery, University of California Los Angeles, Los Angeles, CA, United States, 3Department of Medicine, University of California San Diego, San Diego, CA, United States, 4Department of Orthopaedic Surgery, University of California San Diego, San Diego, CA, United States, 5Radiology Service, Veterans Affairs San Diego Healthcare System, San Diego, CA, United States, 6Department of Bioengineering, University of California San Diego, San Diego, CA, United States
Synopsis
Keywords: MSK, Hematologic
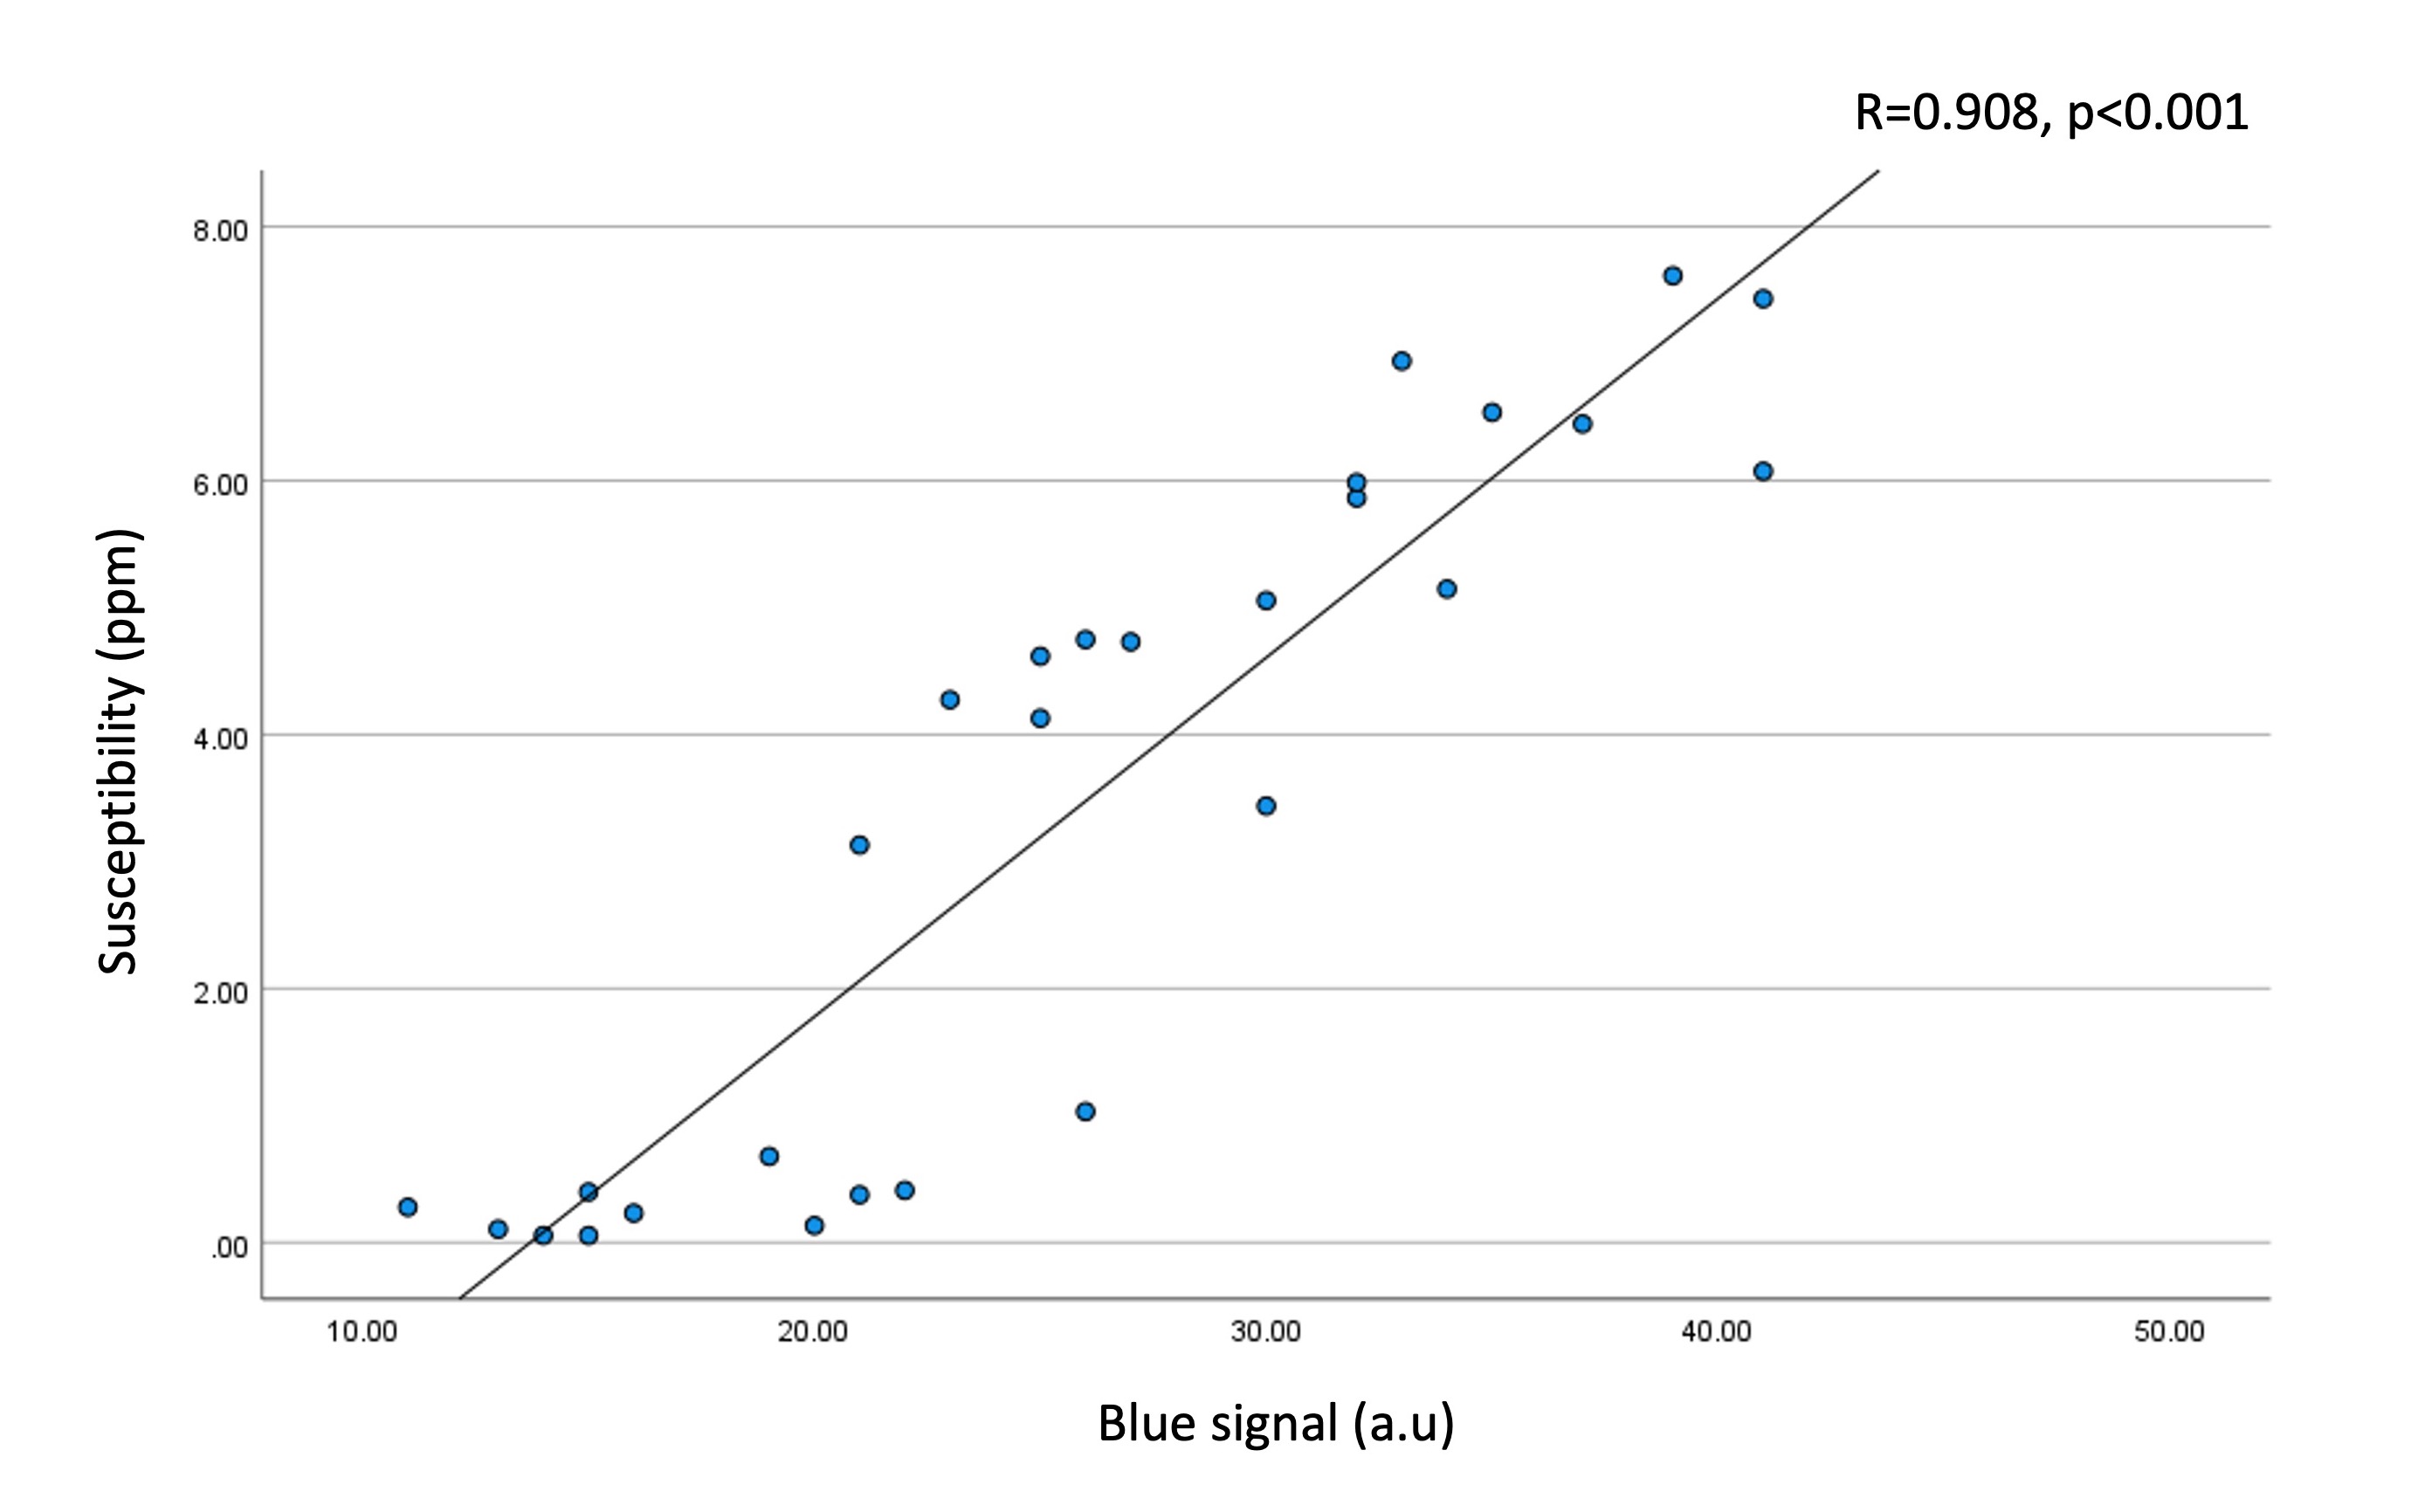
We investigated the quantitative capability of the UTE-QSM technique in the assessment of hemosiderin compared to histology. UTE-QSM and histology were performed in knee synovium tissues from hemophilia patients to visualize hemosiderin. The susceptibility maps from UTE-QSM showed a visually high similarity to the corresponding histological findings for all tissues. There was a significant difference in tissues with low and high iron load (p<0.001) in UTE-QSM. The susceptibility values on UTE-QSM showed a significant strong positive correlation to the blue signal in histology (R=0.908; p<0.001). We showed that UTE-QSM has excellent performance for detecting and quantifying hemosiderin in HA.Introduction
Hemophilia is an x-linked bleeding disorder characterized by deficiency clotting factors VIII or IX1, afflicting approximately 1 out of every 30,000 male births2. One of the major complications of hemophilia is the spontaneous bleeding in joints leading to the so-called hemophilic arthropathy (HA). HA is characterized by rapidly progressive joint erosions, leading to hemarthrosis, and eventually to high hemosiderin deposition and synovial hypertrophy1,3. While HA can manifest in many different joints, the knee is the most involved joint in HA, causing the most pain and disability1. Due to the silent, asymptomatic joint bleeding, it is of high clinical interest and importance to identify and quantify the hemosiderin load of the knee joint early and reliably for more accurate diagnosis and treatment monitoring. Unfortunately, due to the extremely short T2 values of hemosiderin, conventional MRI sequences are not able to detect nor quantify hemosiderin reliably. Recently, the feasibility of ultrashort echo time (UTE) based QSM (UTE-QSM) to assess hemosiderin in HA has been demonstrated4. In this study, we investigated the quantitative capability of the UTE-QSM technique in the assessment of hemosiderin compared to histology.Methods
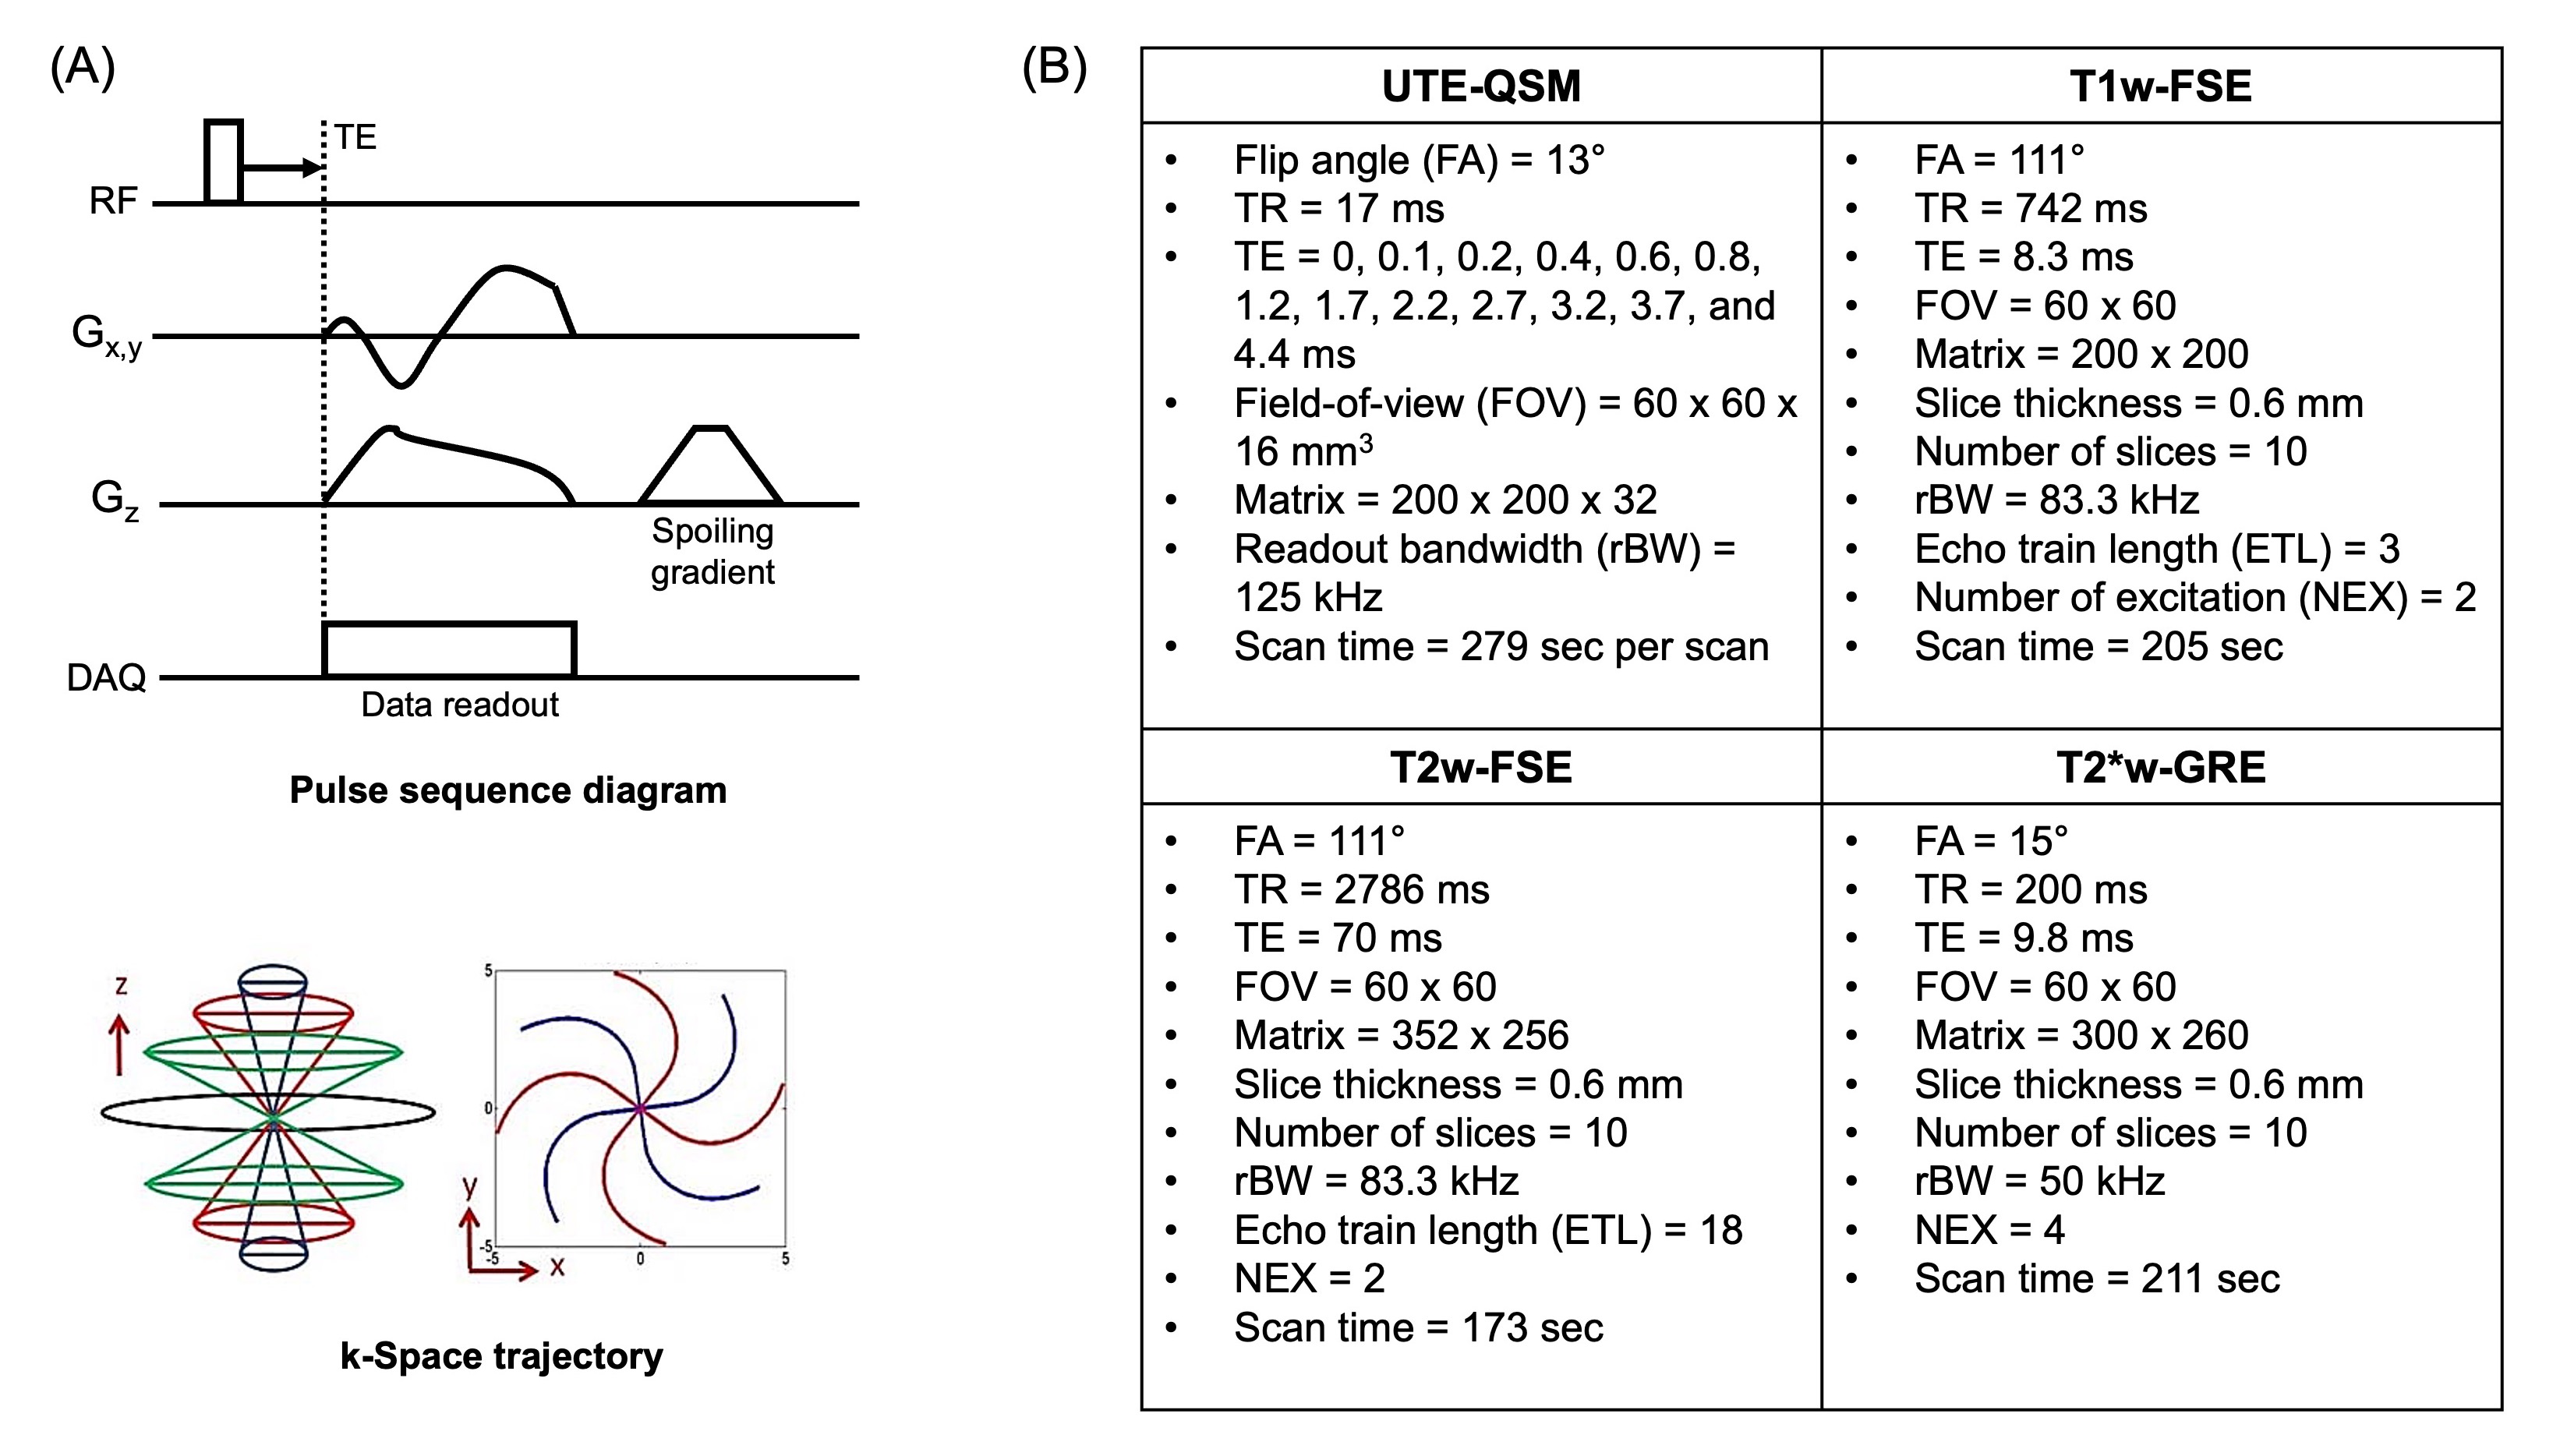
For this prospective ex vivo study, four synovium-laden synovium tissues were collected from total knee arthroplasty of hemophilia patients. The tissues underwent a single freeze-thaw cycle after the harvest and then were prepared in individual 30 mL tubes with saline for the subsequent MRI. MRI was performed in a 3T clinical scanner (MR750, GE Healthcare) using a 3-inch surface coil. The MRI protocol consisted of a UTE-QSM based on UTE-Cones sequence as well as clinical sequences including T1-weighted fast spin echo (T1w-FSE), T2-weighted fast spin echo (T2w-FSE), and T2*-weighted gradient recalled echo (T2*w-GRE) sequences. After the MRI, the tissues were fixed in formalin for 72 hours and underwent histological processes including embedding, sectioning, and staining. Perl’s Prussian Blue (PPB) staining was used to visualize hemosiderin (i.e., iron), while Nuclear Fast Red was used for counterstaining.Figure 1A shows the UTE-Cones sequence and k-space trajectory used for the UTE-QSM. To acquire UTE as well as GRE images at variable echo times (TEs), the imaging was repeated with the readout gradient with different time delays, which yielded a total of 13 echoes. Figure 1B shows the MR imaging parameters. The acquired UTE-Cones images were processed with morphology-enabled dipole inversion (MEDI) QSM pipeline5. To deal with the fat signal, a major confounding factor for musculoskeletal QSM, a water-fat signal model based on six fat peaks was incorporated4,6. The resultant total field map was processed with projection onto dipole field (PDF) algorithm to yield a local field map7. For MEDI algorithm, a regularization parameter of 500 was used. The resultant susceptibility map and the corresponding histological images were analyzed by a radiologist with 8 years of experience and an MRI physicist with 10 years of experience. A total of 28 regions of interest (ROIs) were manually drawn, and the linear correlation of the resultant values between UTE-QSM and histology was assessed (i.e., magnetic susceptibility in UTE-QSM vs. intensity of blue staining in histology).
Results
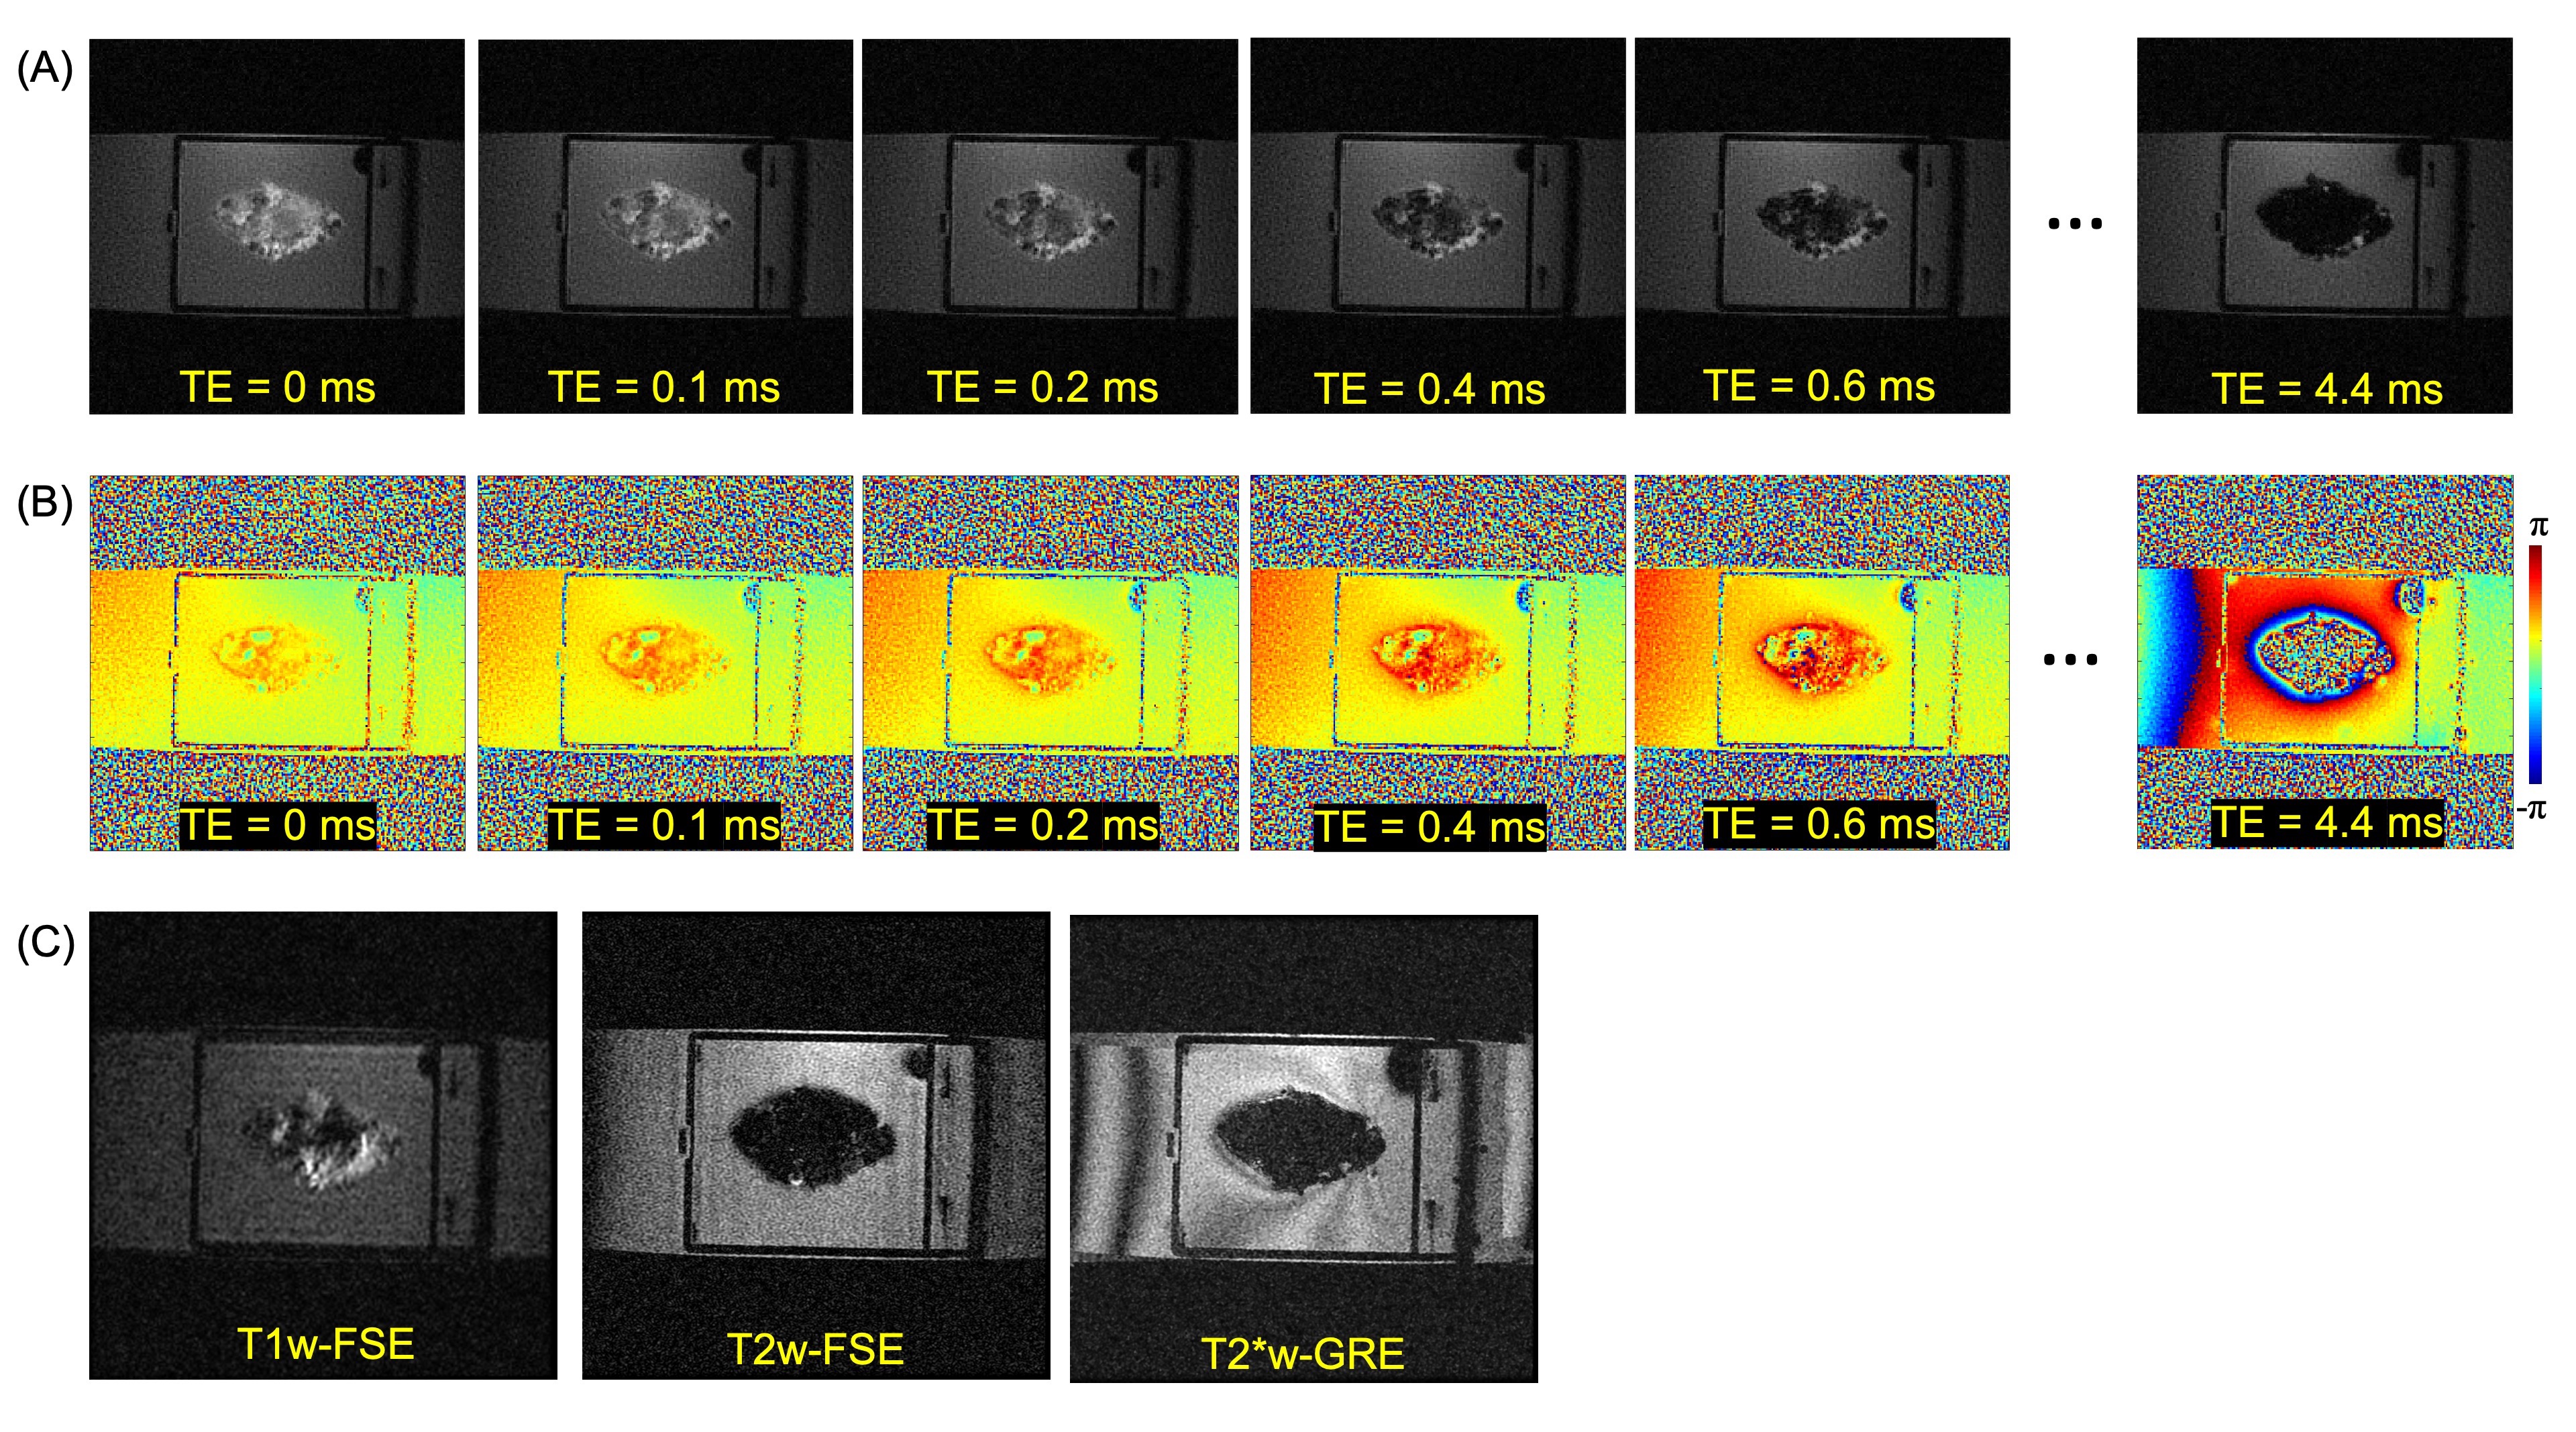
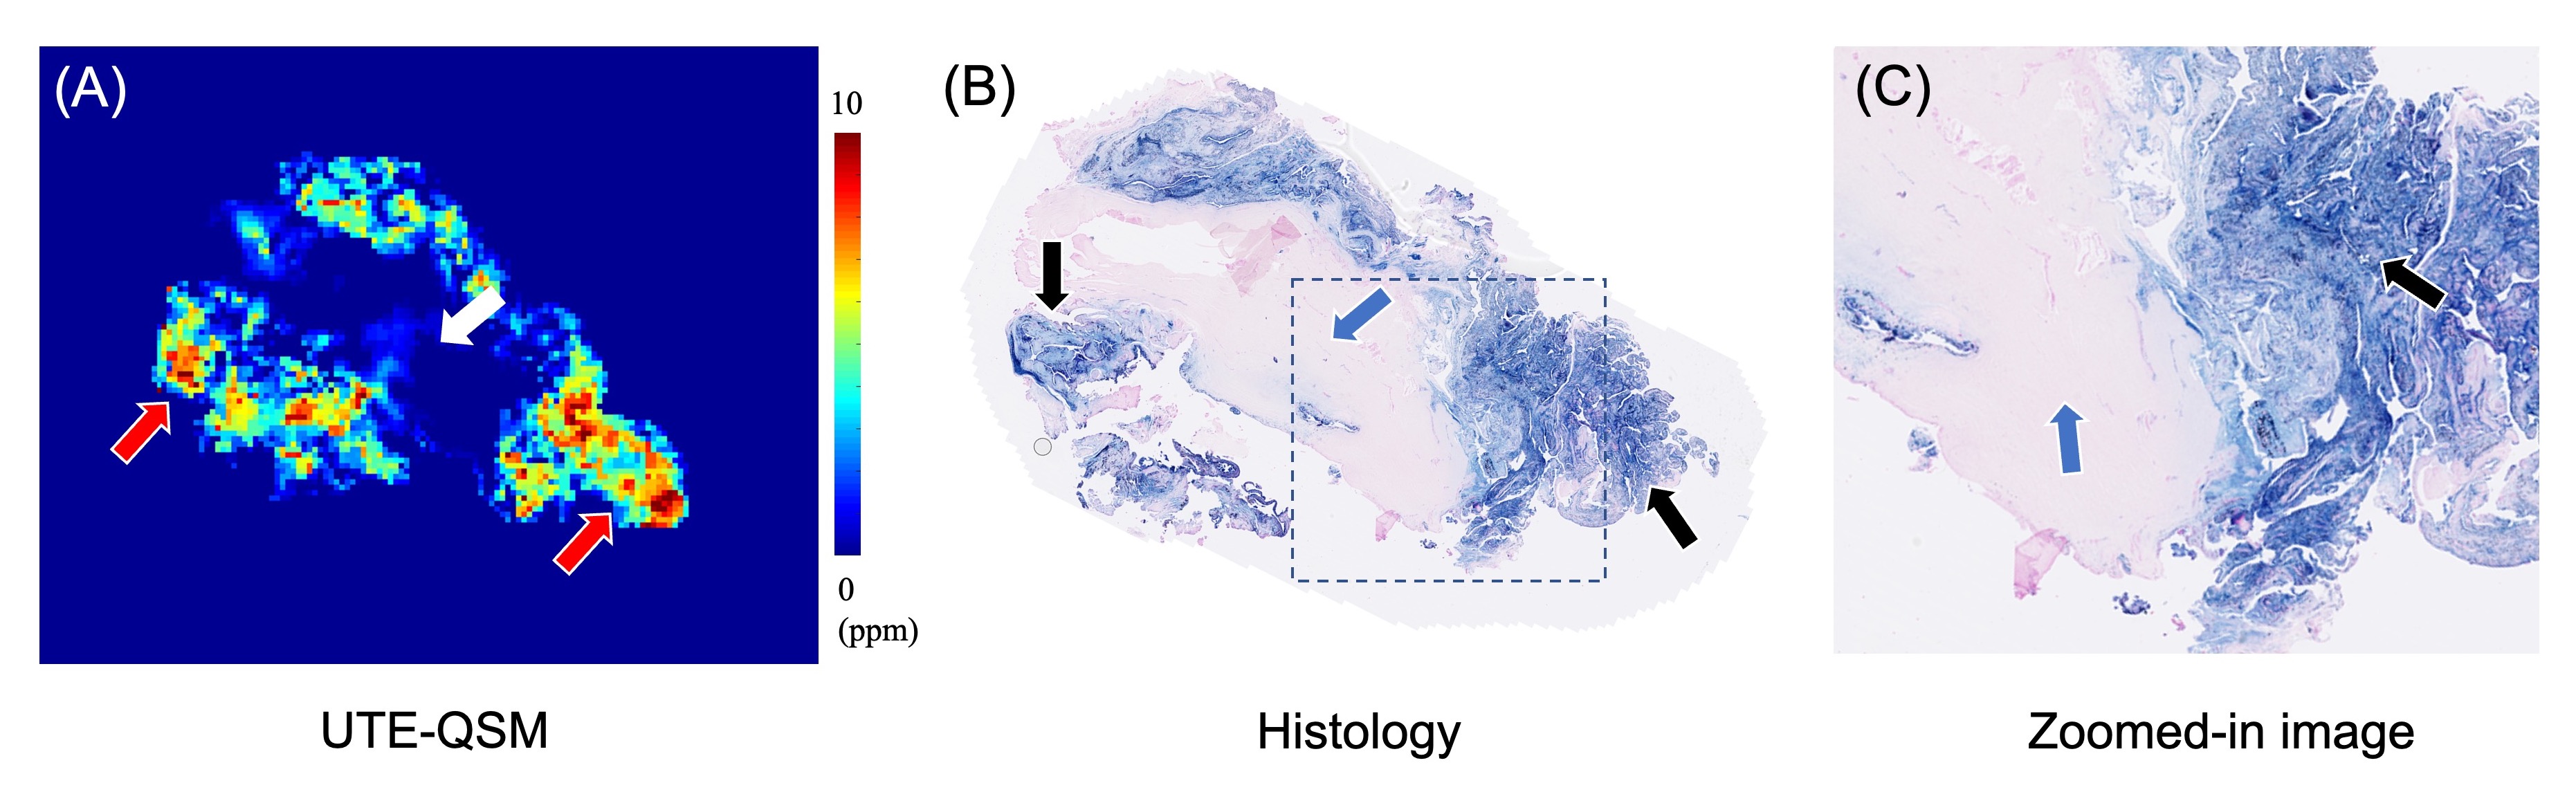
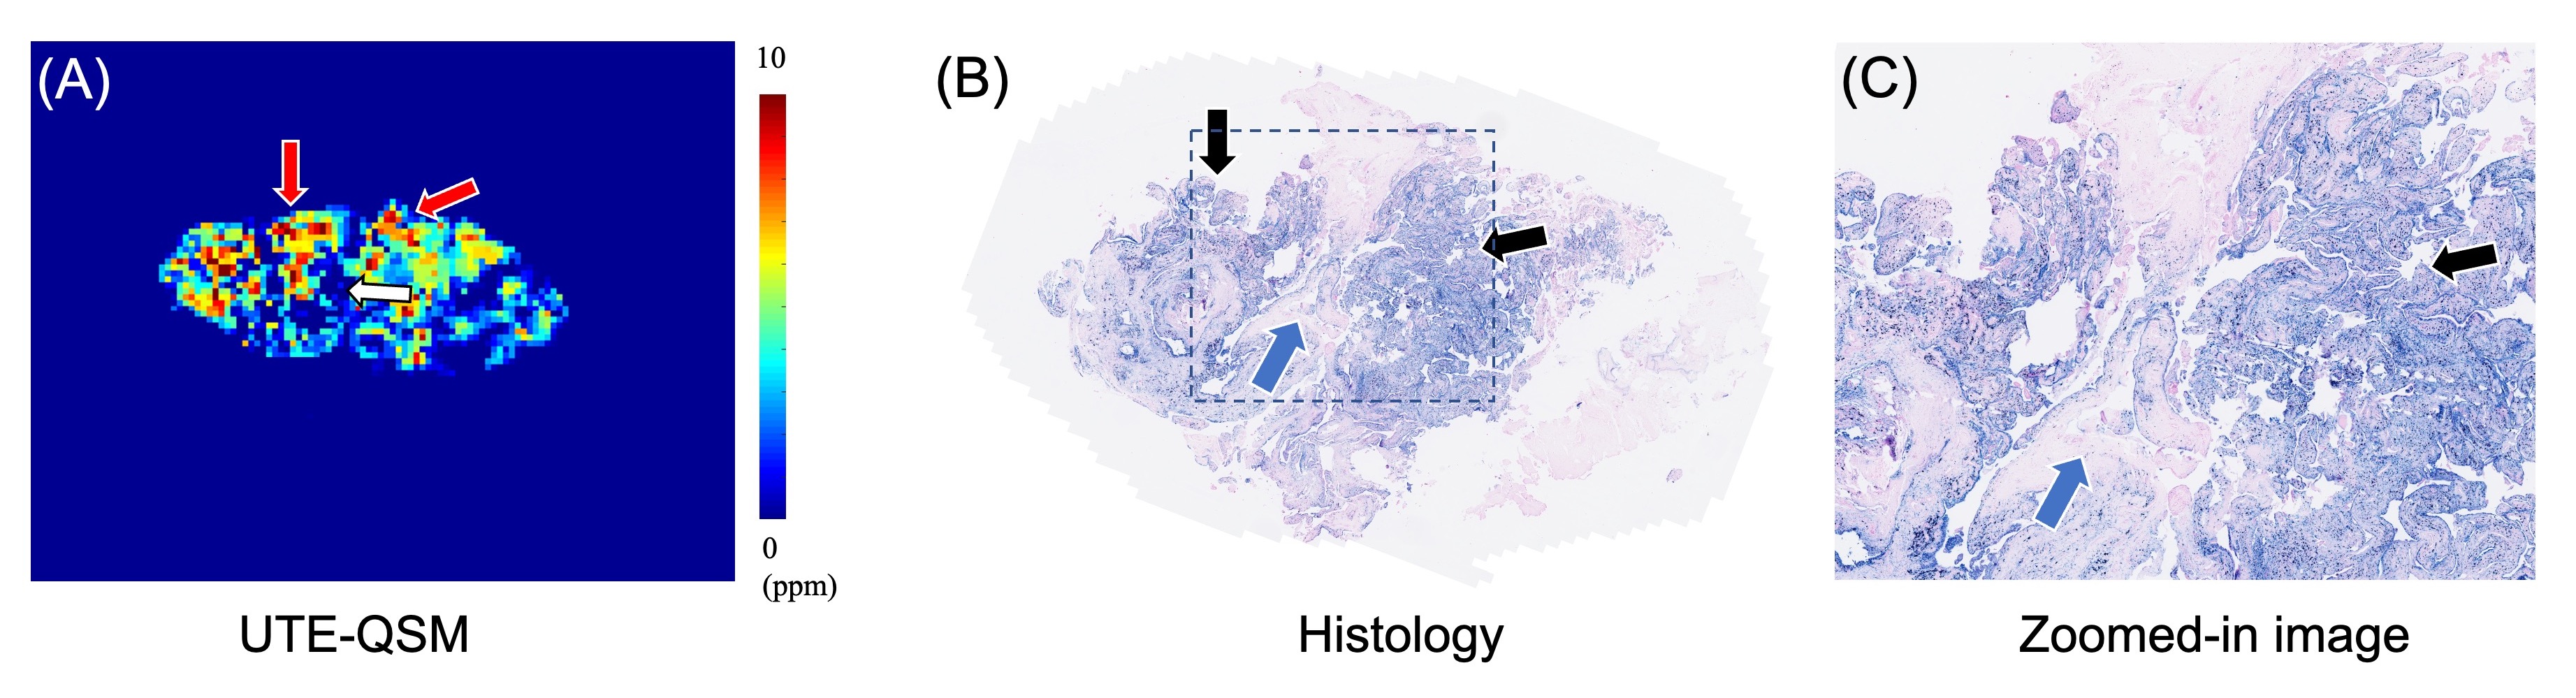
Figure 2 shows input UTE-QSM images at different TEs as well as the corresponding clinical MR image. Due to the highly accumulated hemosiderin in the synovial tissue, a strong blooming artifact with signal nulling is exhibited in T1w-FSE which obscures the morphological assessment of hemosiderin deposition. In contrast, UTE images show the dramatically reduced blooming artifact.In visual inspection, the 3D susceptibility maps from UTE-QSM showed high similarity to the corresponding histological findings for all tissues. Out of 28 ROIs, 16 ROIs showed high iron load (HL) while 12 ROIs showed low iron load (LL) both on UTE-QSM and in histology. The mean susceptibility from UTE-QSM was 5.57 ppm (SD: 1.23 ppm) for HL and 0.57 ppm (SD: 0.85 ppm) for LL tissues. We found a significant difference in the susceptibility in HL tissues compared to LL tissues (p<0.001). Figures 3 and 4 show representative examples of HA tissues in UTE-QSM with the corresponding PPB-stained images. Figure 5 shows the scatter plot between susceptibility values and the corresponding PPB intensity in all ROIs. Overall, the susceptibility values from UTE-QSM showed a strong positive correlation with respect to the blue signal from histology, with a Pearson’s correlation of R=0.908 (p<0.001). The cutoff for differentiating between HL and LL was seen at a susceptibility of 3.28 ppm.
Discussion and Conclusion
MRI plays an important role in early identifying soft tissue changes related to HA8,9. Nevertheless, highly accumulated hemosiderin is invisible on conventional MRI due to the strong susceptibility and the short T2 decay as demonstrated in Figure 2. As the degeneration in HA and accordingly the hemosiderin deposition increase, more disability and the need for surgical intervention are caused10. Therefore, very early diagnostics and risk stratification are very important. By using UTE-QSM, hemosiderin can be reliably identified. In our future studies, the current ex vivo protocol will be further optimized to achieve the clinically feasible scan time, including the reduced number of TEs, interleaved multi-echo acquisition, and other acceleration techniques such as compressed sensing and deep learning11,12, and we will apply it in a cohort of hemophilia patients and healthy controls.Acknowledgements
The authors acknowledge grant support from the NIH (R01AR078877, R01AR075825, R01AR062581, R01AR068987, and RF1AG075717), VA Clinical Science Research and Development Service (Merit Awards I01CX001388 and I01CX002211), the DFG (SE 3272/1-1), and GE Healthcare.References
1. Luck Jr JV, Silva M, Rodriguez-Merchan CE, et al. Hemophilic arthropathy. JAAOS-Journal of the American Academy of Orthopaedic Surgeons 2004;12:234–45.
2. Soucie JM, Evatt B, Jackson D, et al. Occurrence of hemophilia in the United States. American journal of hematology 1998;59:288–94.
3. Stein H, Duthie RB. The pathogenesis of chronic haemophilic arthropathy. The Journal of bone and joint surgery. British volume 1981;63:601–09.
4. Jang H, Drygalski A von, Wong J, et al. Ultrashort echo time quantitative susceptibility mapping (UTE‐QSM) for detection of hemosiderin deposition in hemophilic arthropathy: a feasibility study. Magnetic resonance in medicine 2020;84:3246–55.
5. Liu J, Liu T, Rochefort L de, et al. Morphology enabled dipole inversion for quantitative susceptibility mapping using structural consistency between the magnitude image and the susceptibility map. Neuroimage 2012;59:2560–68.
6. Dimov AV, Liu Z, Spincemaille P, et al. Bone quantitative susceptibility mapping using a chemical species–specific signal model with ultrashort and conventional echo data. Magnetic resonance in medicine2018;79:121–28.
7. Liu T, Khalidov I, Rochefort L de, et al. A novel background field removal method for MRI using projection onto dipole fields. NMR in Biomedicine 2011;24:1129–36.
8. Funk MB, Schmidt H, Becker S, et al. Modified magnetic resonance imaging score compared with orthopaedic and radiological scores for the evaluation of haemophilic arthropathy. Haemophilia 2002;8:98–103.
9. Susan Cross, Sujit Vaidya, Nicos Fotiadis. Hemophilic Arthropathy: A Review of Imaging and Staging. Seminars in Ultrasound, CT and MRI 2013;34:516–24.
10. Rodriguez-Merchan EC. Hemophilic arthropathy: current treatment challenges and future prospects. Expert Opinion on Orphan Drugs 2018;6:477–83.
11. Lu X, Jang H, Ma Y, et al. Ultrashort echo time quantitative susceptibility mapping (UTE-QSM) of highly concentrated magnetic nanoparticles: a comparison study about different sampling strategies. Molecules2019;24:1143.
12. Athertya JS, Ma Y, Masoud Afsahi A, et al. Accelerated Quantitative 3D UTE-Cones Imaging Using Compressed Sensing. Sensors 2022;22:7459.
Figures