5104
Direct Imaging and T1 and T2* Quantification of Semi-Solid Red Blood Cell Membrane Lipid via Ultrashort Echo Time (UTE) Sequences1Department of Radiology, University of California, San Diego, La Jolla, CA, United States, 2Department of Bioengineering, University of California, San Diego, La Jolla, CA, United States, 3GE Helathcare, San Diego, CA, United States, 4Radiology Service, Veterans Affairs San Diego Healthcare System, La Jolla, CA, United States
Synopsis
Keywords: Relaxometry, Relaxometry
Direct imaging of semi-solid lipids, such as cell membranes and myelin, is of great interest. Yet, the short T2 of semi-solid lipid protons hampers direct detection through conventional pulse sequences. In this study, we examined whether an ultrashort echo time (UTE) sequence can directly acquire signals from membrane lipids. Cell membranes from red blood cells were subject to D2O exchange and freeze-drying for complete water removal. High MR signals were detected with the UTE sequence, which showed an ultrashort T2* of ~77-252 µs and a short T1 of 189 ms for semi-solid membrane lipids.Introduction
A significant portion of the molecular composition of tissues, such as cell membranes and myelin, consists of the lipid bilayer. These membrane lipids may serve as biomarkers of diseases involving cell necrosis, apoptosis, and demyelination, such as acute tubular necrosis and multiple sclerosis1,2. Thus, noninvasive direct imaging of these membrane lipids will be a valuable diagnostic tool for such diseases. From the MR perspective, however, the protons on semi-solid membrane lipids have ultrashort T2 relaxation times, which make them difficult to be detected with conventional MR pulse sequences3. To overcome this challenge, ultrashort echo time (UTE) sequences have been demonstrated as a useful platform for imaging short T2 tissues such as bone and myelin4,5. Here, we demonstrate the feasibility of directly imaging membrane lipids via UTE sequences using red blood cell (RBC) membranes as a phantom and report their relaxation properties.Methods
The RBC membranes were collected from commercially available blood. The plasma and buffy coat were removed by centrifugation, and the remaining RBCs were washed with Tris buffer (0.176 M, pH 7.6). Cell membranes were collected by mixing with Tris buffer (11.35 mM, pH 7.6) for 5 minutes at 4oC and centrifuging at 20,000 g for 30 minutes. The collected RBC lipid membrane was suspended in D2O for 24 hours, centrifuged, and freeze-dried overnight. The D2O suspension and freeze-drying were repeated twice to remove water completely. The water-free RBC membrane lipid powder sealed in a 1 ml syringe tube was scanned at 3T (GE Healthcare, Milwaukee, WI) using a wrist coil for signal reception. T2* was measured via both mono-exponential and two-component super Lorentzian fitting of multiple echo images acquired from a 3D UTE sequence (TR = 30 ms, matrix size = 64 x 64 x 20, FOV = 80 mm, slice thickness = 10 mm, number of averages = 1). The sequence was repeated with seven different echo times (TE = 32, 64, 150, 200, 400, 600, and 800 µs). For the two-compartment super Lorentzian fitting, the long T2* was fixed to be 50 ms6. A variable flip angle (VFA) approach with the same UTE readout was used to measure the T1 of the RBC membrane lipid, using nominal flip angles of 1o, 5o, 10o, 15o, 20o, and 25o. TR and TE were fixed to 30 ms and 32 µs, respectively. Nominal flip angles used for T1 measurements were corrected by considering T2* decay during RF pulse excitation7.Results
The membrane lipid signal was well detected with the UTE sequence (Figure 1A). The T2* of membrane lipid was measured to be 252±12 µs based on mono-exponential fitting (Figure 1B), and 77±5 µs via two-compartment super Lorentzian fitting (Figure 1C). The amplitude of the short T2* compartment was measured to be ~95%, while the amplitude of the long T2* was ~5%. The raw images for the T1 measurement showed decreasing signal intensities with flip angles (Figure 2A). Without flip angle correction, the T1 was measured to be 127±7 ms. Correcting flip angles using T2* measurement from mono-exponential fitting (T2* = 252±12 µs) updated the T1 value to 189±7 ms.Discussion
Previous UTE studies showed that bovine myelin lipids could be directly imaged5. Similarly, we detected MR signals from D2O-exchanged and freeze-dried RBC membrane lipids, confirming that the MR signals are only generated from semi-solid lipid protons, and UTE imaging can directly detect them. The discrepancy between T2* measurements from mono-exponential and super Lorentzian fitting was expected, as lipid bilayers show super Lorentzian line shape8, and exponential fitting can overestimate the T2* values. The T2* of 77±5 µs roughly matches several previously reported myelin T2*/T2 values (e.g., ~50 µs9, 7.5-101 µs10, 50-1000 µs3, 150-250 µs5,11-15, or 8 µs-26 ms with ~90% of the myelin T2* <1000 µs16). Yet, other studies used three-component super Lorentzian fitting and revealed the existence of a very short T2* (~ 5 µs) component6. This multi-compartment approach may also reveal other short T2* components from RBC membranes. In addition, we only used 7 TEs for the T2* measurement. For more precise measurements, larger numbers of TEs will be required. This T2* measurement will also affect the T1 measurement through the VFA approach, as the flip angle should be corrected due to fast transverse relaxation during the RF excitation for ultrashort T2 tissues. The T1 was updated to 189±7 ms from 127±7 ms after the flip angle correction based on the T2* measurement via mono-exponential fitting. A signal decay model that accounts for super Lorentzian line shape may allow more accurate flip angle correction and subsequent T1 measurement. Still, our T1 measurement roughly parallels the result from a previous study that reports T1 of ~234 ms from the short T2 component of the white matter12. Overall, these measurements of relaxation times of RBC membranes will guide towards optimized UTE sequences for direct imaging of cell membranes and myelin in vivo.Conclusion
We demonstrated the feasibility of 3D UTE sequences to directly image and quantify the protons on semi-solid membrane lipids. We also measured the T1 (189 ms) and T2* (77 ~ 252 µs) of the RBC membrane lipids to optimize sequences for in vivo lipid imaging.Acknowledgements
The authors acknowledge grant support from the National Institutes of Health (RF1AG075717), VA Clinical Science and Rehabilitation Research and Development Services (Merit Awards I01CX002211), and GE Healthcare.
References
1. P Devarajan, Cellular and molecular derangement in acute tubular necrosis. Curr Opin Pediatr. 2005;17:193-199.
2. C Lucchinetti, W Bruck, J Parisi et al., Heterogeneity of multiple sclerosis lesions: Implications for the pathogenesis of demyelination. Annal Neurol. 2000;47:707-717.
3. RA Horch, JC Gore, MD Does. Origins of the ultrashort-T2 1H NMR signals in myelinated nerve: A direct measure of myelin content? Magn Reson Med. 2011;66:24-31.
4. J Du, Carl, M Bydder et al., Qualitative and quantitative ultrashort echo time (UTE) imaging of cortical bone. J Magn Reson. 2010;207:304-311.
5. V Sheth, H Shao, J Chen et al. Magnetic resonance imaging of myelin using ultrashort echo time (UTE) pulse sequences: phantom, specimen, volunteer and multiple sclerosis patient studies. Neuroimage. 2016;136:37-44.
6. EL Baadsvik, M Weiger, R Froidevaux et al. Mapping the myelin bilayer with short-T2 MRI: Methods validation and reference data for healthy human brain. Magn Reson Med. 2022; doi:10.1002/mrm.29481.
7. M Carl, M Bydder, J Du et al. Optimization of RF excitation to maximize signal and T2 contrast of tissues with rapid transverse relaxation. Magn Reson Med. 2010;64:481-490.
8. H Wennerstrom. Proton nuclear magnetic resonance line shapes in lamellar liquid crystals. Chem Phys Lett. 1973;18:41-44.
9. MacKay A, Laule C, Vavasour I, Bjarnason T, Kolind S, Madler B. Insights into brain microstructure from the T2 distribution. Magn Reson Imaging 2006; 24:515-525.
10. Weiger M, Froidevaux R, Baadsvik EL, Brunner DO, Rosler MB, Pruessmann KP. Advances in MRI of the myelin bilayer. Neuroimage 2020; 217:116888.
11. Du J, Ma G, Li S, Carl M, Szeverenyi N, VandenBerg S, Corey-Bloom J, Bydder GM. Ultrashort TE echo time (UTE) magnetic resonance imaging of the short T2 components in white matter of the brain using a clinical 3T scanner. NeuroImage 2013; 87C:32-41. PMID: 24188809.
12. J Du, V Sheth Q He et al. Measurement of T1 of the ultrashort T2* components in white matter of the brain at 3T. PLoS One. 2014;9:e103296.
13. Sheth V, Fan S, He Q, Ma Y, Annesse J, Switzer R, Corey-Bloom J, Bydder GM, Du J. Inversion recovery UTE magnetic resonance imaging: a method for simultaneous direct detection of myelin and high signal demonstration of iron deposition in the brain–a feasibility study. Magn Reson Imaging 2017; 38:87-94.
14. He Q, Ma M, Shao H, Sheth V, Bydder G, Du J. Direct magnitude and phase imaging of myelin using ultrashort echo time (UTE) pulse sequences: a feasibility study. Magn Reson Imaging 2017; 39:194-199.
15. Fan S, Ma Y, Chang EY, Bydder GM, Du J. Inversion recovery ultrashort echo time imaging of ultrahort T2 tissue components in ovine brain at 3T: a sequential D2O exchange study. NMR Biomed 2017; 30:e3767.
16. Wilhelm MJ, Ong HH, Wehrli SL, Li C, Tsai PH, Hackney DB, Wehrli FW. Direct magnetic resonance detection of myelin and prospects for quantitative imaging of myelin density. Proc Natl Acad Sci USA 2012; 109:9605-9610.
Figures
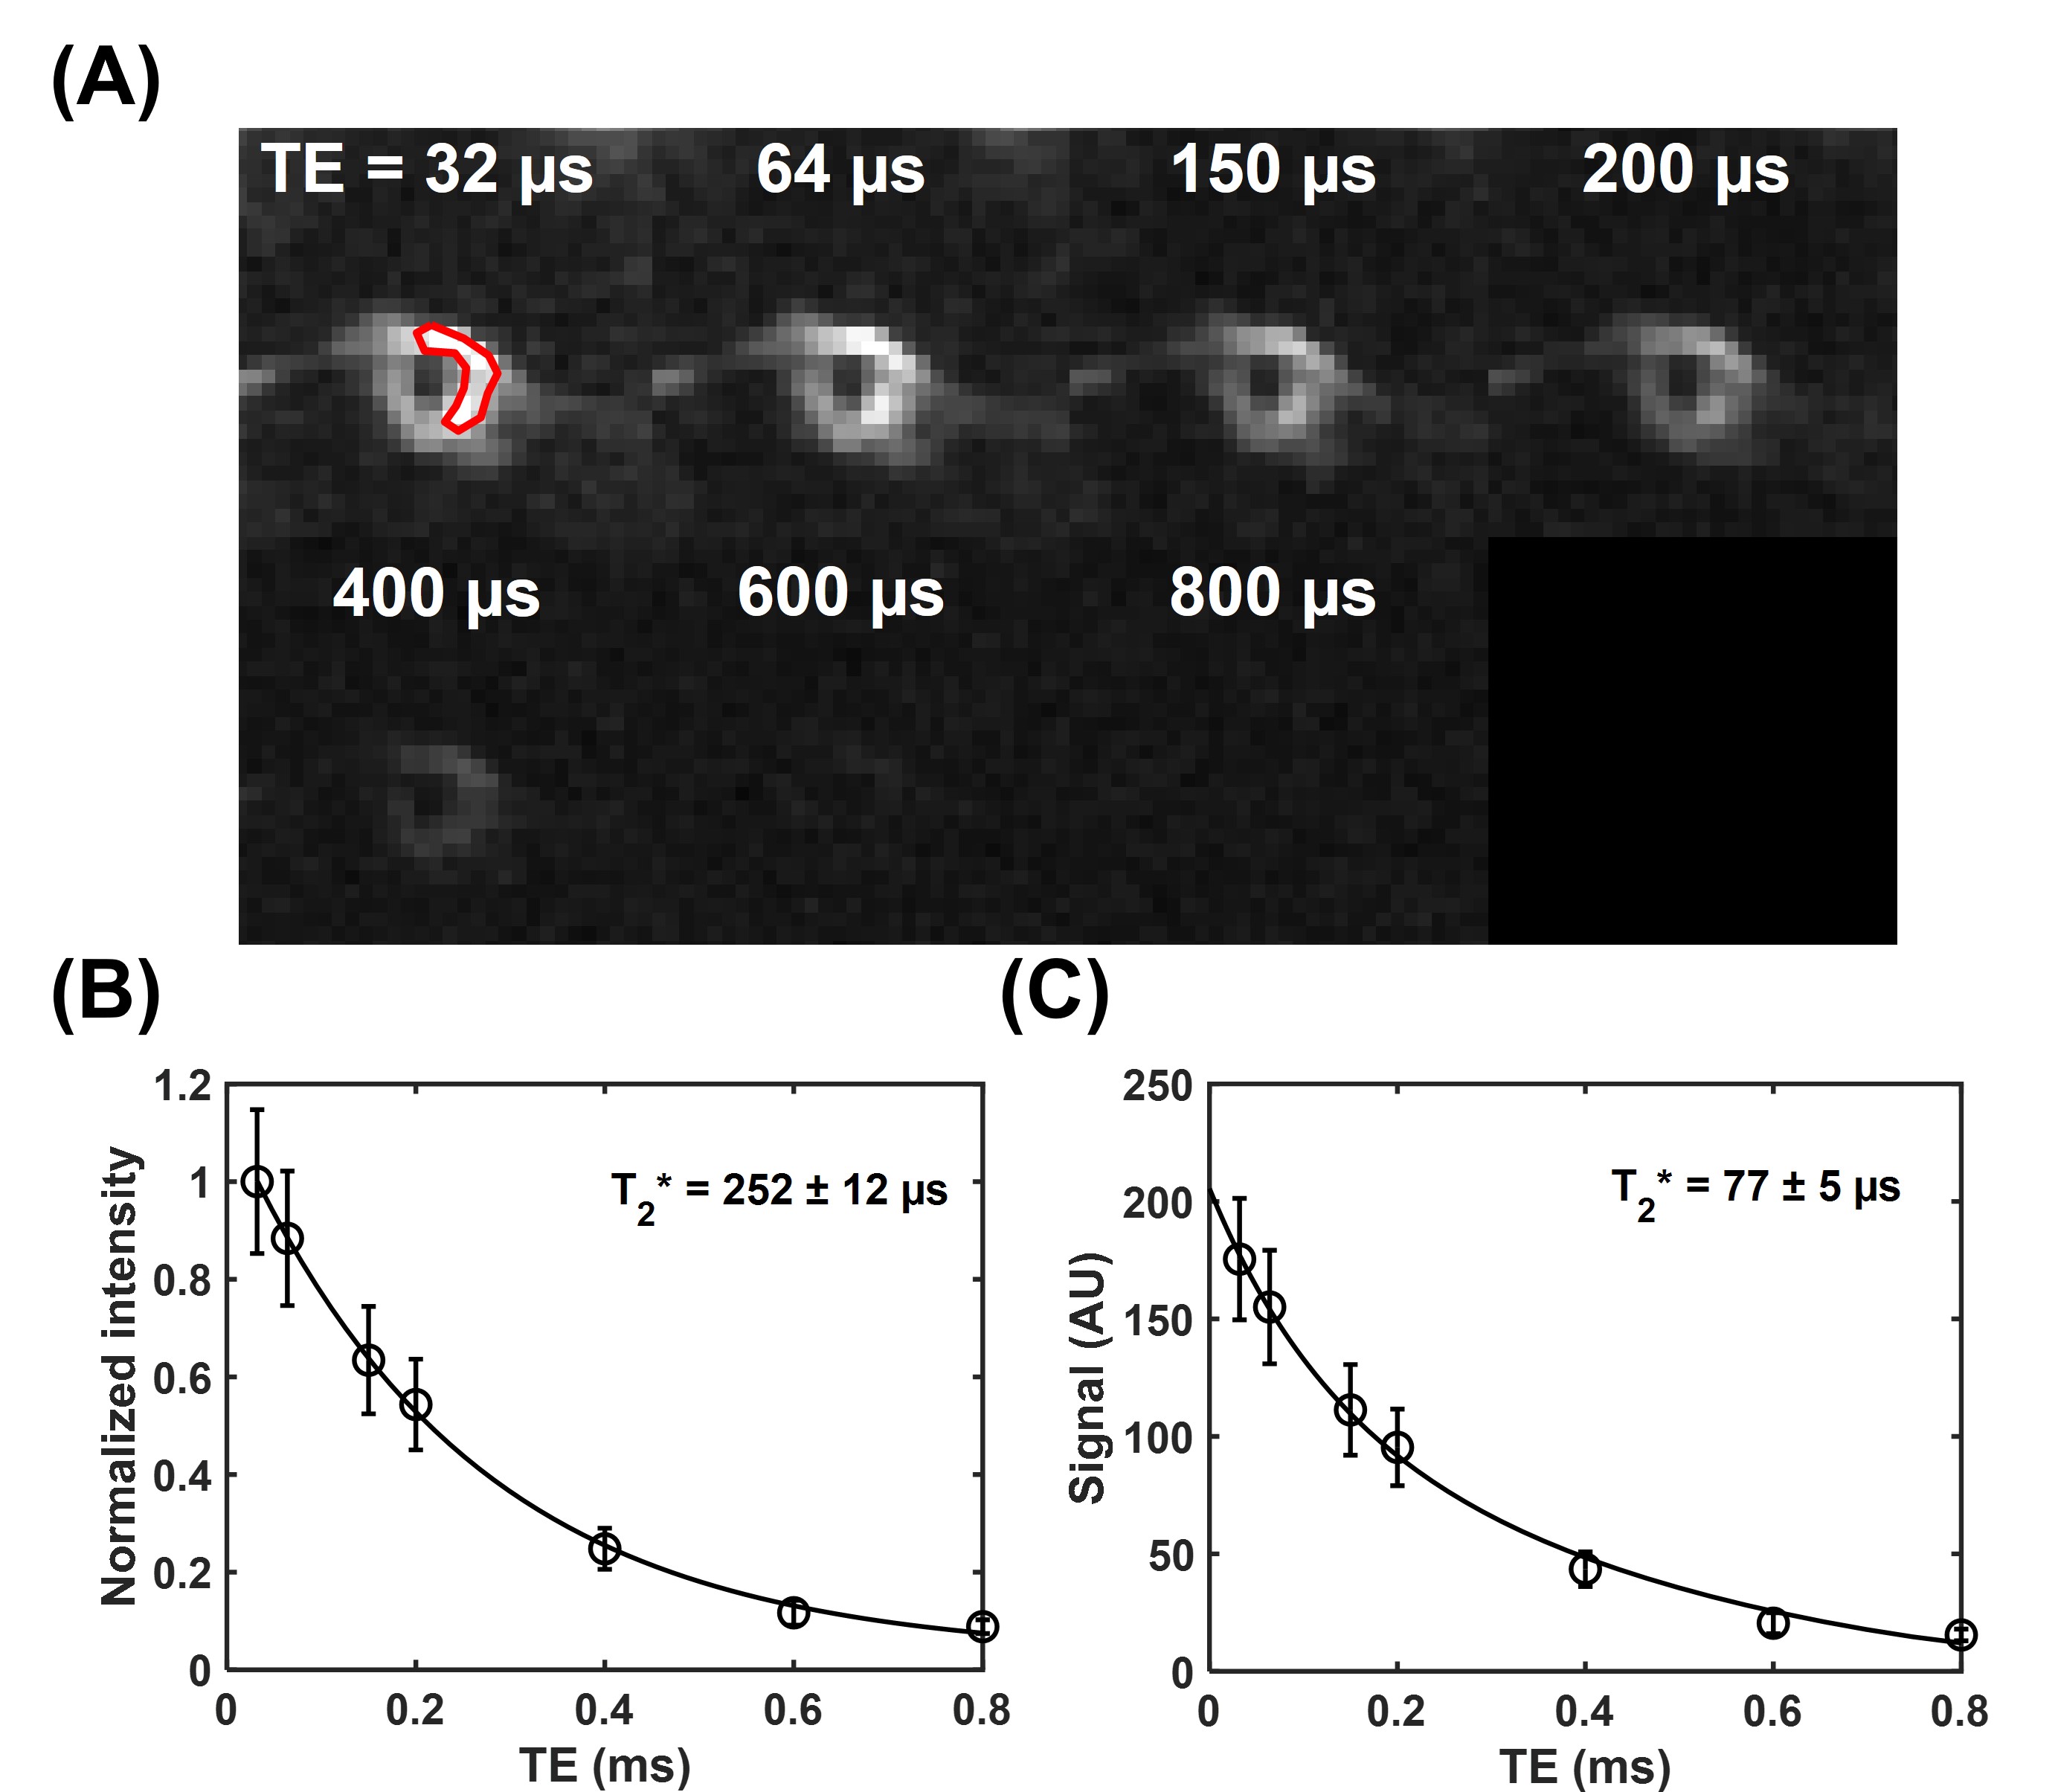
Figure 1. T2* measurement of the red blood cell (RBC) membrane lipid powder. (A) UTE images of the RBC membrane lipid powder were acquired at different echo times of 32 to 800 µs. A region of interest (red) was drawn on the first echo image for T2* measurement. (B) T2* measurement via mono-exponential fitting shows an ultrashort T2* of 252±12 µs. (C) T2* measurement via super Lorentzian fitting shows an ultrashort T2* of 77±5 µs.
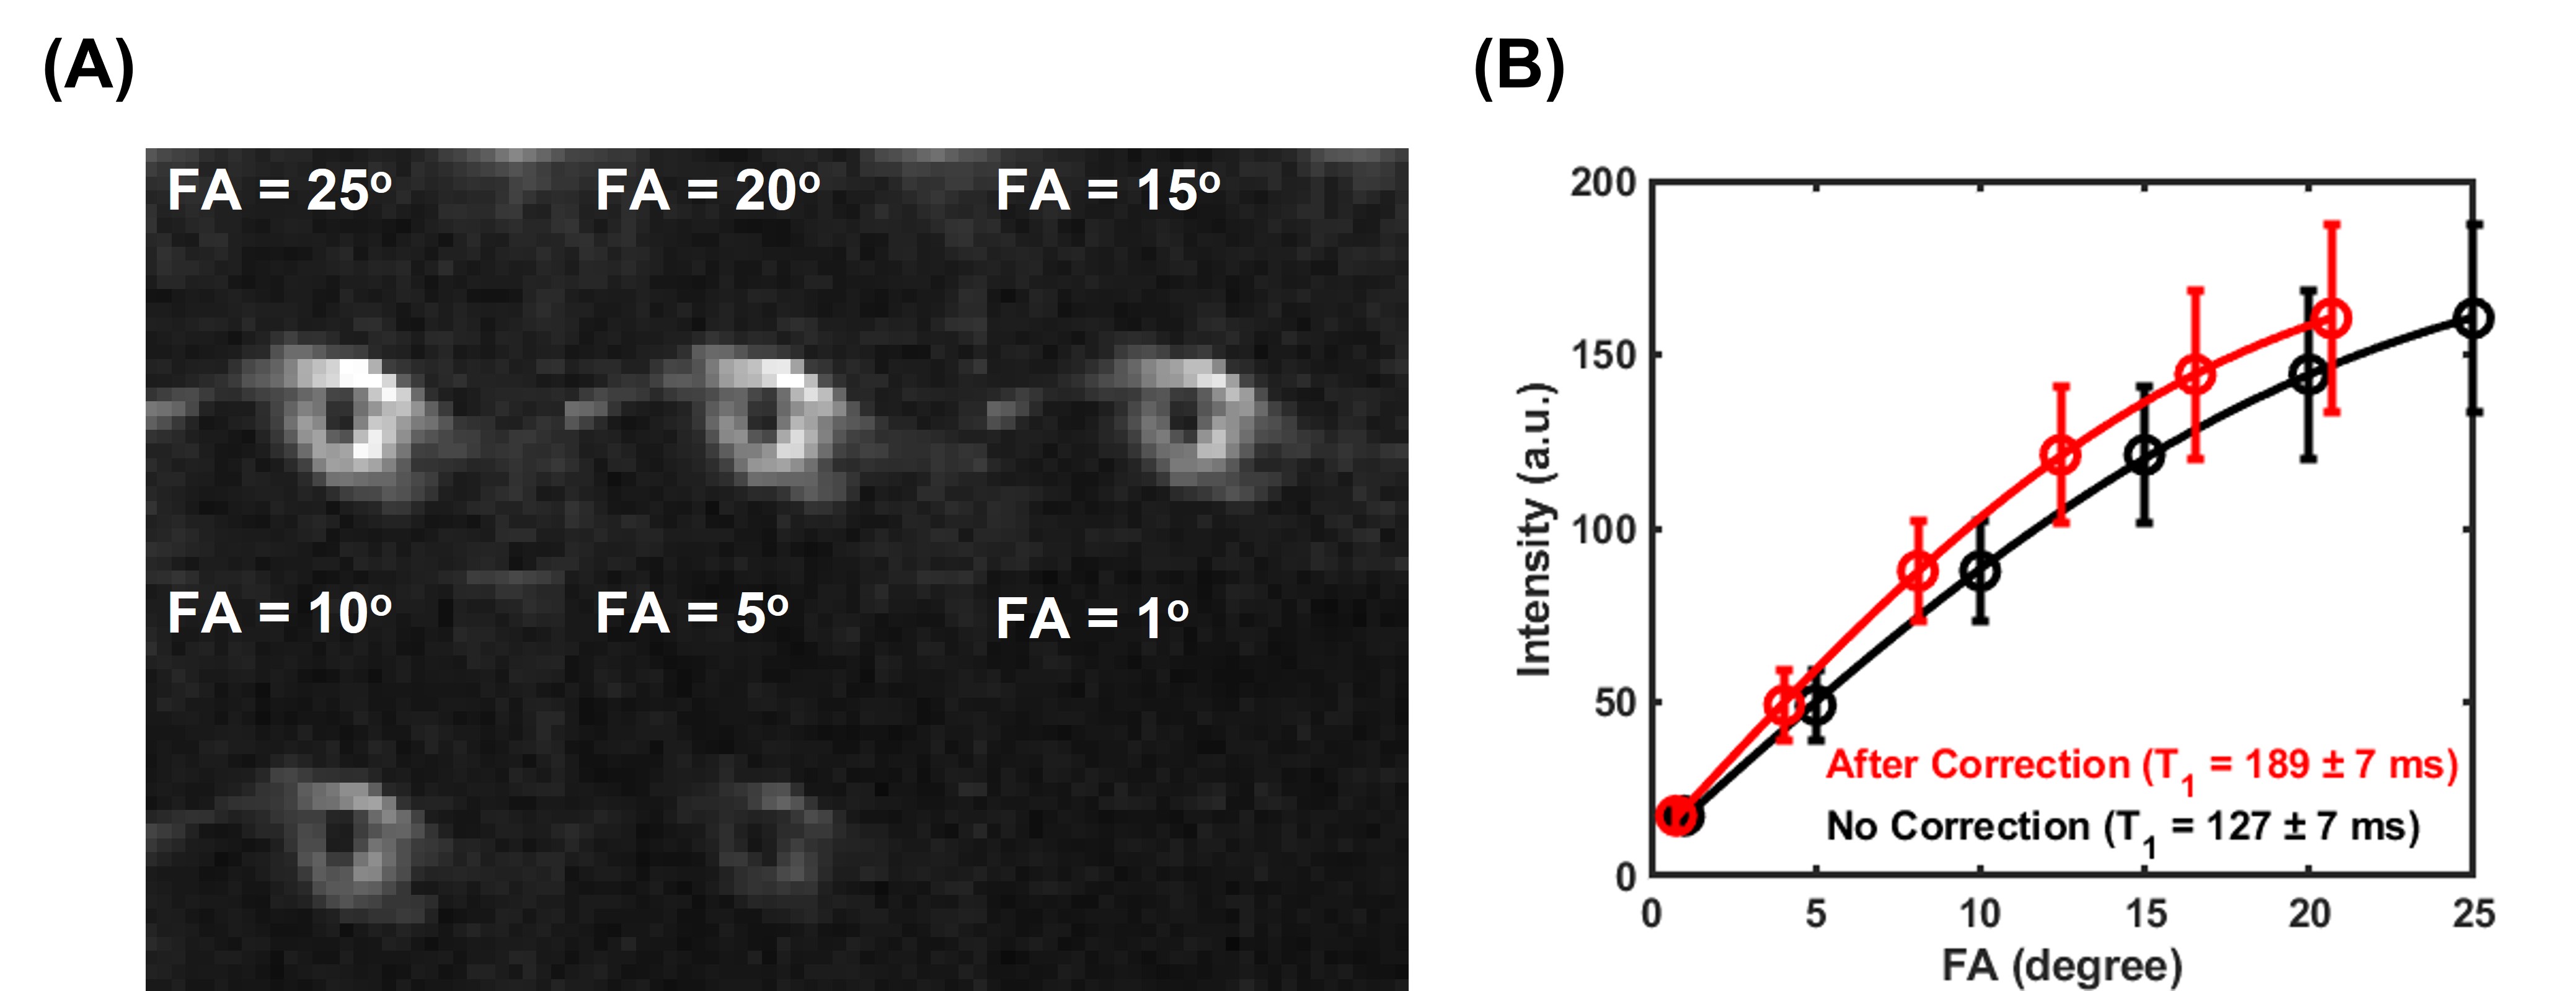
Figure 2. T1 measurement of the RBC membrane lipid powder. (A) UTE images of the RBC membrane lipid powder were acquired with different flip angles. (B) T1 measurements via the variable flip angle approach. The flip angles were corrected by considering transverse relaxation during RF excitation using T2* values from mono-exponential fitting. The T1 was measured to be 127±7 ms without correction (black) and 189±7 ms with correction via mono-exponential fitting (red).