5102
Repeatability of Hyperpolarized Xenon-129 4D Imaging1Radiology, University of Pennsylvania, Philadelphia, PA, United States, 2University of Pennsylvania, Philadelphia, PA, United States
Synopsis
Keywords: Quantitative Imaging, Lung, Hyperpolarized MRI
In order to image function in the free breathing lung with high temporal and special resolution, we have developed a methodology that can be used in combination with a non-rigid image registration technique to generate comprehensive quantitative maps of lung ventilation and gas exchange. For these HP MRI-derived regional parameters to produce meaningful information that can be used to characterize lung disorders, a reproducibility study that systematically assesses the variability of these parameters is needed. Here, we assess the reproducibility of our previously reported dynamic hyperpolarized imaging measurements between two sessions separated by minutes.Introduction
Ventilation in the lung is driven by the resolution of differential pressures and concentration gradients over multiple timescales. It is known that not every region of a compromised (e.g., by disease) lung reaches its maximum volume change at end-inhale, or its minimum at end-exhale [1]. Further, since ventilation inhomogeneity occurs in regions where local gas filling time-constants are comparable to or exceed inhalation time, artificially reducing breathing rate during a measurement via breath-hold fails to highlight regions that do not properly fill during normal breathing but do adequately fill during the measurement. While critical to a healthy lung [2–6], these dynamical effects are not accessible to single-breath imaging, which remains the main polarized gas imaging methodology in use. Lung function relies on dynamic aspects of gas mixing in a constantly moving organ and restricting imaging to a specific, artificially-induced state therefore inevitably fails to capture features crucial to maintaining organism homeostasis, making it difficult to compare measurements between subjects if the exact same state is not achieved. Imaging respiratory dynamics during spontaneous breathing, using a small dose of hyperpolarized gas ad libitum, can dynamically depict true physiological gas flow in patients without changing their breathing pattern, and thus potentially provide a better understanding of lung disease pathophysiology. For HP MRI-derived regional parameters to produce meaningful information for characterizing lung disorders, a reproducibility study that systematically assesses the variability of these parameters is needed. Only a few studies investigating the regional repeatability of HP gas imaging in human lungs have been reported, all of which have carried out a limited number of trials and/or used limited sample sizes. Here, we assess the reproducibility of dynamic hyperpolarized imaging measurements taken minutes apart.Material and Methods
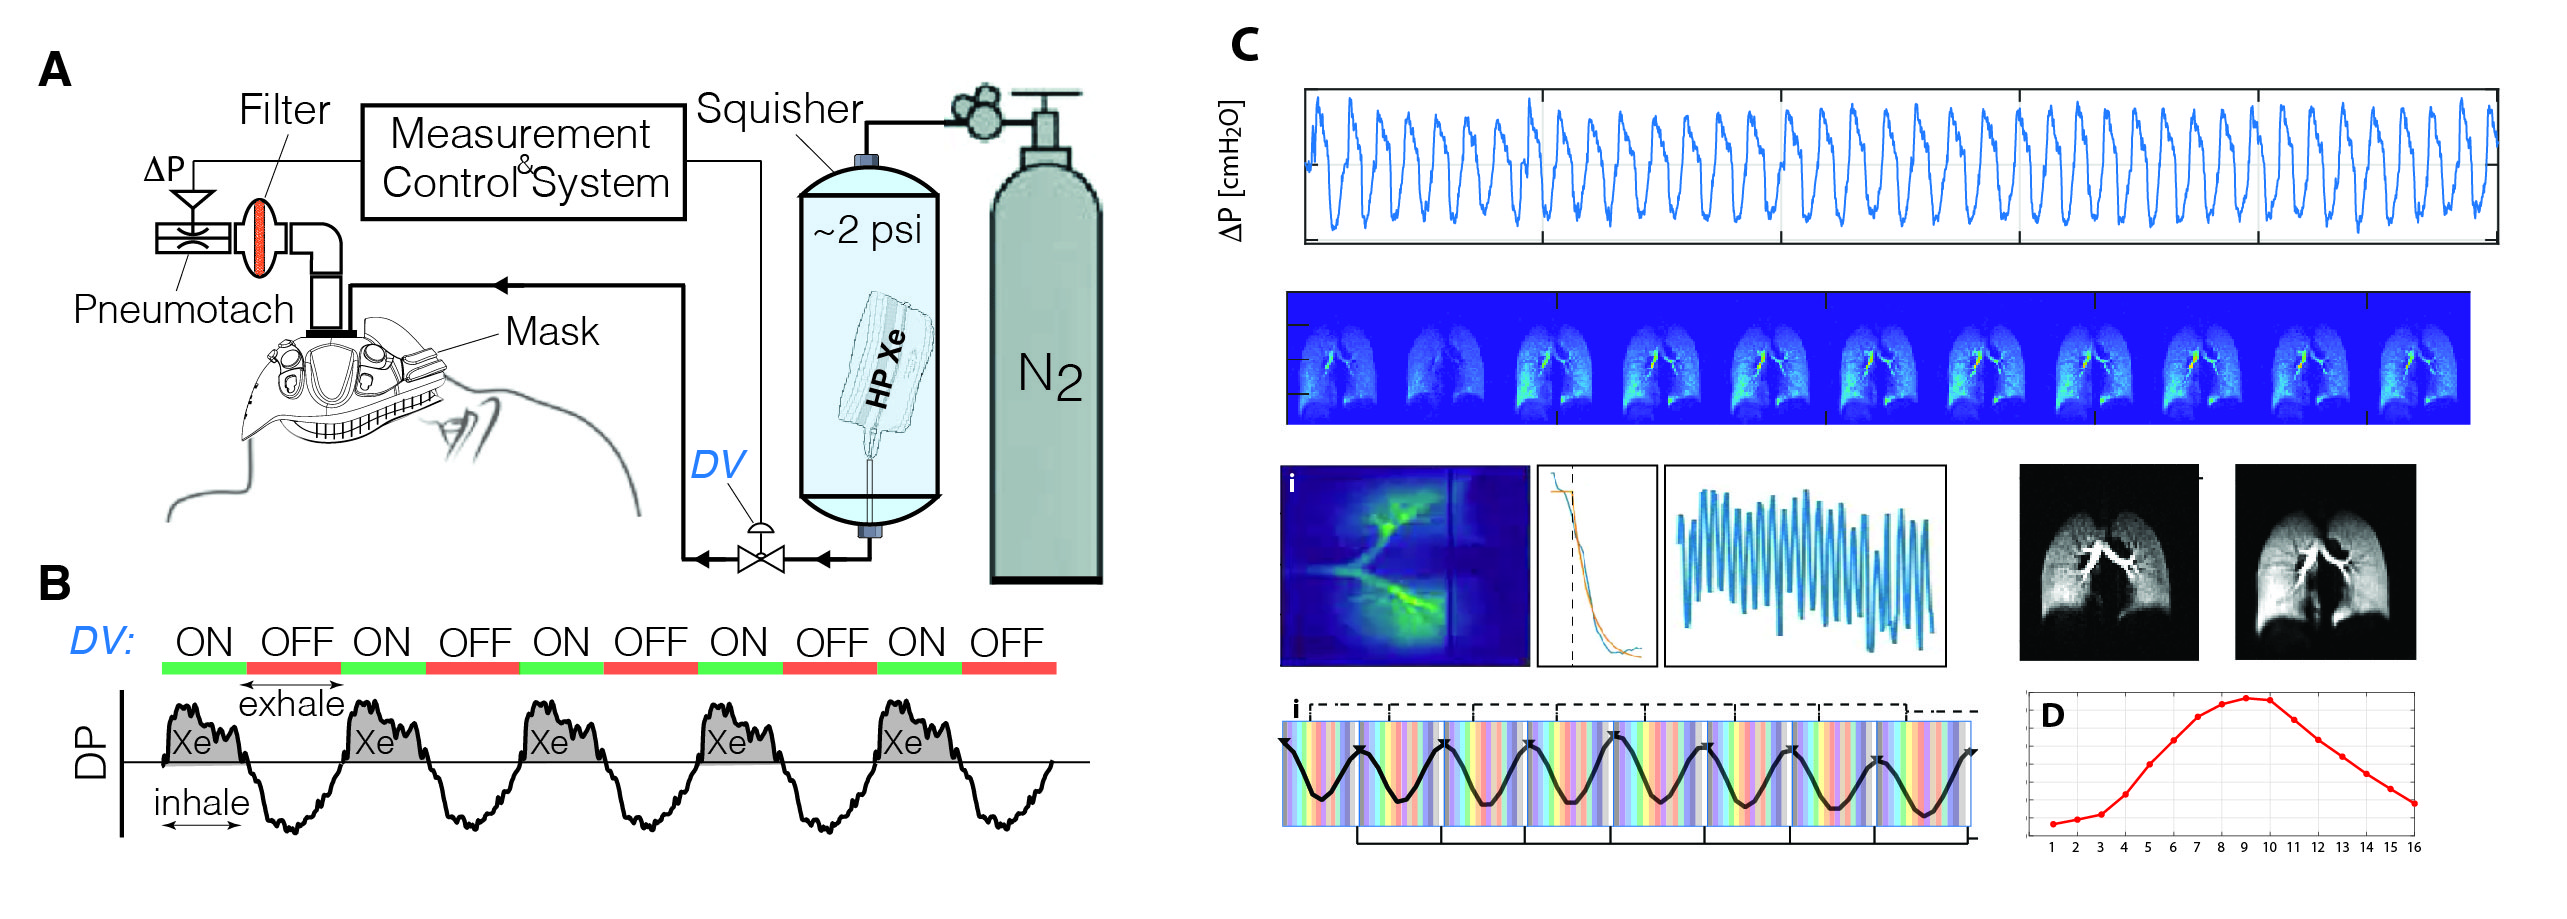
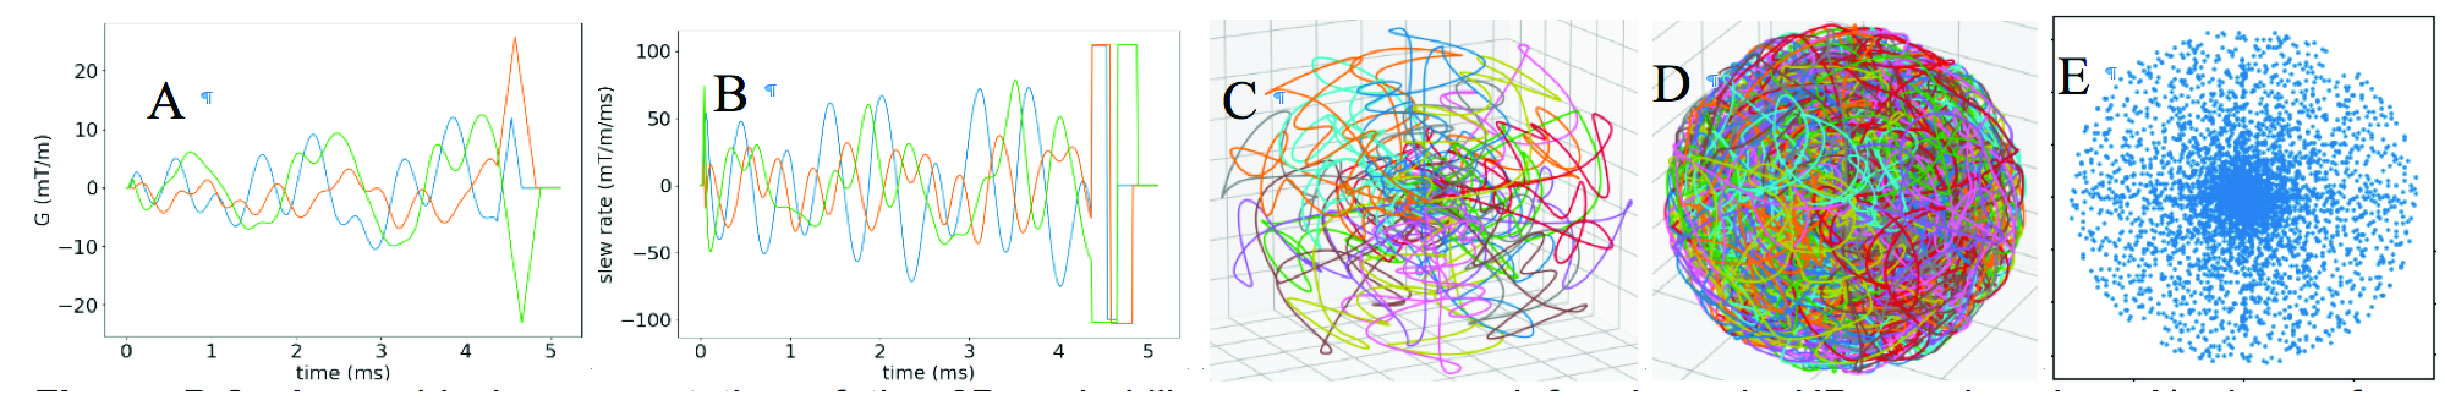
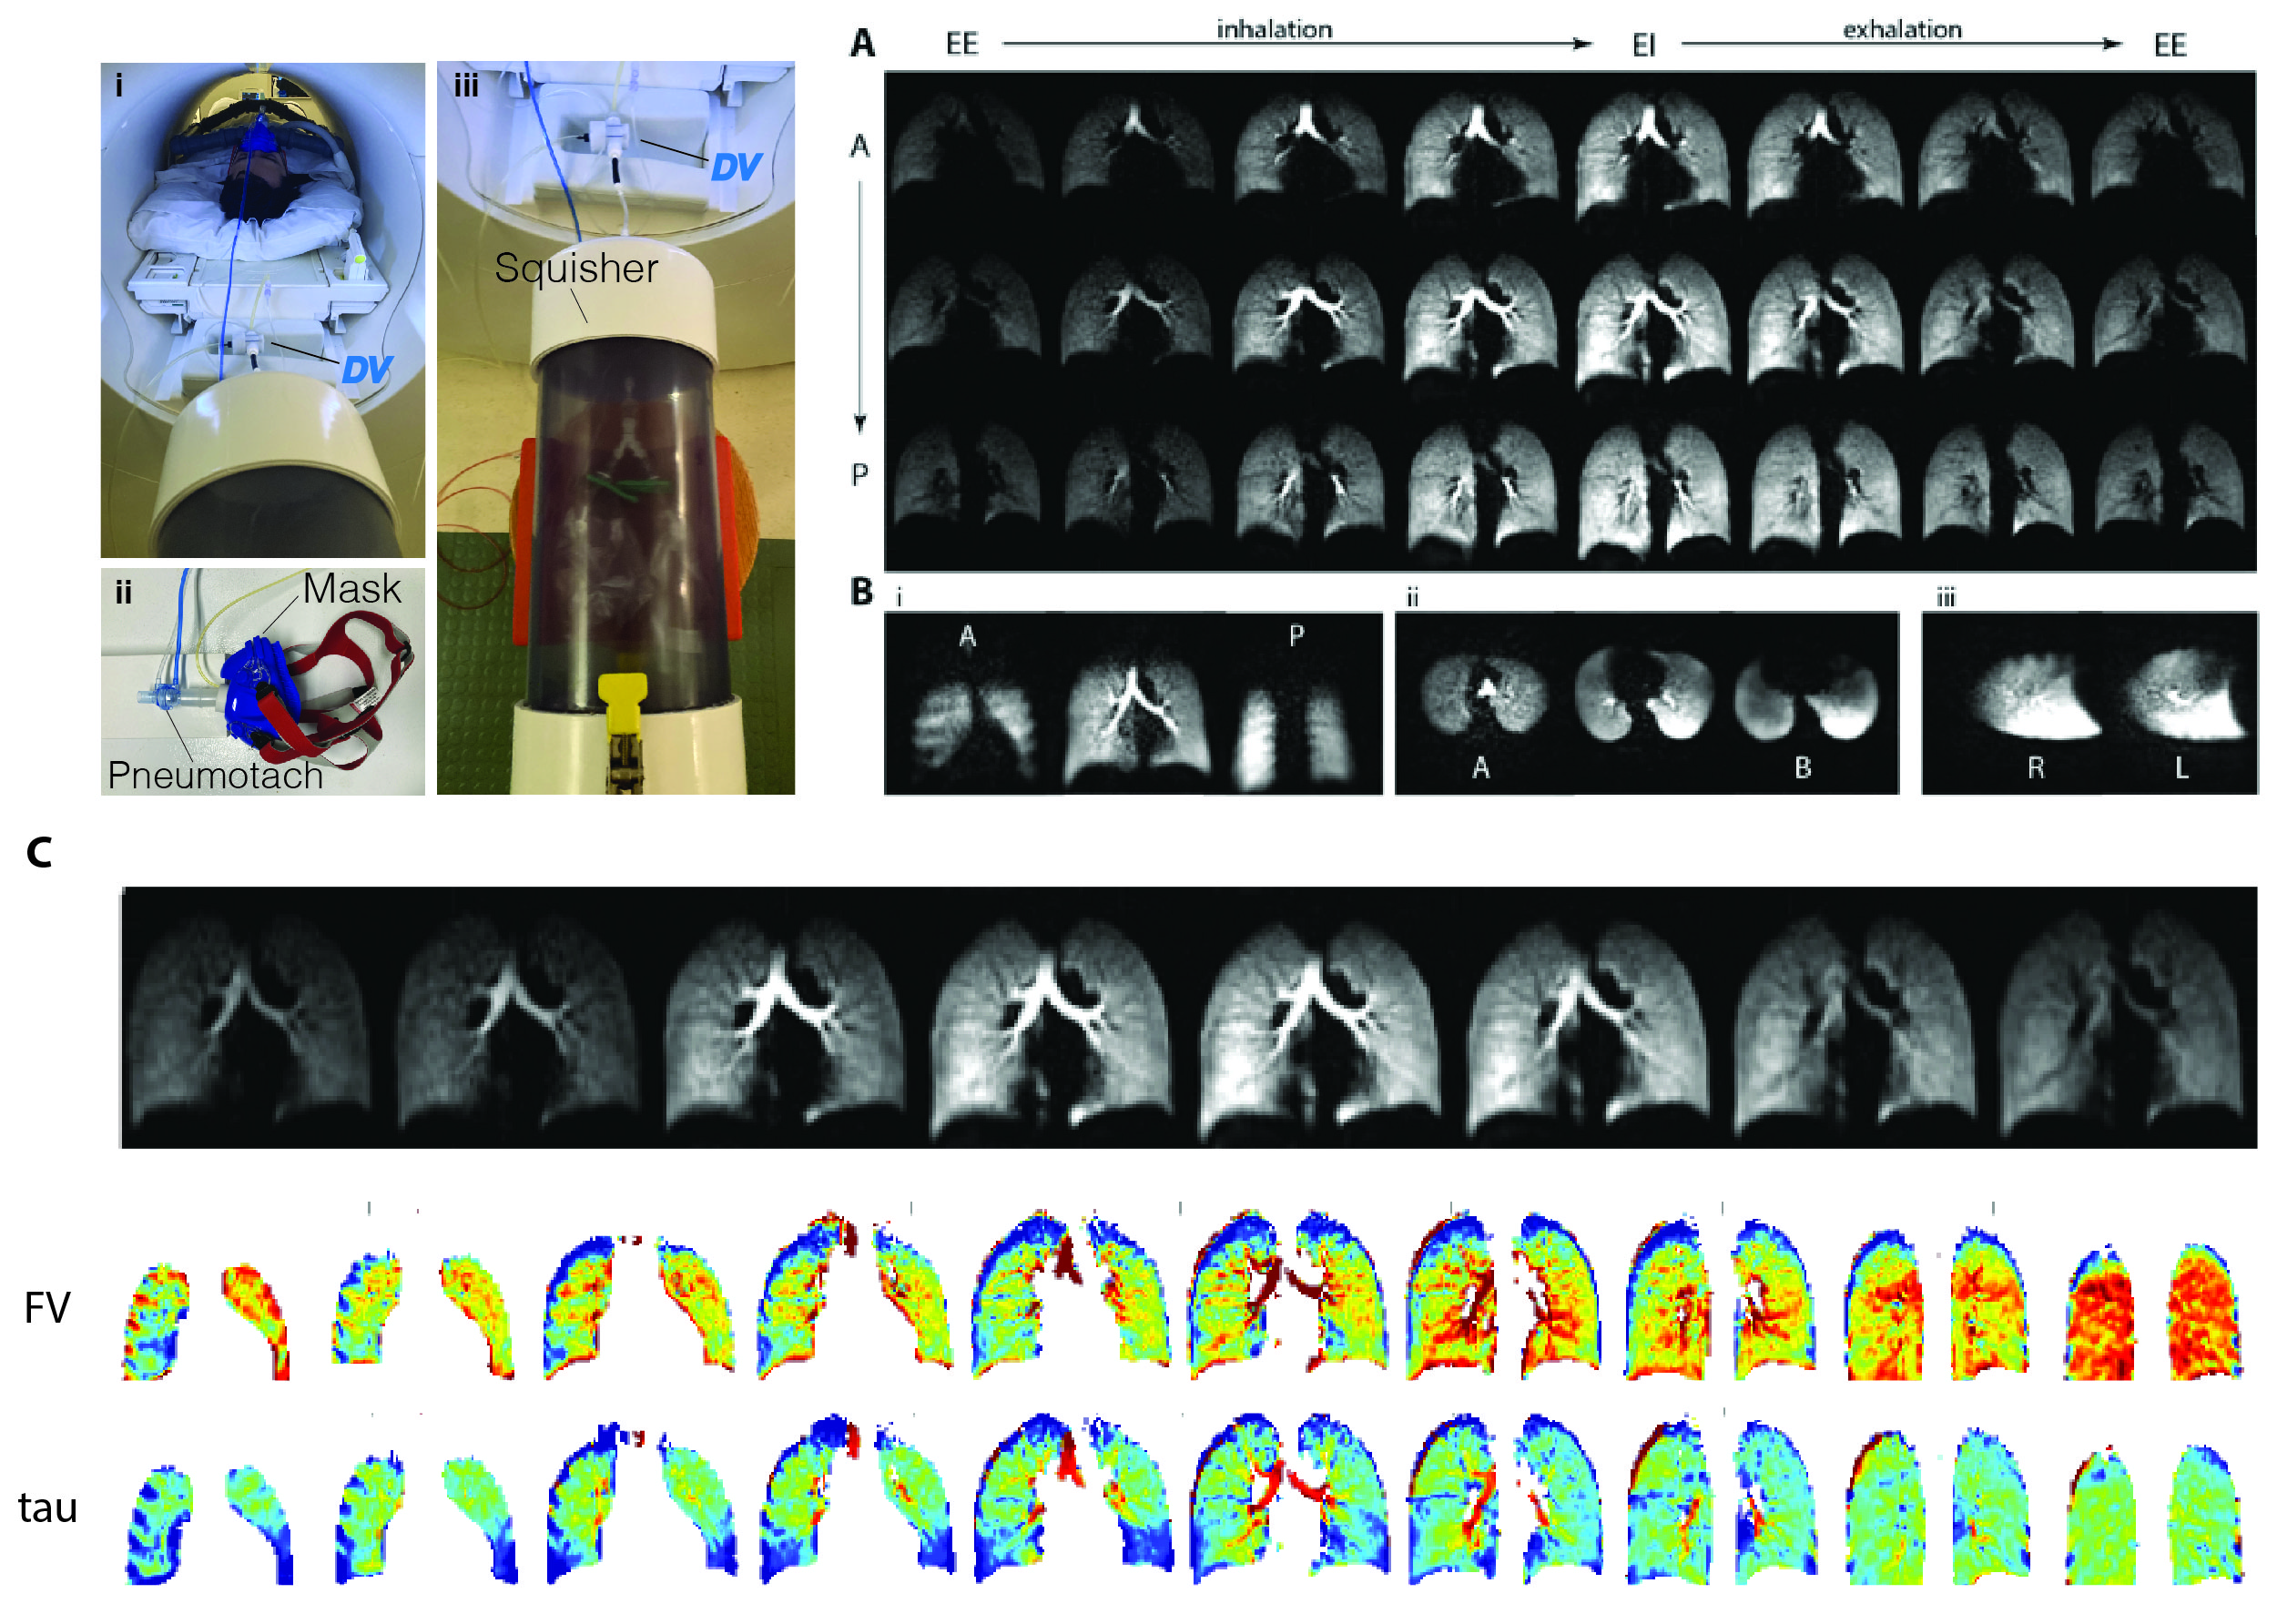
Imaging was performed in a 1.5T Siemens scanner using an 8-channel 129Xe coil (Stark, Germany) and the gas delivery system shown in Figure 1A, designed to enable continuous imaging during normal free breathing. Gas was delivered through a sealed facemask connected to a bi-directional pneumotach, allowing subjects to spontaneously inhale room air while 50 ml of HP gas is added to each breath. A total of 2.5L of HP gas was delivered in ~5 minutes during a complete cycle of ~50 breaths, as shown in the schematic (Figure 1B); ~1000 under-sampled images were acquired continuously using 32 interleaved spirals with equal angular spacing, passing through the vertices and faces of a regular icosahedron (Figure 2) with TR/TE=7.8/0.8ms and a flip angle of 4˚ to generate the fully sampled images (80×80×80 matrix), achieving a resolution of 4.375×4.375×4.375 mm3. The diaphragm position over time was used to bin each individual spiral interleave into 16 distinct inflation phases for image reconstruction during one dynamic breathing cycle (Figure 1C). After registering all images to the end-inhale phase using a 3D nonrigid b-spline technique, the 16-phase periodic time-varying signal dynamics at each voxel were analyzed to generate maps of regional functional residual capacity (FRC) and tidal volume (TV); fractional ventilation (FV) and arrival time (tau) were quantified to show how well fresh gas mixes with residual gas in the lungs (FV) and how fast fresh gas reaches the parenchyma relative to large airways (t), thus quantifying uneven ventilation. This measurement was repeated back-to-back in a healthy 27-year-old male to measure the regional repeatability of ventilation markers.Results and Discussion
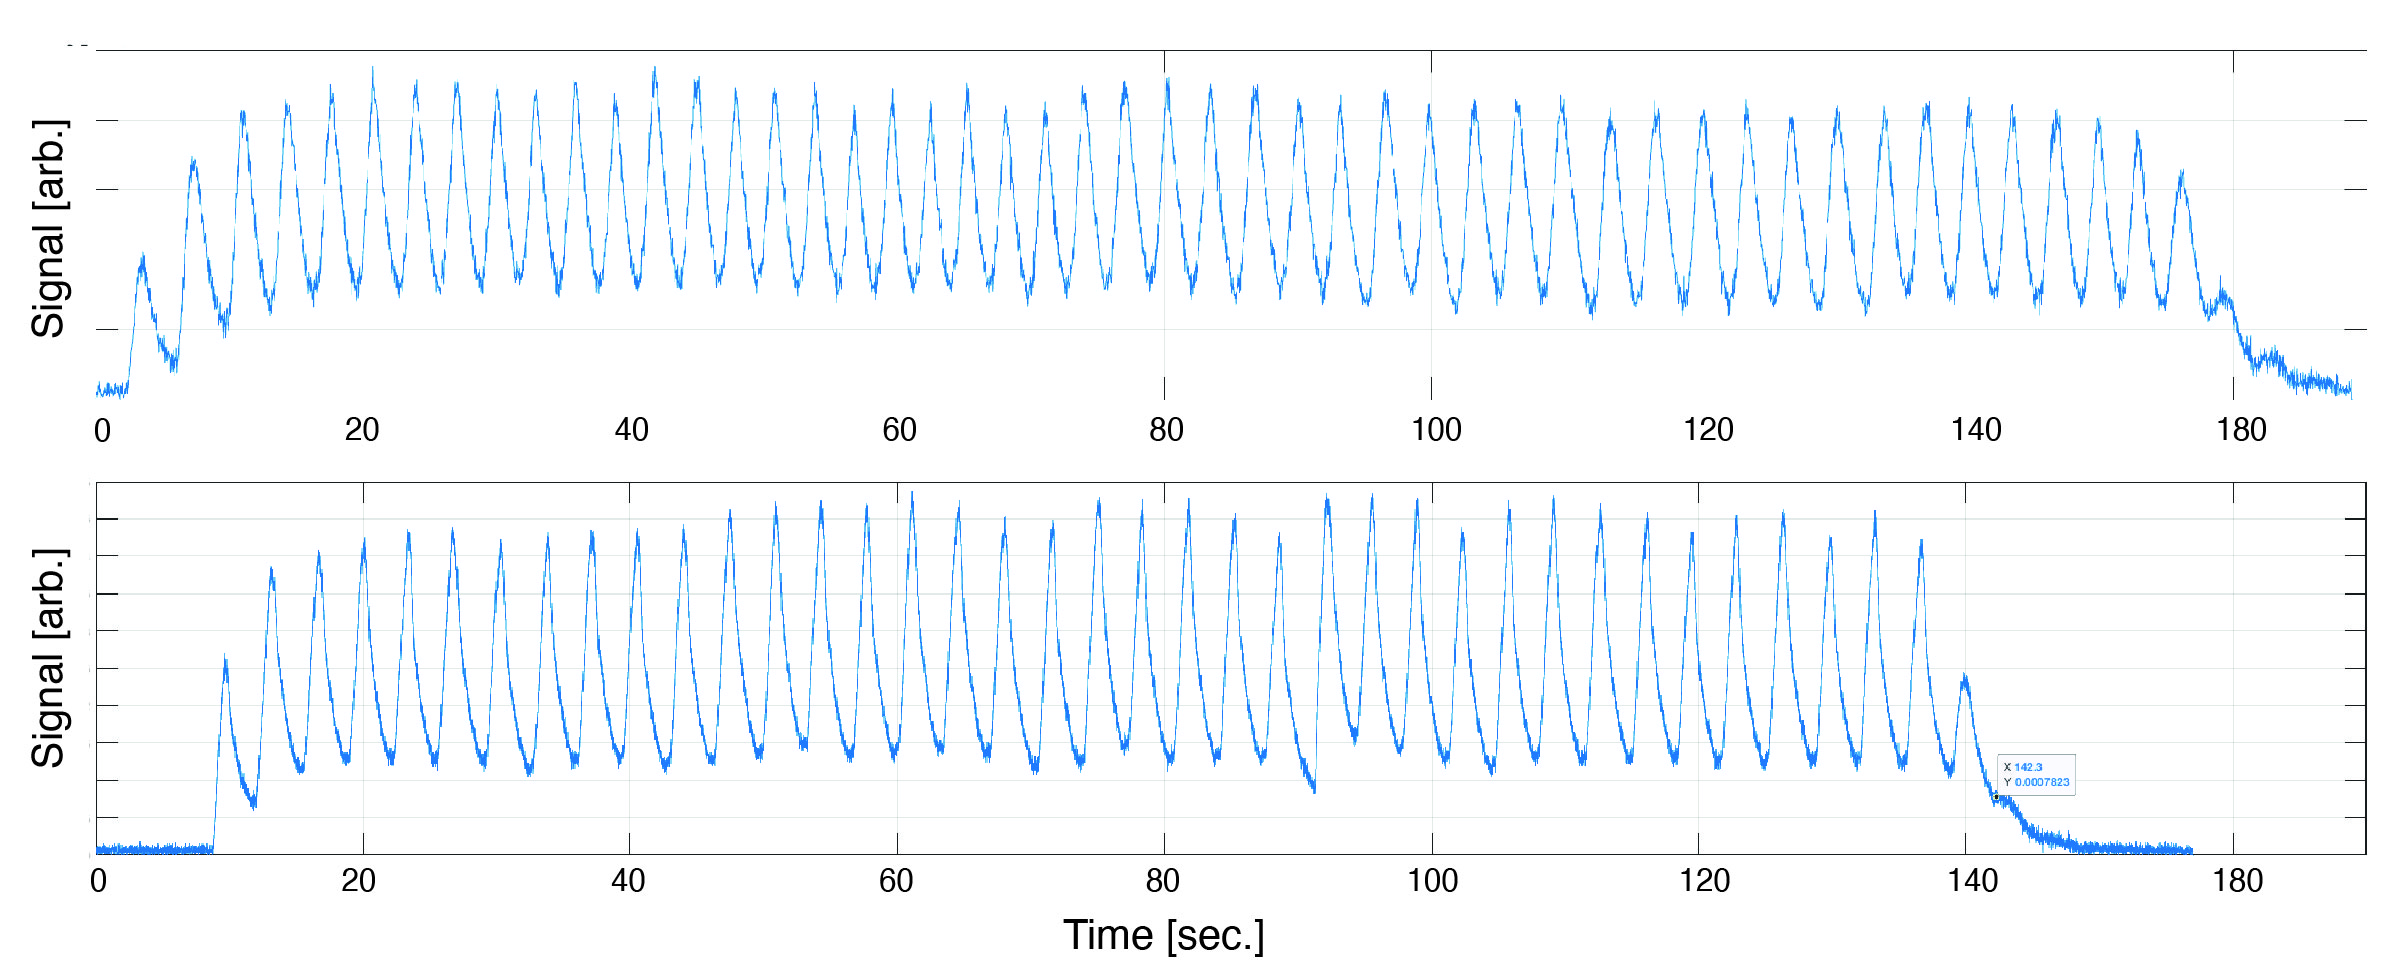
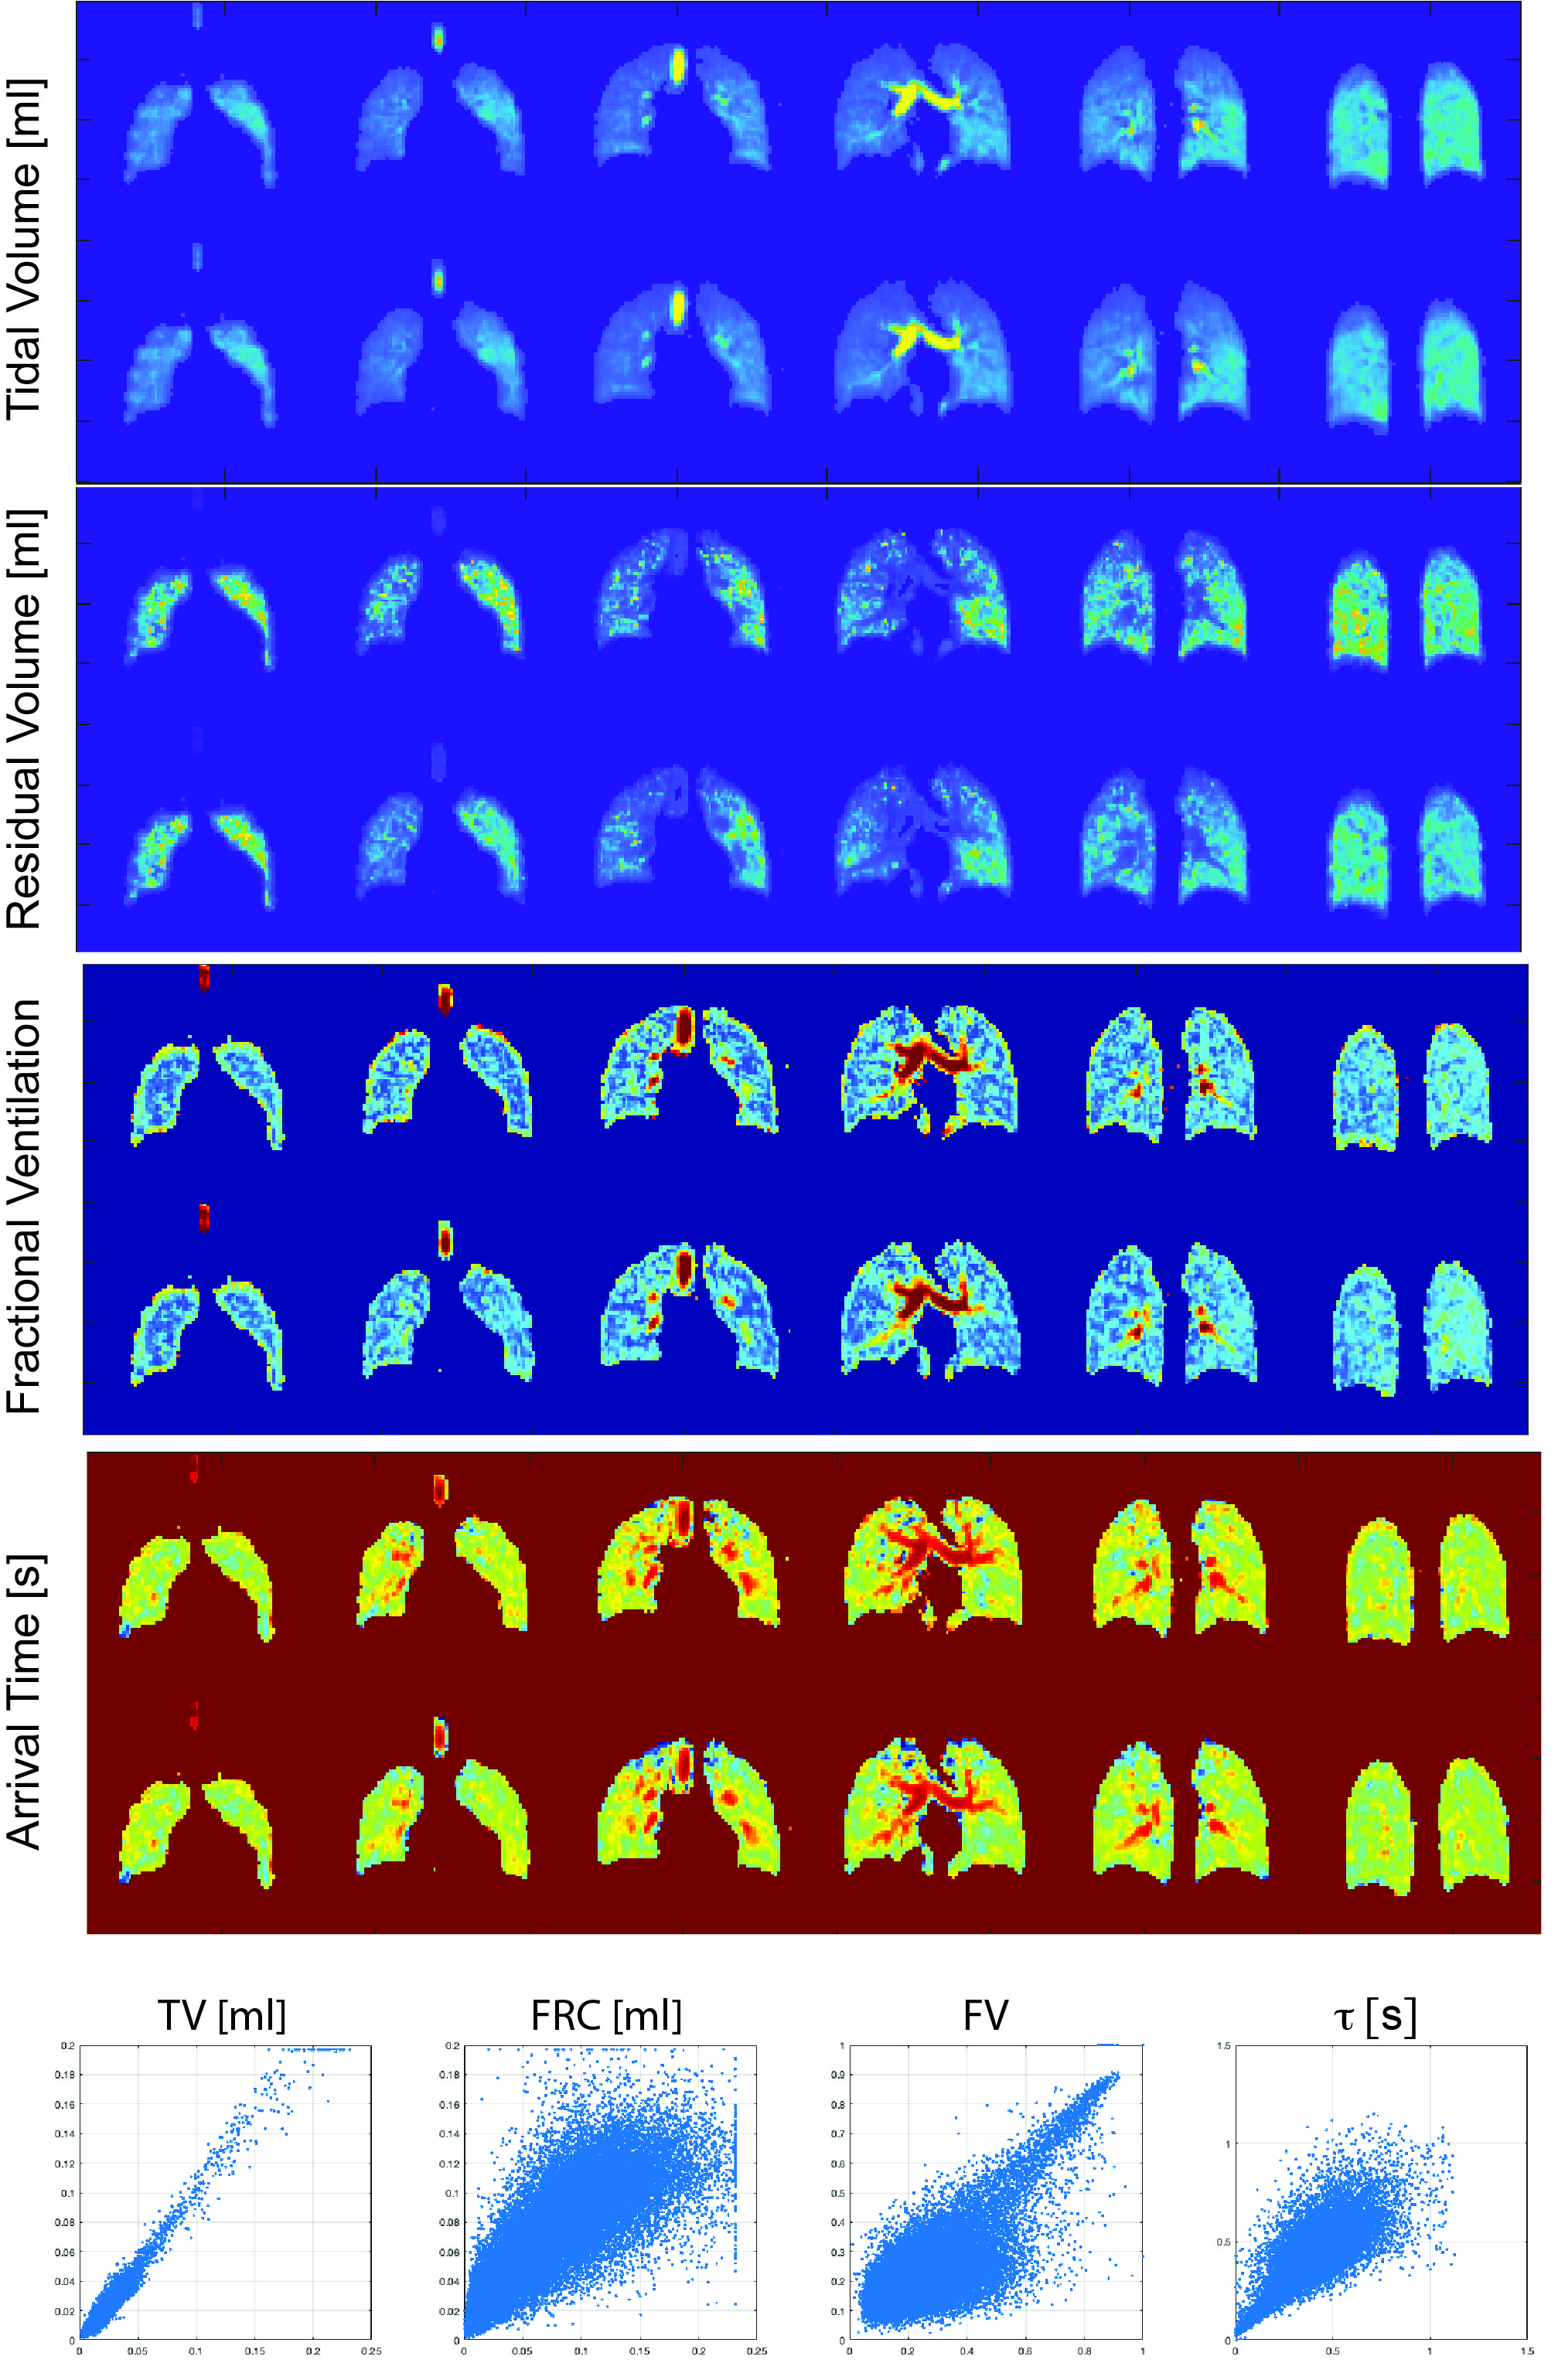
Seven subjects (2 healthy controls, 5 transplant patients) have thus far been imaged using the above protocol (refer to abstract #8082). Dynamic images in a healthy volunteer for three representative coronal (A), axial and sagittal slices (B) are illustrated in Figure 3, showing the excellent isotropic spatial and temporal resolution achieved using our proposed approach. Figure 3C shows the results of registration in one representative slice, alongside the quantified maps of FV and arrival time (Tau). Figure 4 shows the signal dynamics during spontaneous breathing in the subject who underwent back-to-back imaging, showing a breathing rate of 18 breath per minutes in the two sessions (fewer images were acquired in the second session due to slightly less polarized gas being available, resulting in ~10 fewer breaths of imaging gas). Figure 5 shows maps of ventilation markers for both measurements as well as the voxel-by-voxel correlations in this one subject. The test-retest correlation was highest in measures of regional TV (r=0.9844), followed by FRC (r=0.8313). The maps of FV correlated very well (r=0.7614); the correlation for arrival time was r=0.6864.Conclusion
Not only is imaging during normal breathing is easier to perform when compared to static single-breath imaging during a non-physiological breath-hold, it also better illustrates out-of-phase regional ventilation and other physiological aspect of lung function. The voxel-by-voxel correlation of back-to-back measures of ventilation markers produced by dynamic imaging was good-to-excellent in one healthy subject.Acknowledgements
No acknowledgement found.References
1 Shao W, Patton TJ, Gerard SE, Pan Y, Reinhardt JM, Durumeric OC, et al. N-Phase Local Expansion Ratio for Characterizing Out-of-Phase Lung Ventilation. IEEE Trans Med Imaging 2020;39:2025–34. https://doi.org/10.1109/TMI.2019.2963083.
2 Rauwerda PE. Unequal ventilation of different parts of the lung and the determination of cardiac output. Thesis fully internal (DIV), Groningen: s.n.; 1946; 1946.
3 Bates JHT. Lung Mechanics: An Inverse Modeling Approach. Cambridge University Press; 2009.
4 Crawford AB, Makowska M, Paiva M, Engel LA. Convection- and diffusion-dependent ventilation maldistribution in normal subjects. J Appl Physiol Bethesda Md 1985 1985;59:838–46. https://doi.org/10.1152/jappl.1985.59.3.838.
5 Ugander M, Jense E, Arheden H. Pulmonary intravascular blood volume changes through the cardiac cycle in healthy volunteers studied by cardiovascular magnetic resonance measurements of arterial and venous flow. J Cardiovasc Magn Reson Off J Soc Cardiovasc Magn Reson 2009;11:42. https://doi.org/10.1186/1532-429X-11-42.
6 Brower R, Wise RA, Hassapoyannes C, Bromberger-Barnea B, Permutt S. Effect of lung inflation on lung blood volume and pulmonary venous flow. J Appl Physiol Bethesda Md 1985 1985;58:954–63. https://doi.org/10.1152/jappl.1985.58.3.954.
Figures