5101
Phantom T1rho and T2 relaxation times demonstrate good repeatability across sequences and scanner position1Stanford University, Stanford, CA, United States
Synopsis
Keywords: Quantitative Imaging, Cartilage, Repeatability
T2 and T1rho repeatability is essential for evaluating the small changes that occur during early osteoarthritis disease progression. In this study, we acquired phantom data on T2 and T1rho relaxation times across 6 time points as well as 3 distinct locations along the scanner for T2/T1rho 3D MAPSS and 3D qDESS with varying resolution for T2 mapping. We observed repeatability of the 4 quantitative MRI sequences that were well within the QIBA benchmark for phantom scans of 4-5%. Further, our data suggests that phantom positioning within the scanner bore did not affect repeatability or quantitative values.Introduction
T2 and T1rho relaxation times are widely used to study early microstructural changes in cartilage, which has been shown to be predictive of knee osteoarthritis (OA) progression1-3. Due to the relatively small changes (a few ms) in relaxation values in early disease4,5, methods to measure T2 and T1rho relaxation must have high repeatability to be sensitive to these early changes. This is a key aim of the QIBA MSK initiative, which aims to not only develop common quantitative imaging protocol (based on MAPSS)6 but also assess its repeatability across sites, vendors, and systems. In this work, we aim to evaluate the repeatability of QIBA sequences as well as another T2 mapping approach across time points and at various positions within the same scanner.Methods
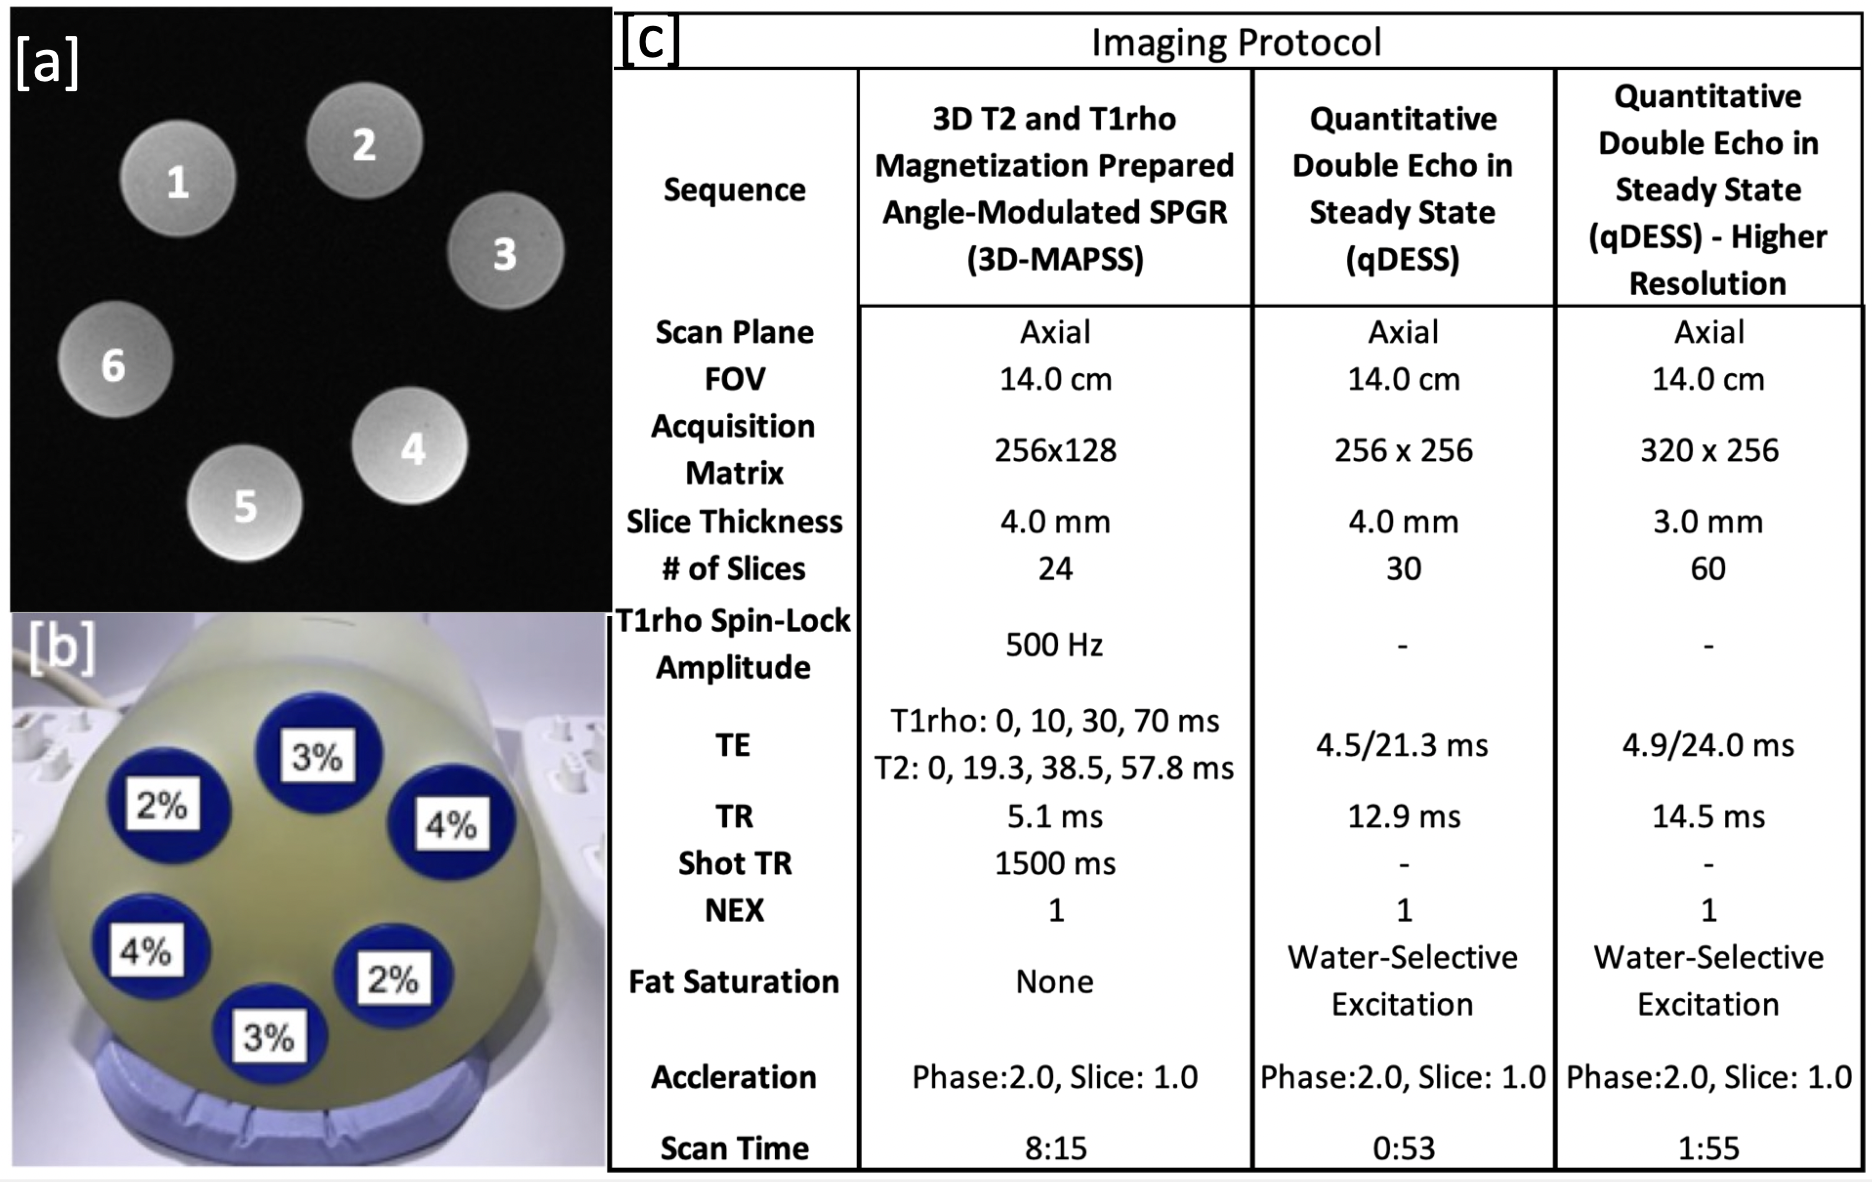
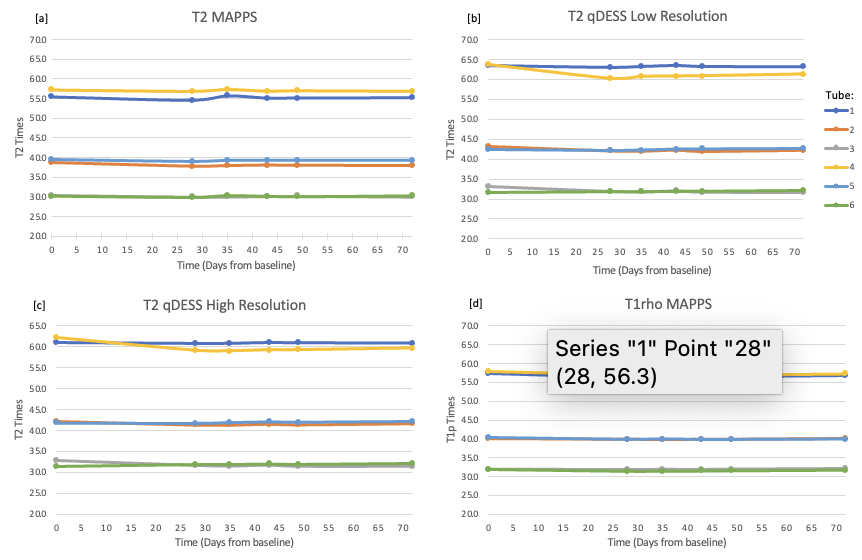
All scanning was performed on 3T whole body scanner (GE Signa Premier) using a transmit and receive 18 channel knee coil (QED). A phantom created in 2017, containing six agarose falcon tubes with various concentrations of agarose (2%, 3%, 4%) was used for scanning (Figure 1). Each agarose concentration was used in two tubes and resulted in T2 relaxation time values of approximately 60, 40 and 30ms, respectively.Phantom data was collected at baseline (day 0) and days 0, 28, 35, 43, 49, and 72 after baseline for a total of six scans (Figure 2). The MRI protocol for the scan was repeated a total of three sets per day scanning session. The phantom was first scanned at isocenter and then repeated a second and third time with the coil shifted 7cm to the left and right, respectively. 3D T2 and T1rho magnetization prepared MAPSS and quantitative double-echo in steady-state (qDESS ) at 2 different resolutions was acquired at each site (Figure 1c).
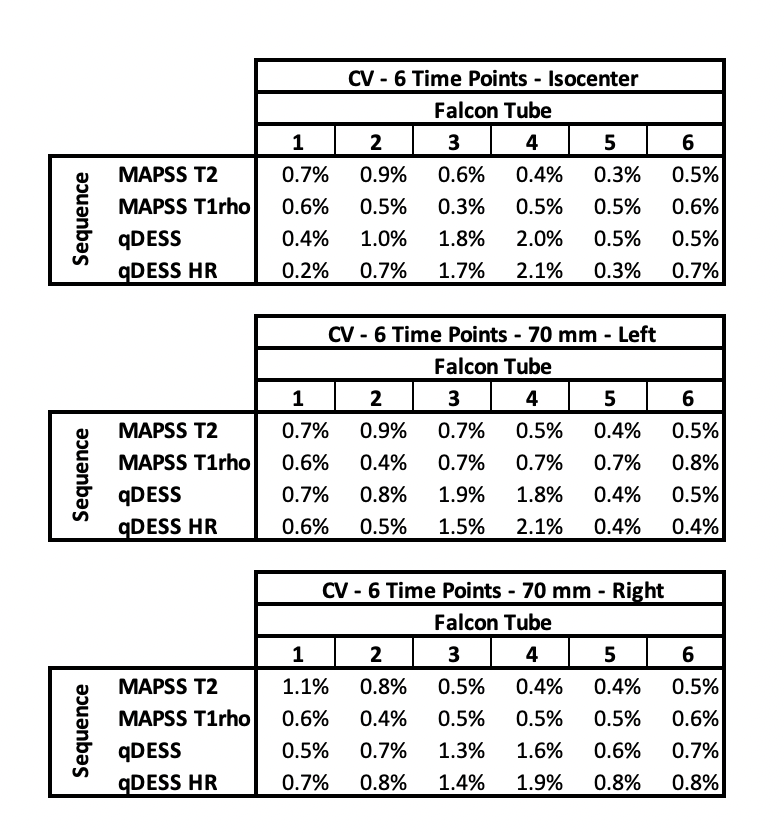
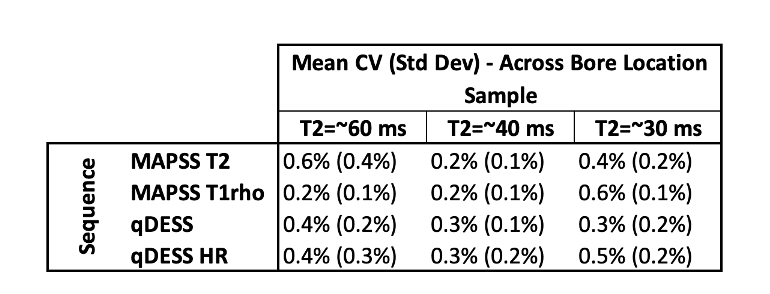
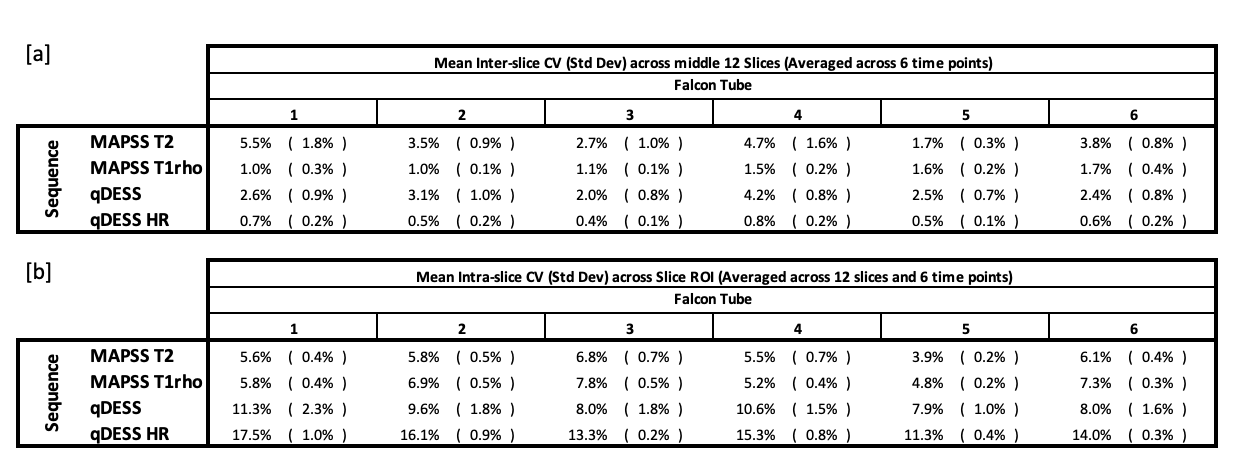
T2 and T1rho relaxation times were computed by fitting the acquired MAPSS data to a monoexponential decay. An extended phase graph model was used to compute T2 relaxation times from the ratiometric difference in signal values from the two acquired qDESS echos. From the computed pixelwise T2 and T1rho relaxation time maps, a circular ROI was drawn that encompassed ~90% of each tube across all slices. From this data, the mean and standard deviation was computed for each slice. The mean sample relaxation time was then calculated as the mean T2/T1rho relaxation time of the central 12 acquired slices. Coefficients of variation (CV) were calculated for the following: (1) CV for each position (isocenter (iso), right (R), and left (L)) for each tube across the 6 time points; (2) CV between position (iso/L/R), which was then averaged across the 6 time points; (3) CV of mean T2/T1rho values across the 12 measured slices averaged across the 6 time points (Inter-slice Variance); and (4) CV of T2/T1rho values within a slice ROI, averaged across 12 measured slices and 6 time points.
Results
The phantom data shows high repeatability in all tested sequences across both time and position. Across the 6 measured timepoints, the average CVs for all samples were <2.1%. CV was similar between measures at isocenter and when the phantom was scanned at 7cm left and right of isocenter (Figure 3). Further, the mean CV of T2/T1rho measures between the three positions was <1.0% for all samples (Figure 4). Larger variations were seen within each timepoint. Mean inter-slice CVs across the middle 12 slices (averaged across 6 time points) were <5.5% for sequences tested (Figure 5a). Lastly, mean CVs of relaxation time values within a slice ROI (averaged across 12 slices and 6 time points) for all sequences were <17.5% (Figure 5b).Discussion
The observed CVs demonstrate the ability to obtain highly repeatable T2 and T1rho relaxation times, in stable phantoms, across time. Further, our results demonstrate that shifting the phantom scan location 7cm in either direction did not affect repeatability nor the measured quantitative values. Of note, the CV of quantitative values were larger than the CV of mean T2 values across slices over time. As we aimed to position the phantom (and slices prescriptions) consistently at all time points, this may be due to either variations across slices or more likely B1 field differences between slices (varying along the main magnetic field). This can also explain the improved interslice CV in the higher resolution qDESS, which due to its decreased slice thickness, covers less FOV in the z-direction. CV of T2/T1rho values within each slice ROI was higher than CV of mean T2 values across slices or time points but did not seem to affect the overall CV measurements. This was surprising and warrants further follow-up. Of note, this study used a 3T system with large gradient strength as well as a high channel count phased array coil which resulted in high image SNR. Image quality plays a key role in repeatability measures and will vary across systems and coils. Thus, it is key to understand repeatability of measures at every scanner.Conclusion
Our results showed repeatability of 4 quantitative MRI approaches that were well within the QIBA benchmark for phantom scans of 4-5%. Further, our data suggests that phantom positioning within the scanner bore did not affect repeatability or quantitative values.Acknowledgements
This work was supported by GE Healthcare and the QIBA MSK Initiative.References
1.Prasad, A. P., Nardo, L., Schooler, J., Joseph, G. B., & Link, T. M. (2013). T₁ρ and T₂ relaxation times predict progression of knee osteoarthritis. Osteoarthritis and cartilage, 21(1), 69–76. https://doi.org/10.1016/j.joca.2012.09.011
2.Liebl H, Joseph G, Nevitt MC, et al. Early T2 changes predict onset of radiographic knee osteoarthritis: data from the osteoarthritis initiative. Ann Rheum Dis. 2015;74(7):1353–LP-1359. http://dx.doi.org/10.1136/annrheumdis-2013-204157.
3.Baum T, Joseph GB, Karampinos DC, Jungmann PM, Link TM, Bauer JS. Cartilage and meniscal T2 relaxation time as non-invasive biomarker for knee osteoarthritis and cartilage repair procedures. Osteoarthr Cartil. 2013;21(10):1474–84. https://doi.org/10.1016/J.JOCA.2013.07.012.
4.Kretzschmar, M., Nevitt, M. C., Schwaiger, B. J., Joseph, G. B., McCulloch, C. E., & Link, T. M. (2019). Spatial distribution and temporal progression of T2 relaxation time values in knee cartilage prior to the onset of cartilage lesions - data from the Osteoarthritis Initiative (OAI). Osteoarthritis and cartilage, 27(5), 737–745. https://doi.org/10.1016/j.joca.2018.10.016
5.Li, X., Benjamin Ma, C., Link, T. M., Castillo, D. D., Blumenkrantz, G., Lozano, J., Carballido-Gamio, J., Ries, M., & Majumdar, S. (2007). In vivo T(1rho) and T(2) mapping of articular cartilage in osteoarthritis of the knee using 3 T MRI. Osteoarthritis and cartilage, 15(7), 789–797. https://doi.org/10.1016/j.joca.2007.01.011
6.Li, X., Wyatt, C., Rivoire, J., Han, E., Chen, W., Schooler, J., Liang, F., Shet, K., Souza, R., & Majumdar, S. (2014). Simultaneous acquisition of T1ρ and T2 quantification in knee cartilage: repeatability and diurnal variation. Journal of magnetic resonance imaging : JMRI, 39(5), 1287–1293. https://doi.org/10.1002/jmri.24253
Figures