5099
Blood Oxygen Level-Dependent Imaging in Peripheral Artery Disease: Feasibility and Reproducibility of perfusion measurements
Xiaoxi Yu1, Zhaoxi Liu2, Jianxun Qu3, Fengdan Wang2, Zhichao Lai1, Xiaoyuan Fan2, Luming Ye4, Jiang Shao1, Yan Zhang2, Bao Liu1, Zhengyu Jin2, and Feng Feng2
1Vascular Surgery, Peking Union Medical College Hospital, Beijing, China, 2Radiology, Peking Union Medical College Hospital, Beijing, China, 3MR Collaboration, Siemens Healthineers Ltd., Beijing, China, 4Advanced Therapies Collaboration, Siemens Healthineers Ltd., Beijing, China
1Vascular Surgery, Peking Union Medical College Hospital, Beijing, China, 2Radiology, Peking Union Medical College Hospital, Beijing, China, 3MR Collaboration, Siemens Healthineers Ltd., Beijing, China, 4Advanced Therapies Collaboration, Siemens Healthineers Ltd., Beijing, China
Synopsis
Keywords: Quantitative Imaging, Perfusion
This study used blood oxygen level-dependent (BOLD) imaging to assess the hemodynamics of the lower limbs among elder controls and patients with peripheral artery disease (PAD). The BOLD-derived perfusion parameters, such as time to peak and gradient during reactive hyperemia, showed good reproducibility and significantly differed between patients and controls. The results indicated decreased vasodilatation ability and perfusion levels in patients with PAD. Therefore, BOLD imaging can be a feasible perfusion assessment method for long-term noninvasive PAD monitoring.Introduction
Peripheral artery disease (PAD) is a disease of progressive stenosis or occlusion of peripheral arteries caused by atherosclerosis, which reduces blood supply to the lower extremities and leads to limb-threatening complications[1]. The American Heart Association emphasized that there were still unmet perfusion assessment and imaging needs for PAD[2]. The clinical application of blood oxygen level-dependent (BOLD) imaging, a functional MRI to quantify perfusion, in ischemic muscles of lower limbs is limited[3]. Given the ischemia-reperfusion paradigm applied to provoke measurable BOLD signal changes, the reproducibility of perfusion assessment is as necessary as the feasibility to demonstrate. Still, few studies have proven both. Therefore, this study aimed to verify the reproducibility and feasibility of perfusion measurement by BOLD imaging to differentiate patients with PAD from elder controls.Methods
Seventeen patients with PAD (67 ± 6 years, 15 males) and eight elder controls (61 ± 5 years, 6 males) were recruited for this study. Participants underwent BOLD imaging following the ischemia-reperfusion paradigm (Figure 1). The process was repeated twice among elder controls, five minutes apart, to verify the interscan reproducibility. The BOLD imaging was performed on a 3T scanner (MAGNETOM Vida, Siemens Healthcare, Erlangen, Germany) equipped with an 18-channel UltraFlex Large coil. BOLD imaging was acquired with a single slice multi-echo gradient echo sequence, sampled at 3.3 seconds per measurement, with TR 55ms, and nine echoes equally spaced from 4.0 to 40.0ms. The field of view was 16 x 15 cm2, and the Matrix size was 120 x 96. The BOLD T2* map of each measurement was fitted from the nine echoes and then non-rigidly registered to the first phase with the first echo of each measurement as the reference. Perfusion was analyzed in regions of interest (ROIs) according to muscle groups, which were hand-drawn on ITK-SNAP version 3.8.0 from the first echo BOLD image while avoiding major arteries.Data of T2* was plotted as the T2*-time curve, and the curve was normalized by the mean T2* of the resting phase. BOLD-derived perfusion parameters were calculated according to the obtained curve by two different users. The gradient (Grad) during reactive hyperemia was automatically calculated by taking the average slope over the 10 seconds of the highest slope. The intraclass correlation coefficient (ICC) was calculated using a two-way random model to determine reproducibility, where an ICC >0.75 was regarded as good agreement, and an ICC<0.5 was considered poor agreement. BOLD parameters were compared between patients with PAD and elder controls using the Mann-Whitney U test. Analysis of variance (ANOVA) with the Tukey post-hoc test was used to determine differences between muscle groups. Data were analyzed with SPSS version 25.0 (SPSS, Chicago, Illinois). Statistical significance was defined as p <0.05.
Results
Regarding interobserver reproducibility, all BOLD-derived perfusion parameters demonstrated an excellent level of agreement in both patients and controls (Table 1). The interscan reproducibility of minimum ischemia value (MIV), time to peak (TTP), and Grad were good (MIV ICC: 0.899; TTP ICC: 0.764; Grad ICC: 0.931), while the interscan reproducibility of the hyperemia peak value (HPV) was poor. When comparing perfusion parameters between patients and controls, we found T2* signal increased more rapidly in controls than in patients in the hyperemia phase (Table 2). TTP of patients was longer than that of controls (p<0.001), which was significant in all ROIs. The grad of patients was smaller than that of controls (p<0.001), and the differences were significant in the anterior compartment, lateral compartment, and soleus (Figure 2).Discussion
Our study confirmed good interscan reproducibility of MIV, TTP, and Grad, while the interscan reproducibility of HPV was poor, which yielded similar results to a previous study. The possible reason might be that HPV was smaller than other perfusion parameters and the proportion of random error was greater. Although interscan reproducibility was only investigated in controls, for the time being, it would be further explored in patients in subsequent studies. When comparing perfusion parameters between patients and controls, the mean values of TTP and Grad differed significantly between patients and controls and reflected decreased responses to vasodilation in patients consistently. Likewise, Bajwa A et al. found a significantly lower Grad in the ischemic limbs of patients with PAD than in age-matched controls, and the mean value of Grad in patients was 0.17±0.11ms/s[4], which was in good agreement with our results of 0.16±0.12ms/s.Conclusion
In conclusion, our study demonstrates that BOLD imaging can be applied as a reliable tool to quantify tissue perfusion in the lower extremities with good reproducibility and can distinguish patients with PAD from healthy controls, which is of great significance for evaluating the degree of ischemia in clinical practice.Acknowledgements
Not applicable.References
1. Criqui MH, Matsushita K, Aboyans V, et al. Lower Extremity Peripheral Artery Disease: Contemporary Epidemiology, Management Gaps, and Future Directions: A Scientific Statement From the American Heart Association. Circulation, 2021;144(9):e171-e191.2. Misra S, Shishehbor MH, Takahashi EA, et al. Perfusion Assessment in Critical Limb Ischemia: Principles for Understanding and the Development of Evidence and Evaluation of Devices: A Scientific Statement From the American Heart Association. Circulation, 2019;140(12):e657-e672.
3. Törngren K, Eriksson S, Arvidsson J, et al. A Reperfusion BOLD-MRI Tissue Perfusion Protocol Reliably Differentiate Patients with Peripheral Arterial Occlusive Disease from Healthy Controls. J Clin Med, 2021;10(16).
4. Bajwa A, Wesolowski R, Patel A, et al. Blood Oxygenation Level-Dependent CMR-Derived Measures in Critical Limb Ischemia and Changes With Revascularization. J Am Coll Cardiol, 2016;67(4):420-431.
Figures
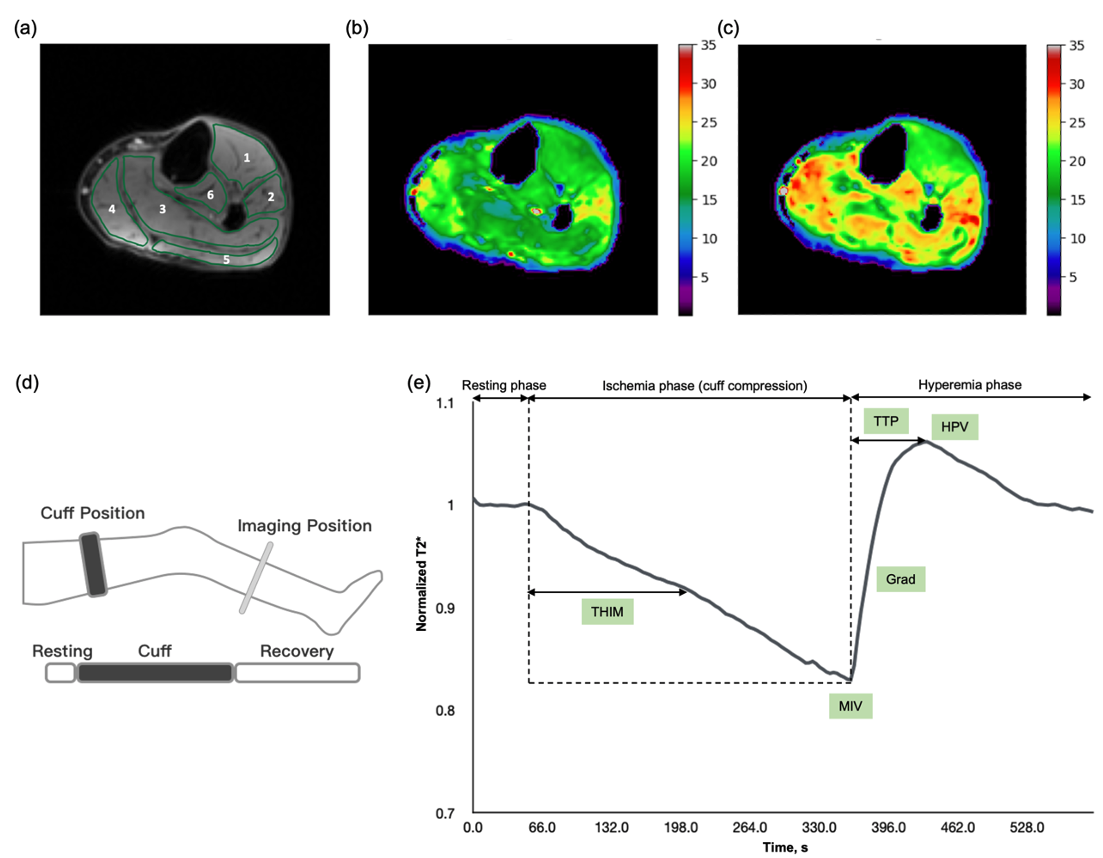
Figure 1. Perfusion images and curve of blood oxygen level-dependent (BOLD) imaging.
The reactive hyperemia experiment (d) comprised resting, cuff-induced ischemic, and recovery phases. Regions of interest (a) were based on muscle groups. T2* perfusion maps are shown at the ischemic (b) and hyperemic phase (c). BOLD-derived perfusion parameters (e) were measured in the normalized T2*-time curve.
Grad, gradient during reactive hyperemia; HPV, hyperemia peak value; MIV, minimum ischemia value; THIM, time to half ischemia minimum; TTP, time to peak
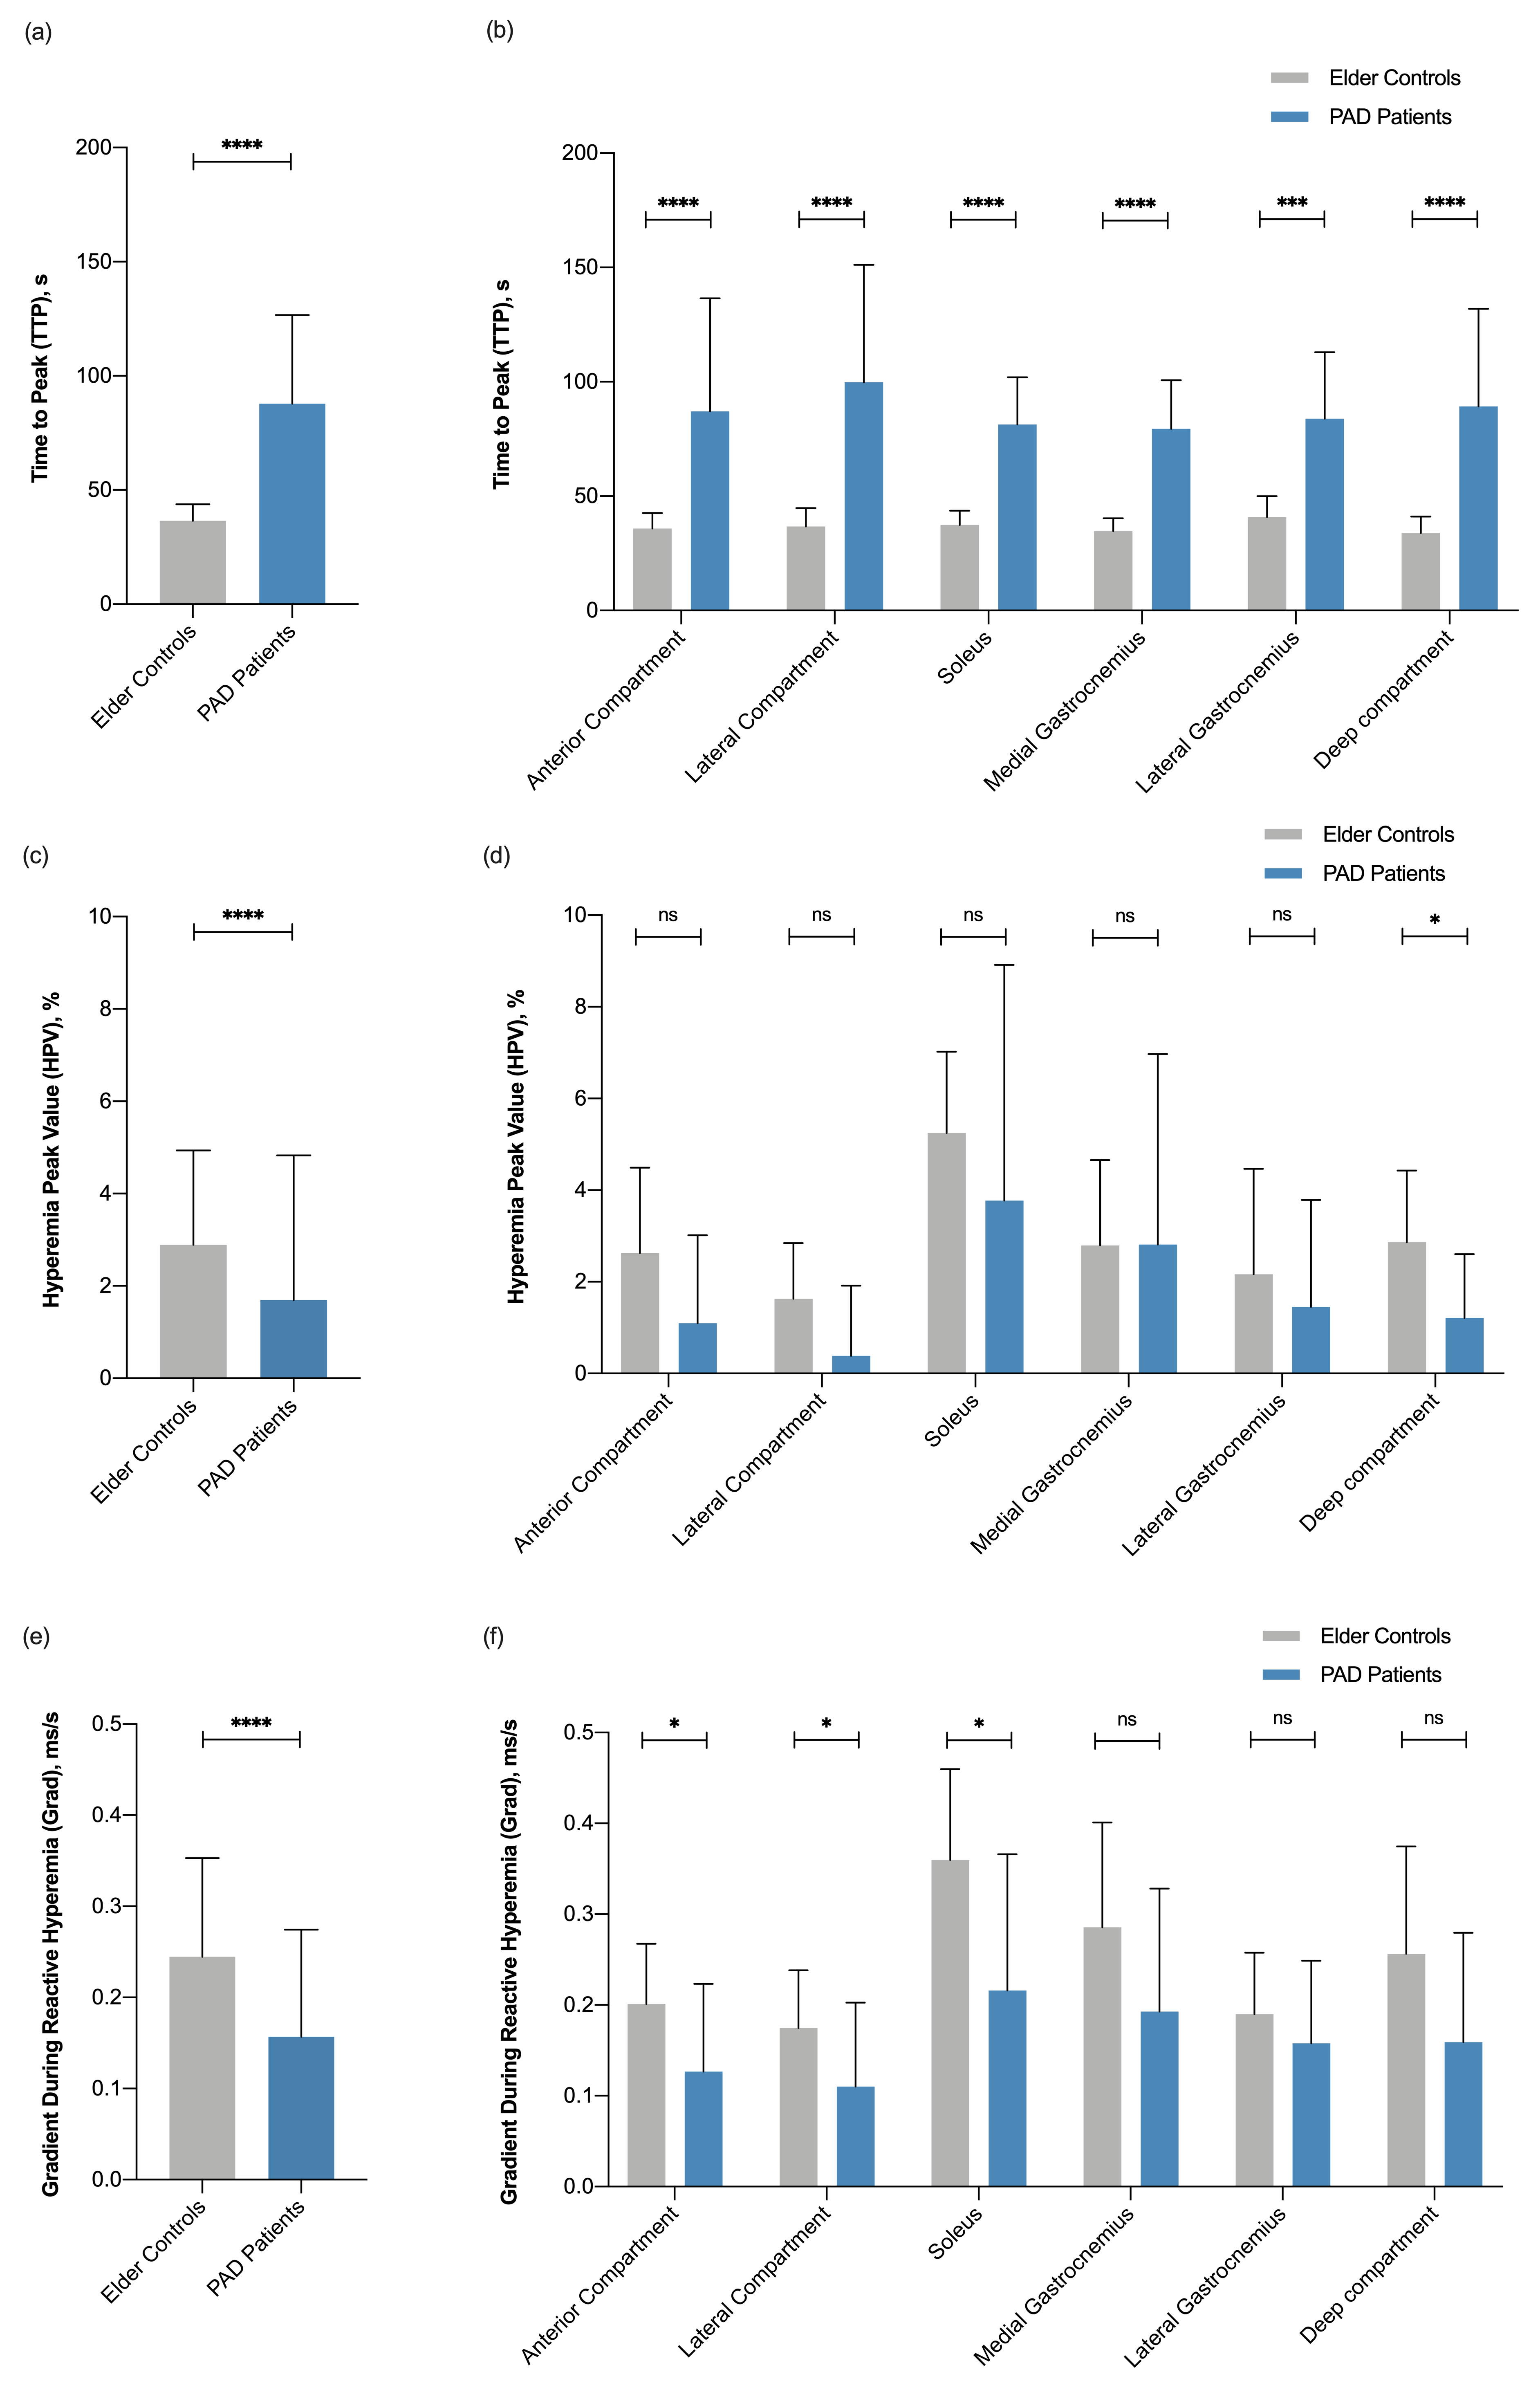
Figure 2. BOLD-derived perfusion parameters of patients with peripheral artery disease (PAD) and controls in different ROIs.
The perfusion parameters in ROIs and the mean value of parameters were compared between PAD patients and controls. The time to peak (TTP) of patients was longer than that of controls, which was significant in all ROIs (a)-(b). Hyperemia peak value (HPV) and gradient (Grad) during hyperemia of patients were smaller than those of controls, and the differences were significant in certain muscle groups (c)-(e). * p<0.05, ** p<0.01, *** p<0.001, and **** p<0.0001.
The perfusion parameters in ROIs and the mean value of parameters were compared between PAD patients and controls. The time to peak (TTP) of patients was longer than that of controls, which was significant in all ROIs (a)-(b). Hyperemia peak value (HPV) and gradient (Grad) during hyperemia of patients were smaller than those of controls, and the differences were significant in certain muscle groups (c)-(e). * p<0.05, ** p<0.01, *** p<0.001, and **** p<0.0001.
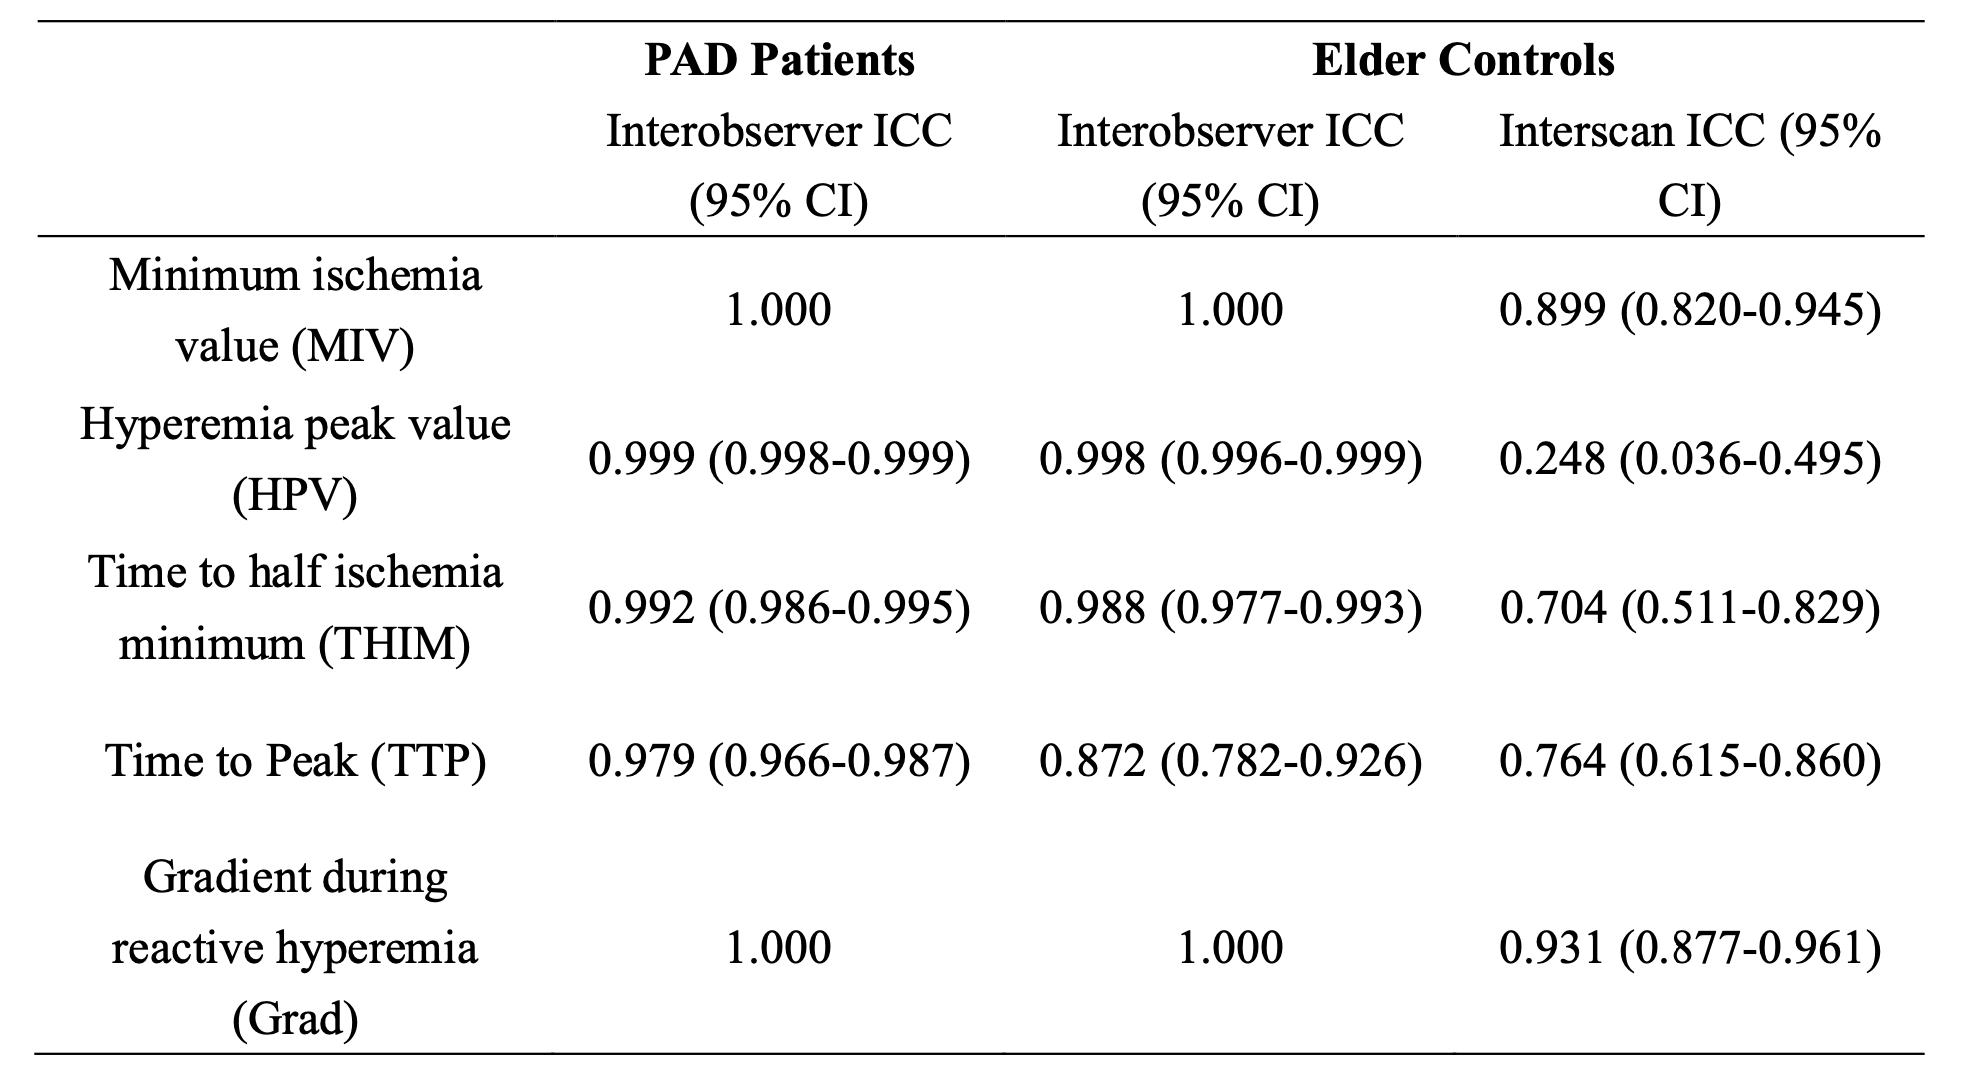
Table 1. Reproducibility of BOLD imaging.
BOLD, blood oxygen level-dependent; CI, confidence interval; ICC, interclass correlation coefficient; PAD, peripheral artery disease.
ICC>0.75 is regarded as a good agreement, and ICC<0.5 is viewed as a poor agreement.
BOLD, blood oxygen level-dependent; CI, confidence interval; ICC, interclass correlation coefficient; PAD, peripheral artery disease.
ICC>0.75 is regarded as a good agreement, and ICC<0.5 is viewed as a poor agreement.
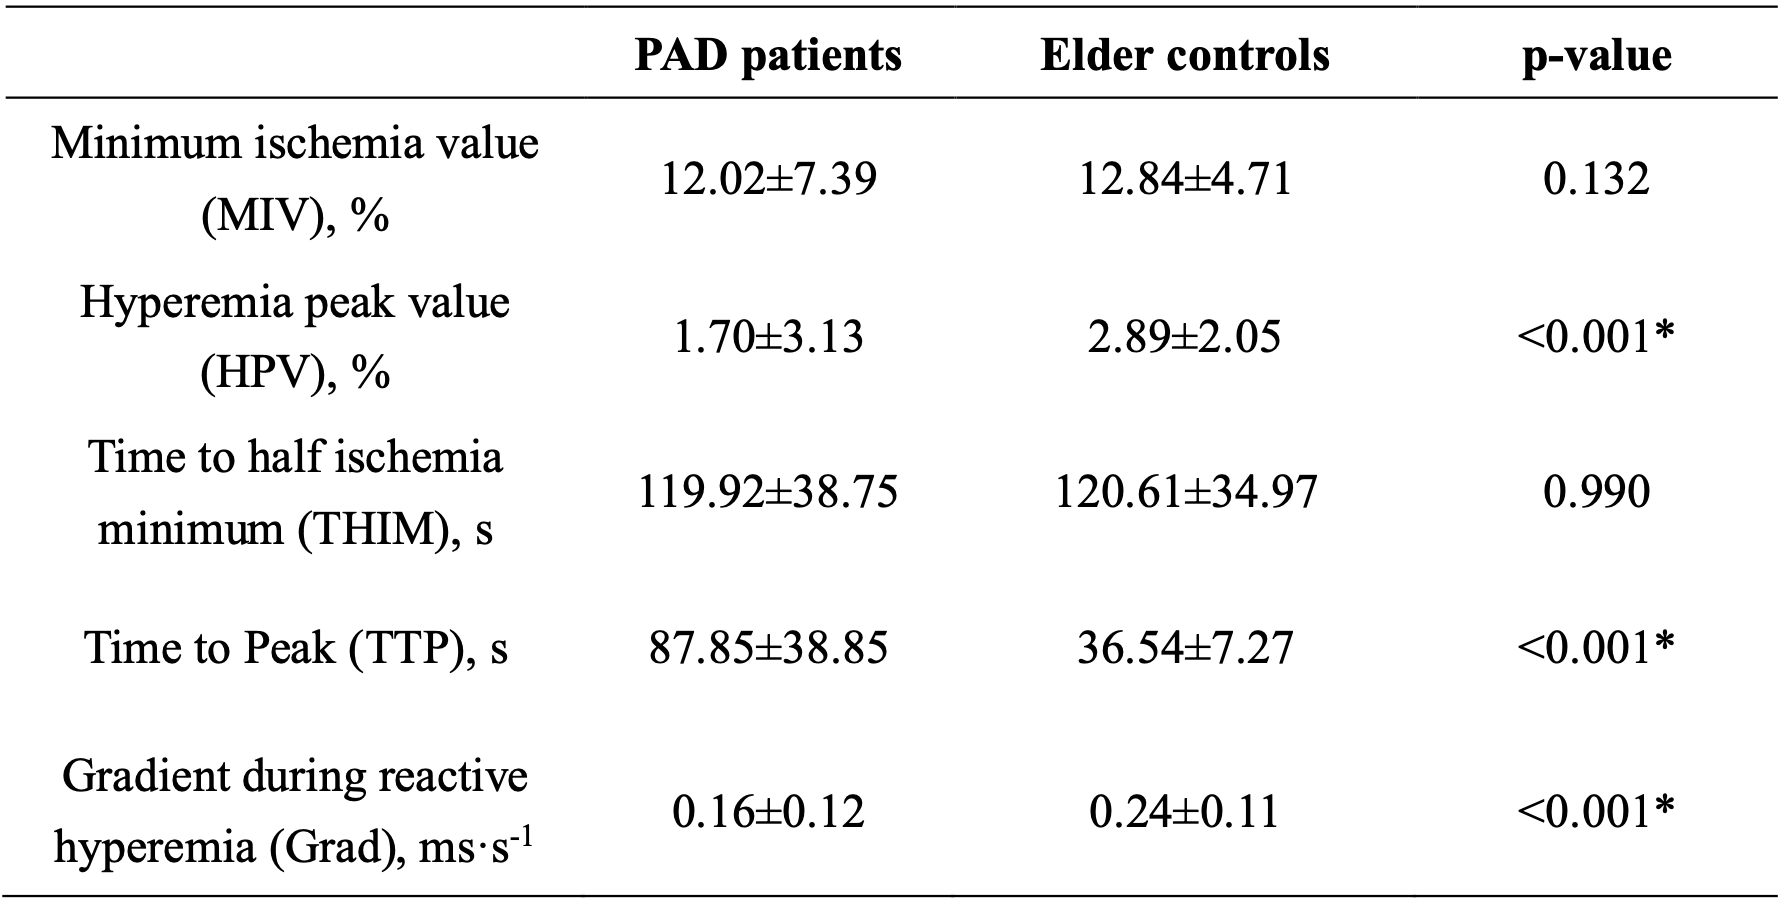
Table 2. BOLD-derived perfusion parameters of patients with PAD and elder controls.
Values are mean ± SD.
BOLD, blood oxygen level-dependent; PAD, peripheral artery disease.
Values are mean ± SD.
BOLD, blood oxygen level-dependent; PAD, peripheral artery disease.
DOI: https://doi.org/10.58530/2023/5099