5098
T1 and T2 measurement variability across commercial and prototype 0.55T systems1NIST, Boulder, CO, United States, 2Ming Hsieh Department of Electrical and Computer Engineering, University of Southern California, Los Angeles, CA, United States, 3Cardiovascular Branch, Division of Intramural Research, National Heart, Lung, and Blood Institute, National Institutes of Health, Bethesda, MD, United States, 4Department of Radiology, University of Michigan, Ann Arbor, MI, United States
Synopsis
Keywords: Quantitative Imaging, Relaxometry
We compare T1 and T2 measurements between the Free.Max and ramped-down Aera using the ISMRM/NIST system phantom at multiple sites. All 0.55T systems had comparable, to each other, measurements of T1 and T2 on both the NiCl2 and MnCl2 arrays. The T1 measurement of the NiCl2 array by VFA-GRE with B1+correction was overestimated compared to the site-reference by 1% to 92%. The rest of the measurements – MnCl2 T1, NiCl2 T2, and MnCl2 T2 – were within +/-20% of the site-reference and NMR-reference values. As adoption of 0.55T platforms increases, it is important to characterize and compare systems across sites.Introduction
Commercial diagnostic MRI systems are now available at field strengths below conventional field strengths (1.5T, 3T). In particular, the Free.Max system operating at 0.55T is FDA-approved for clinical use and is being deployed for routine scanning in Radiology departments in several countries. To test the feasibility of such a system before moving to the manufacturing stage, the commercial Free.Max system was preceded by ramped-down Aera prototype systems. The ramped-down Aera systems use higher-performance gradients, different coils, and have different bore geometry compared to the Free.Max design. In theory, measurements of quantitative values including T1 and T2 relaxation times made on ramped-down Aera systems should be the same as measurements from the Free.Max; however, given the differences between these two systems, it is important to compare measurements made on these systems. In this study, we compare T1 and T2 measurements between the Free.Max and ramped-down Aera using the ISMRM/NIST system phantom at multiple sites.Methods
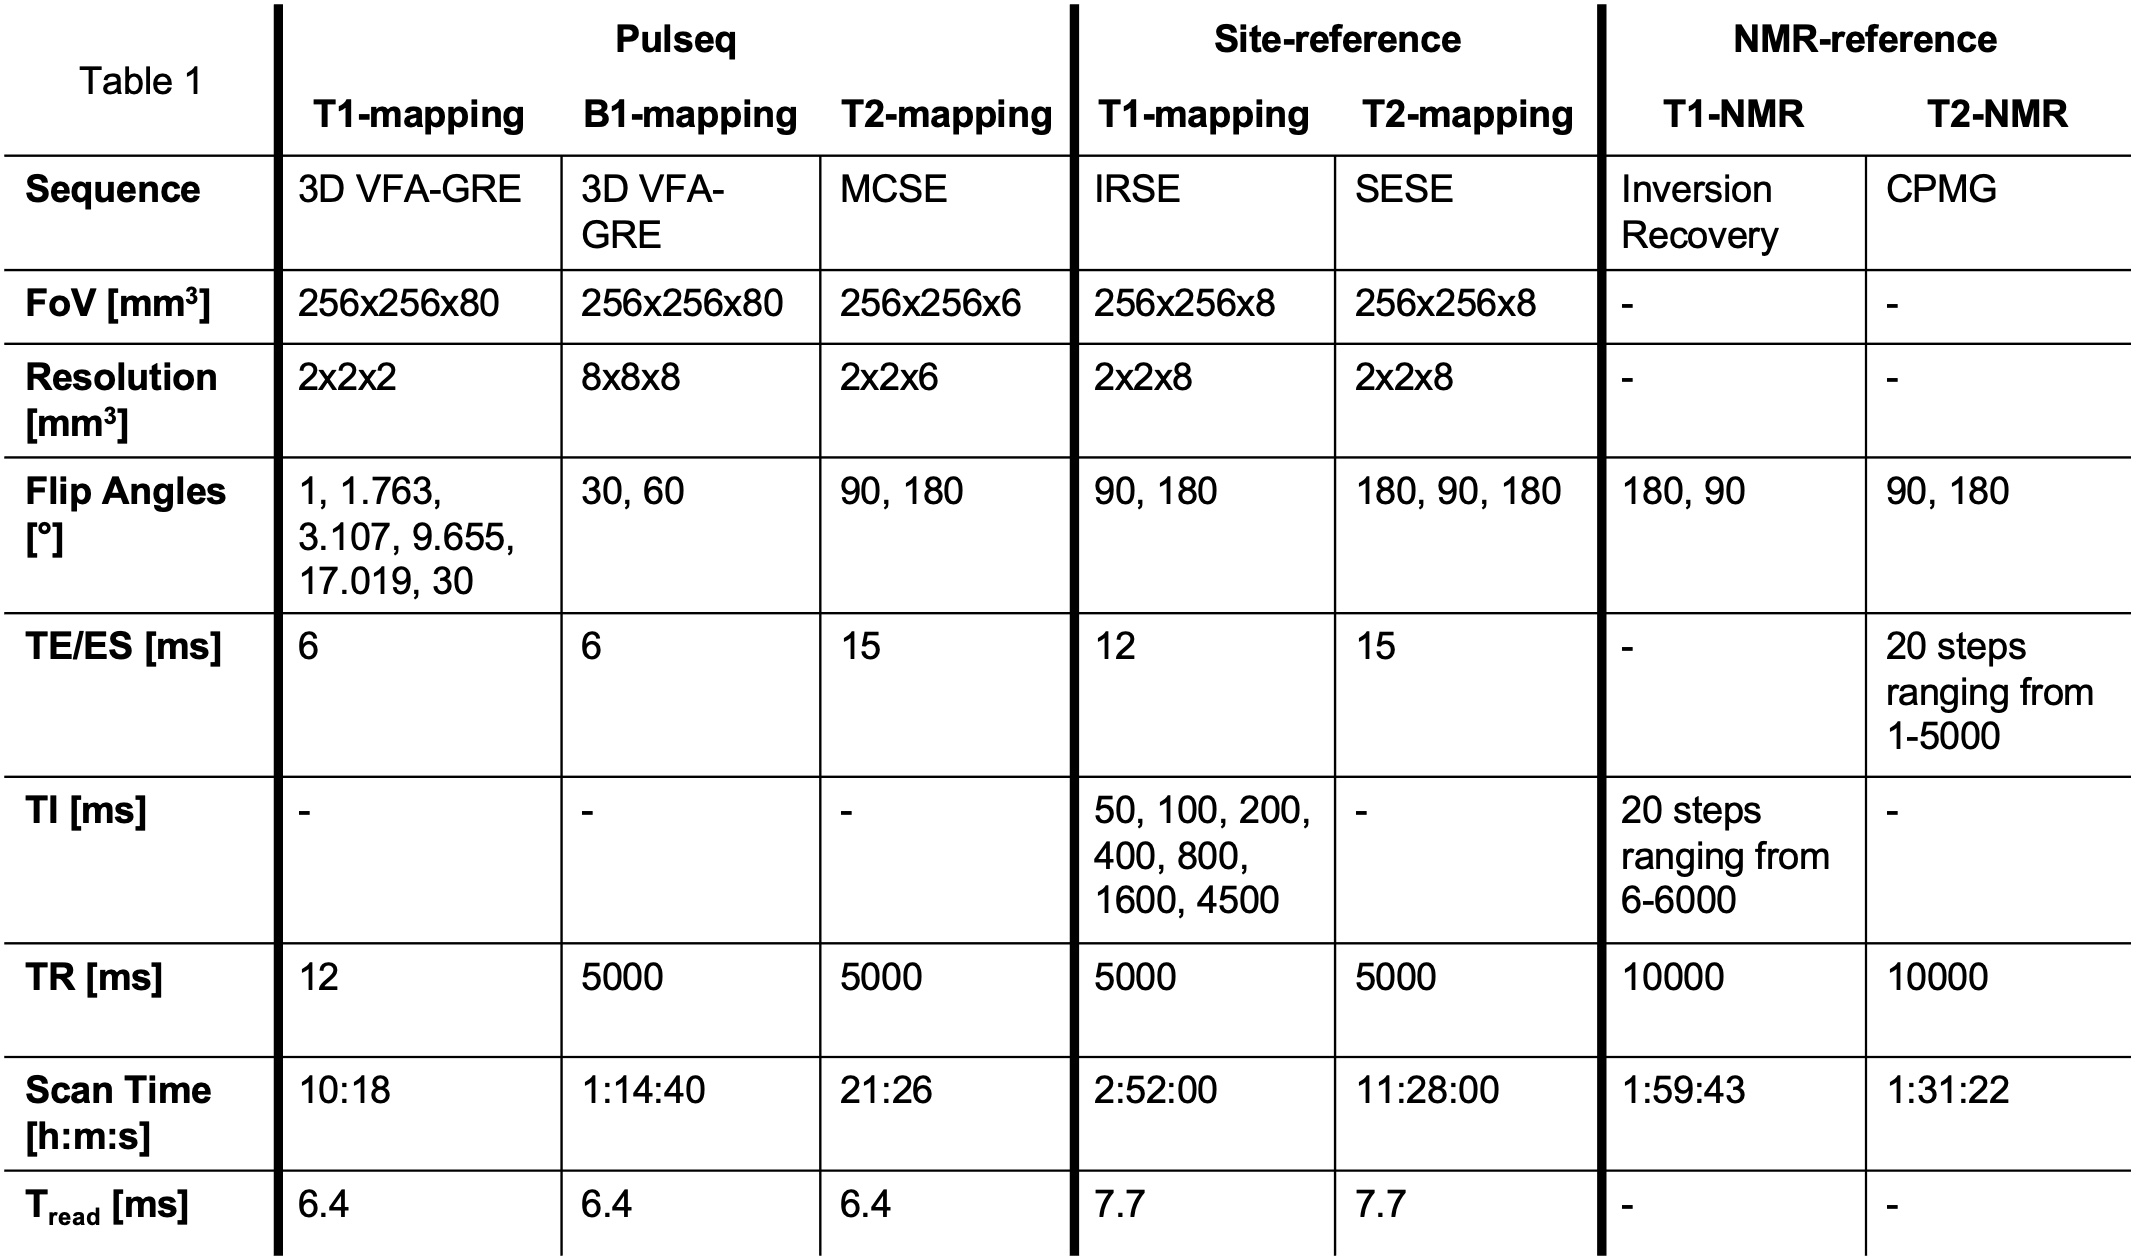
Measurements were made using the ISMRM/NIST system phantom on two ramped-down 0.55T systems (prototype MAGNETOM Aera XQ, software VE11S, Siemens, Erlangen, Germany) and two commercial 0.55T systems (MAGNETOM Free.Max, software XA50, Siemens, Erlangen, Germany). For this preliminary work, each site used its own ISMRM/NIST system phantom: Free.Max-A and ramped-down Aera-1 used phantom SN130-0134 from the NIBIB/NIST lending library1; the Free.Max-B system used phantom SN129-0005; and ramped-down Aera-2 used phantom SN130-0144. All phantoms use the same batch of NiCl2 and MnCl2 solutions.T1 and T2 measurements in both the NiCl2 and MnCl2 arrays were made using both a site-reference protocol and a system-agnostic protocol implemented using Pulseq2. Sequence details are provided in Table 1. The site-reference protocol used product inversion-recovery spin-echo (IRSE) and product single-echo spin-echo (SESE) sequences. For the Pulseq protocol, a 3D Variable Flip Angle Gradient Echo (VFA-GRE) sequence was used for T1-mapping, and measurements were made of MnCl2 and NiCl2 arrays simultaneously. The same VFA-GRE sequence with 30° and 60° FAs was used for double-angle B1-mapping (DAM). A 2D Multi-Contrast Spin-Echo (MCSE) sequence was implemented in Pulseq for T2-mapping. Two slices were acquired to cover both the MnCl2 and NiCl2 arrays.
The acquired images were reconstructed using qMRLab and StimFit (open-source frameworks available for Matlab). Raw data from the scanner were exported to ISMRMRD3. Following FFT reconstruction, sphere masks were created4. Open-source qMRLab5 was used on the masked images for the IRSE, SESE, and VFA-GRE fits. MCSE T2-maps were estimated using the StimFit6 package which accounts for stimulated echoes. The reconstruction code is available: https://github.com/usc-mrel/PulseqT1T2mappingRecon.
Measurements were made on five witness samples from each of the NiCl2 and MnCl2 arrays (same batch of NiCl2, MnCl2 solutions). These NMR-reference measurements were acquired at 0.55T using a variable field NMR system (Tecmag Redstone console, TNMR software), and a custom RF probe that allowed sample temperature control at multiple temperatures. T1 was measured using inversion recovery protocols with composite 180-degree pulses; T2 was measured using a Carr-Purcell-Meiboom-Gill (CPMG) pulse sequence.
Comparisons were made via percent bias (%-bias) between 1) the Pulseq and site-reference maps and 2) the Pulseq maps and 23oC NMR-reference data for each system.
Results and Discussion
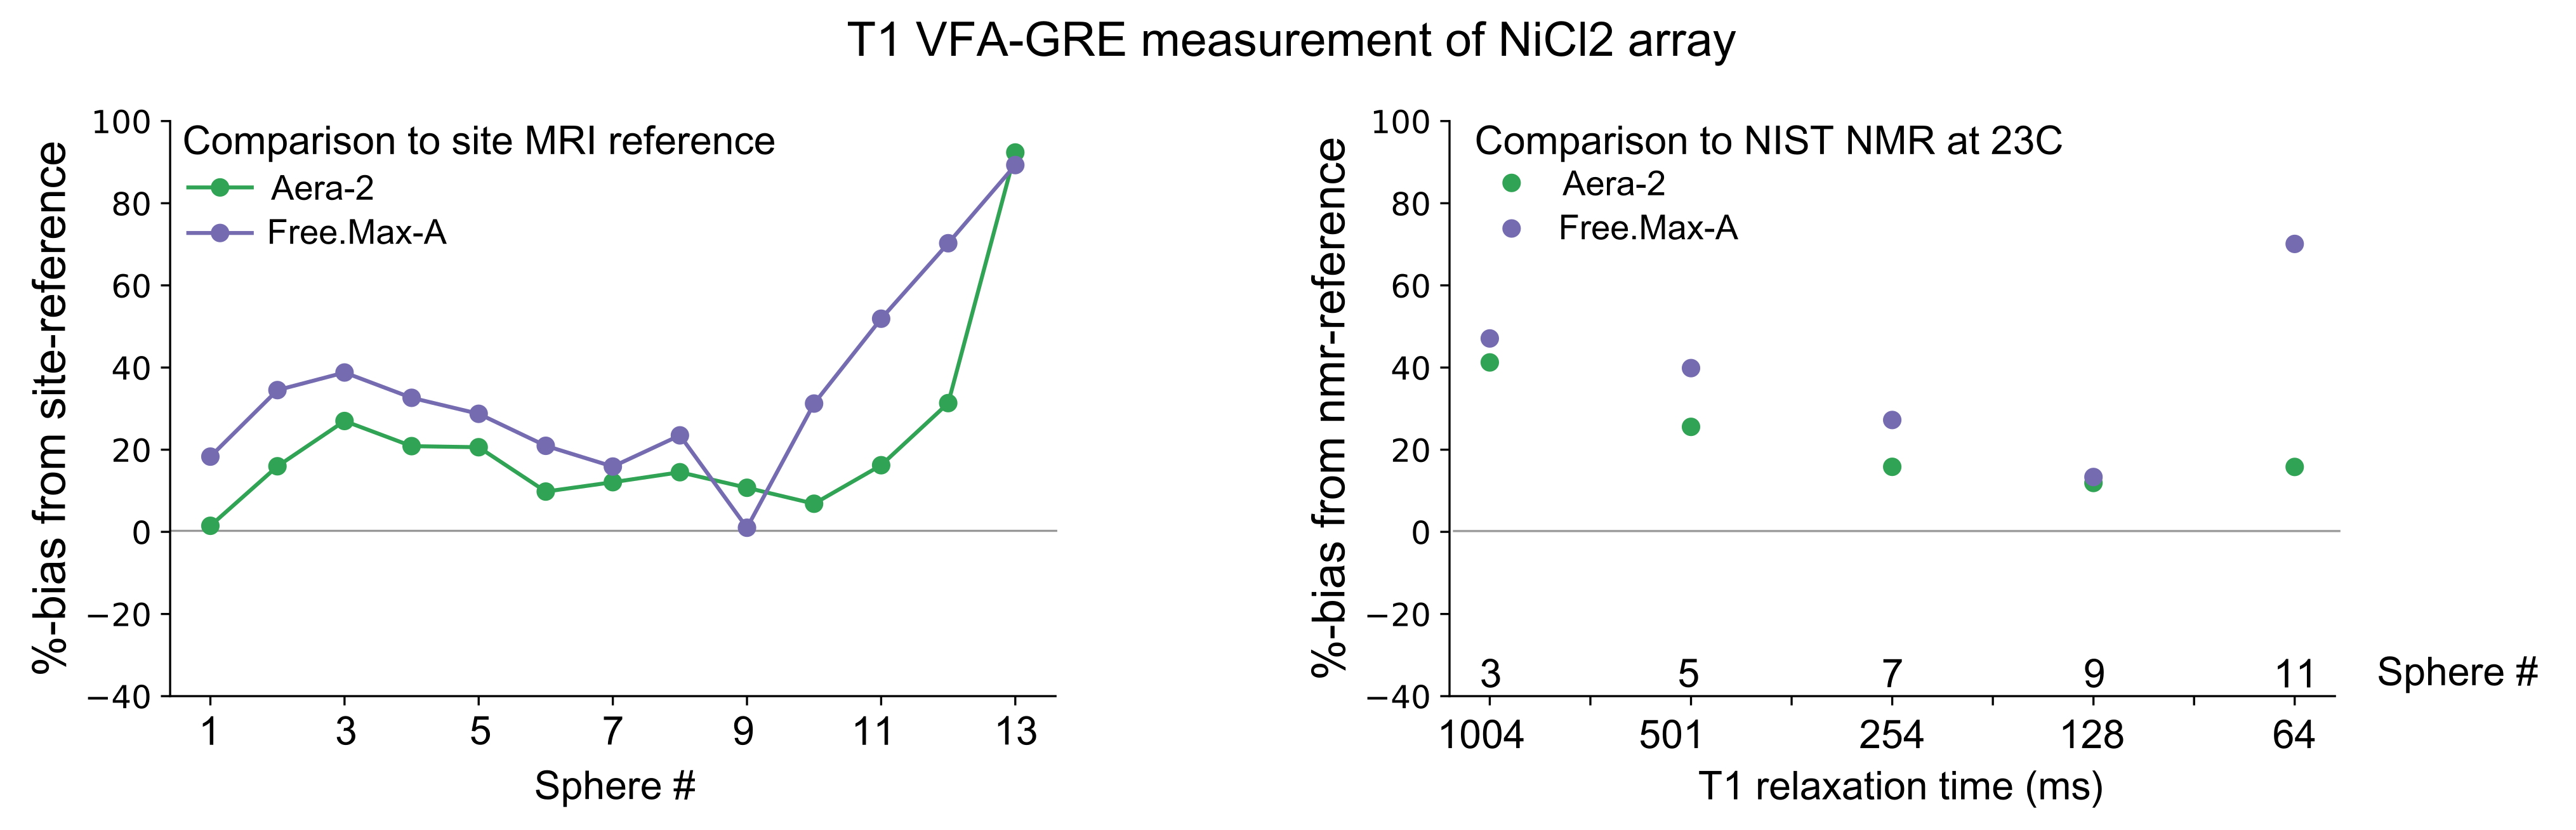
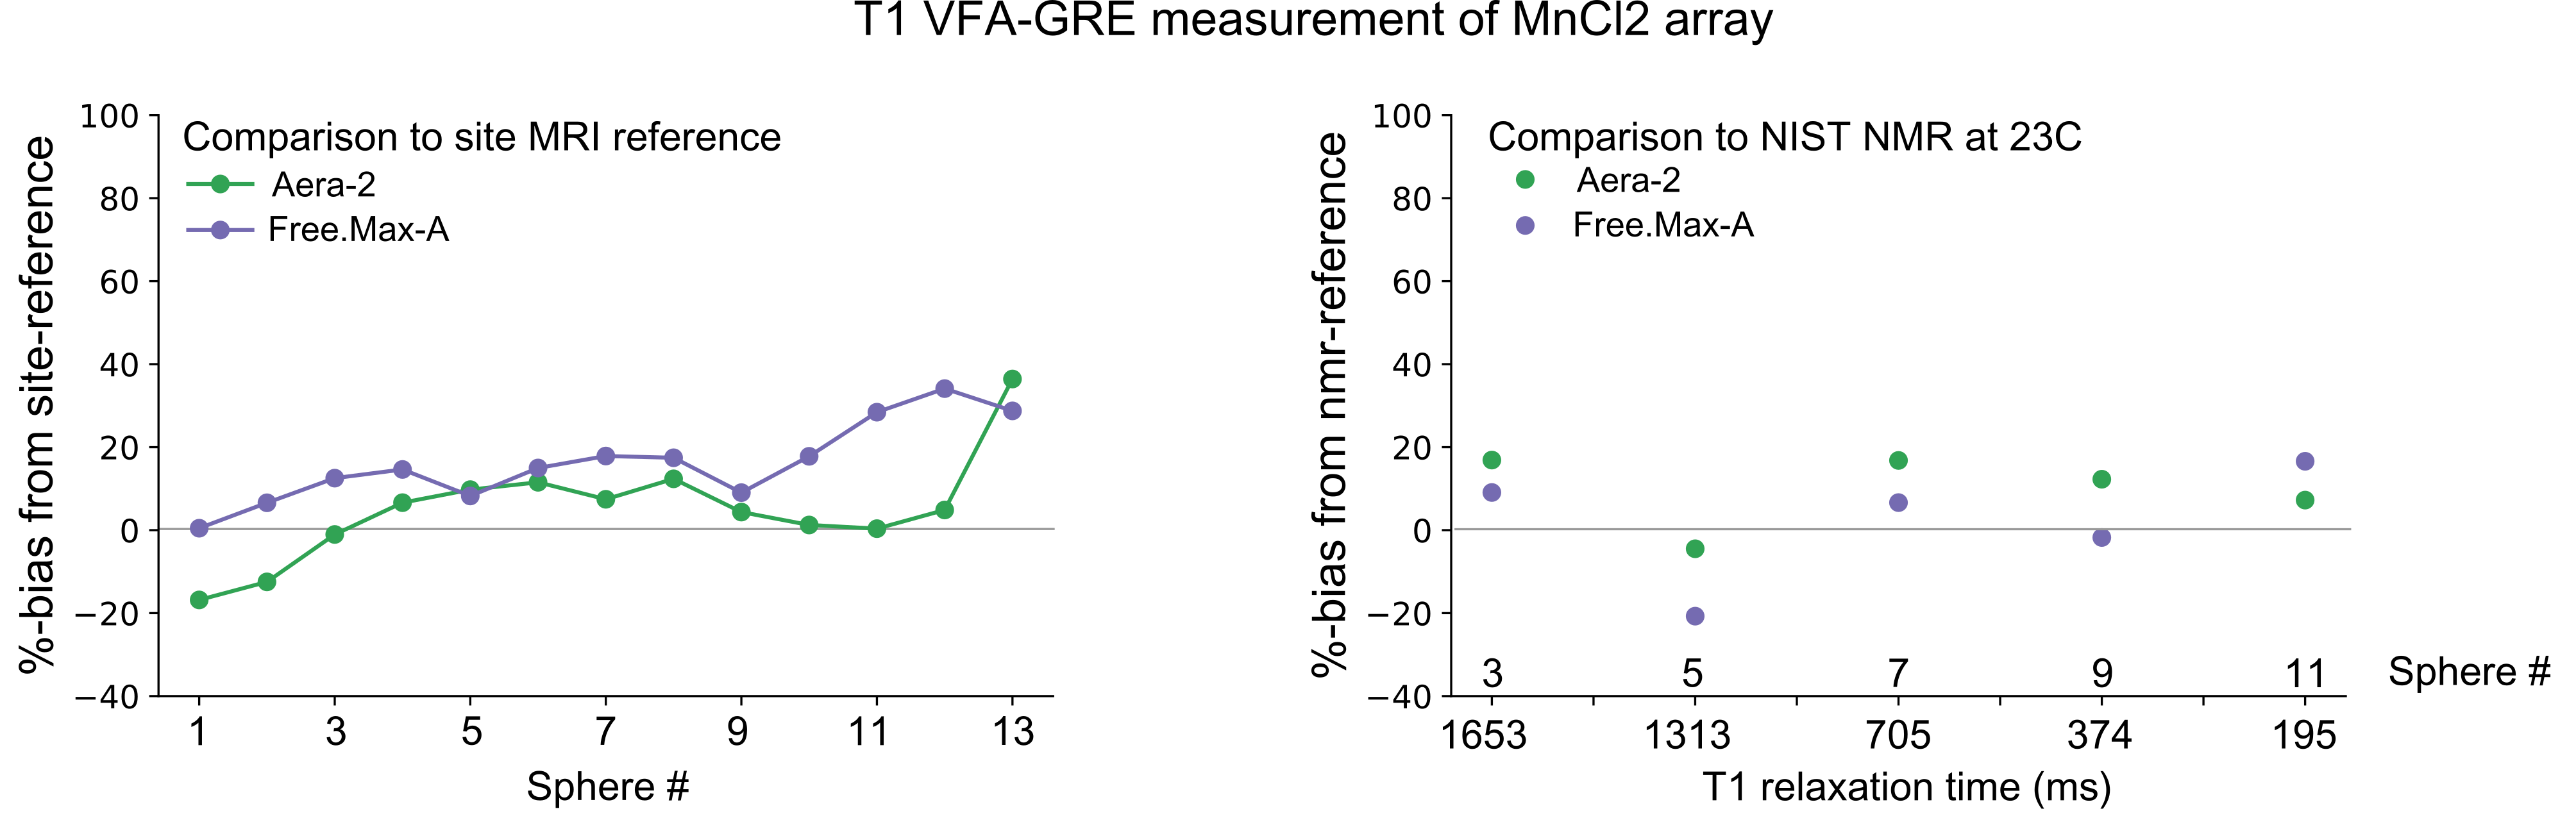
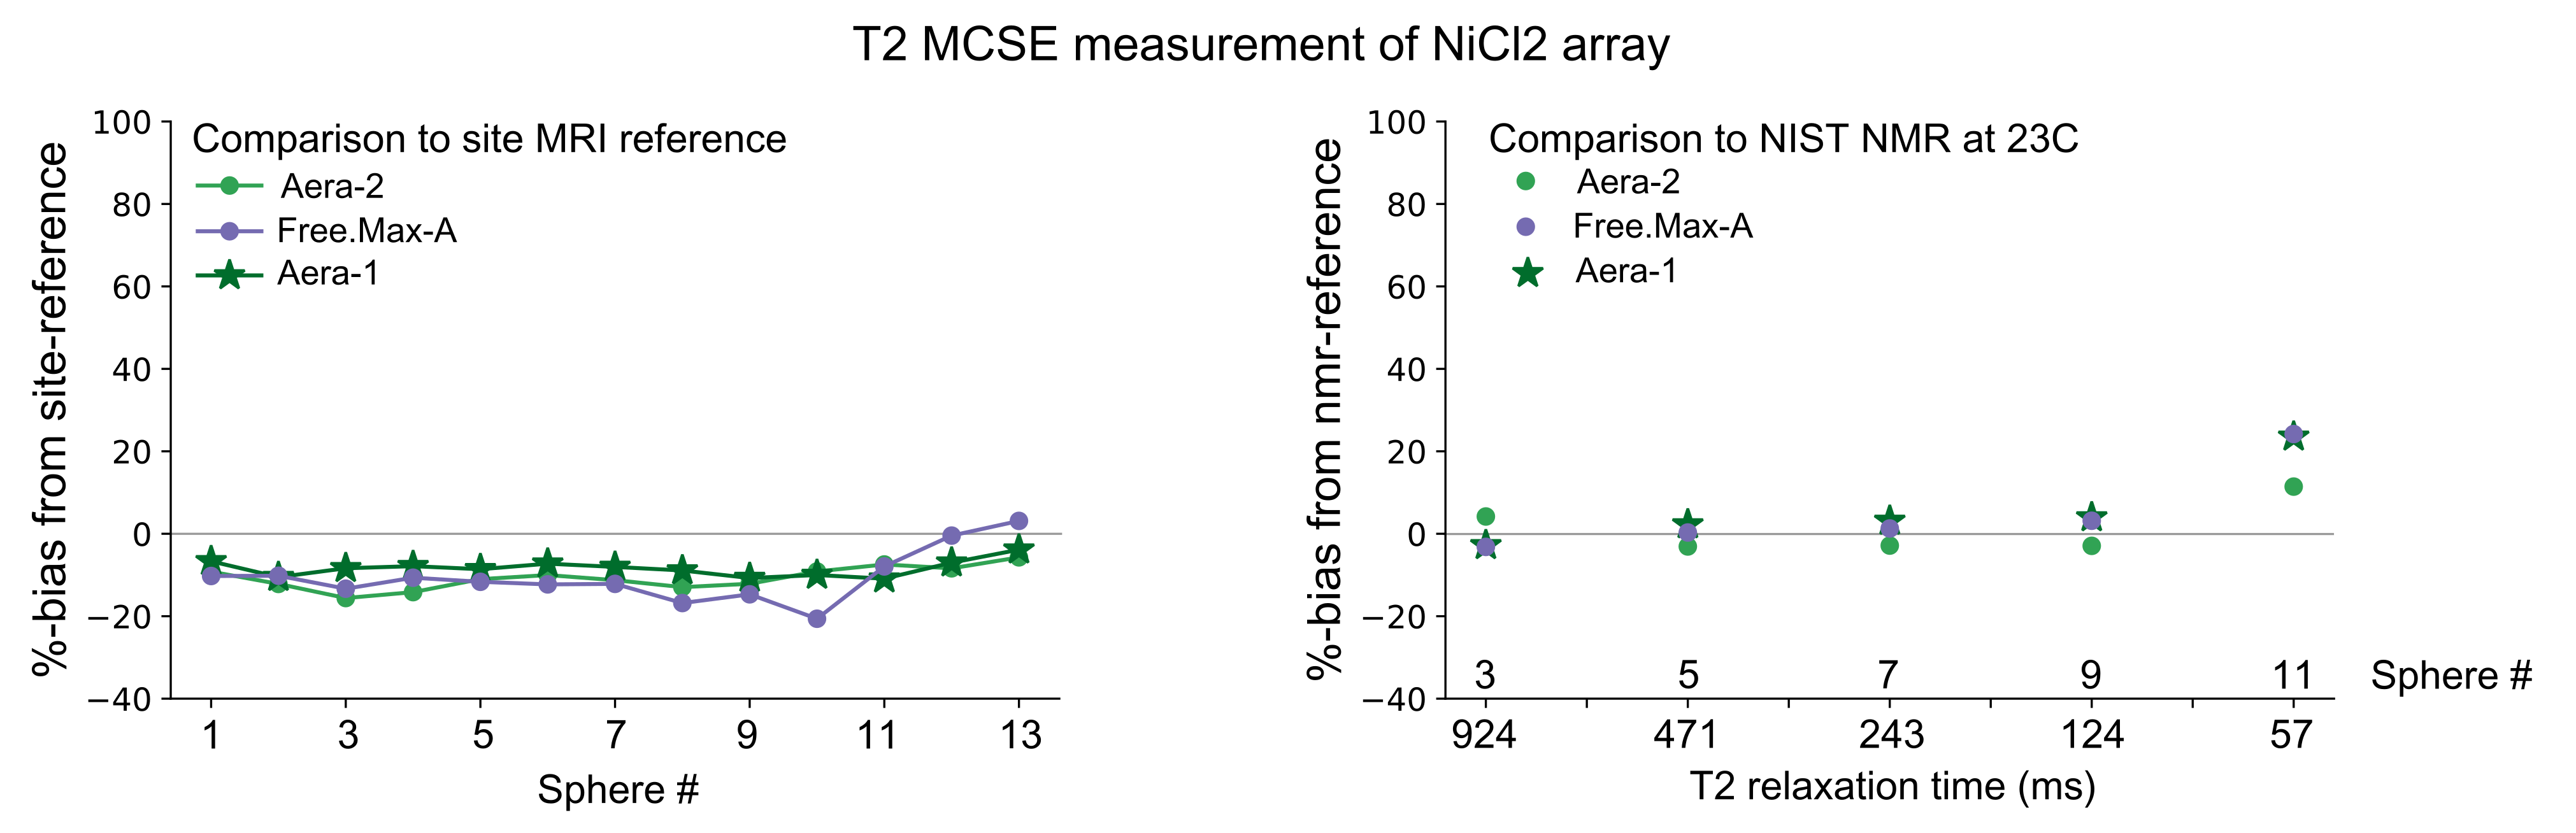
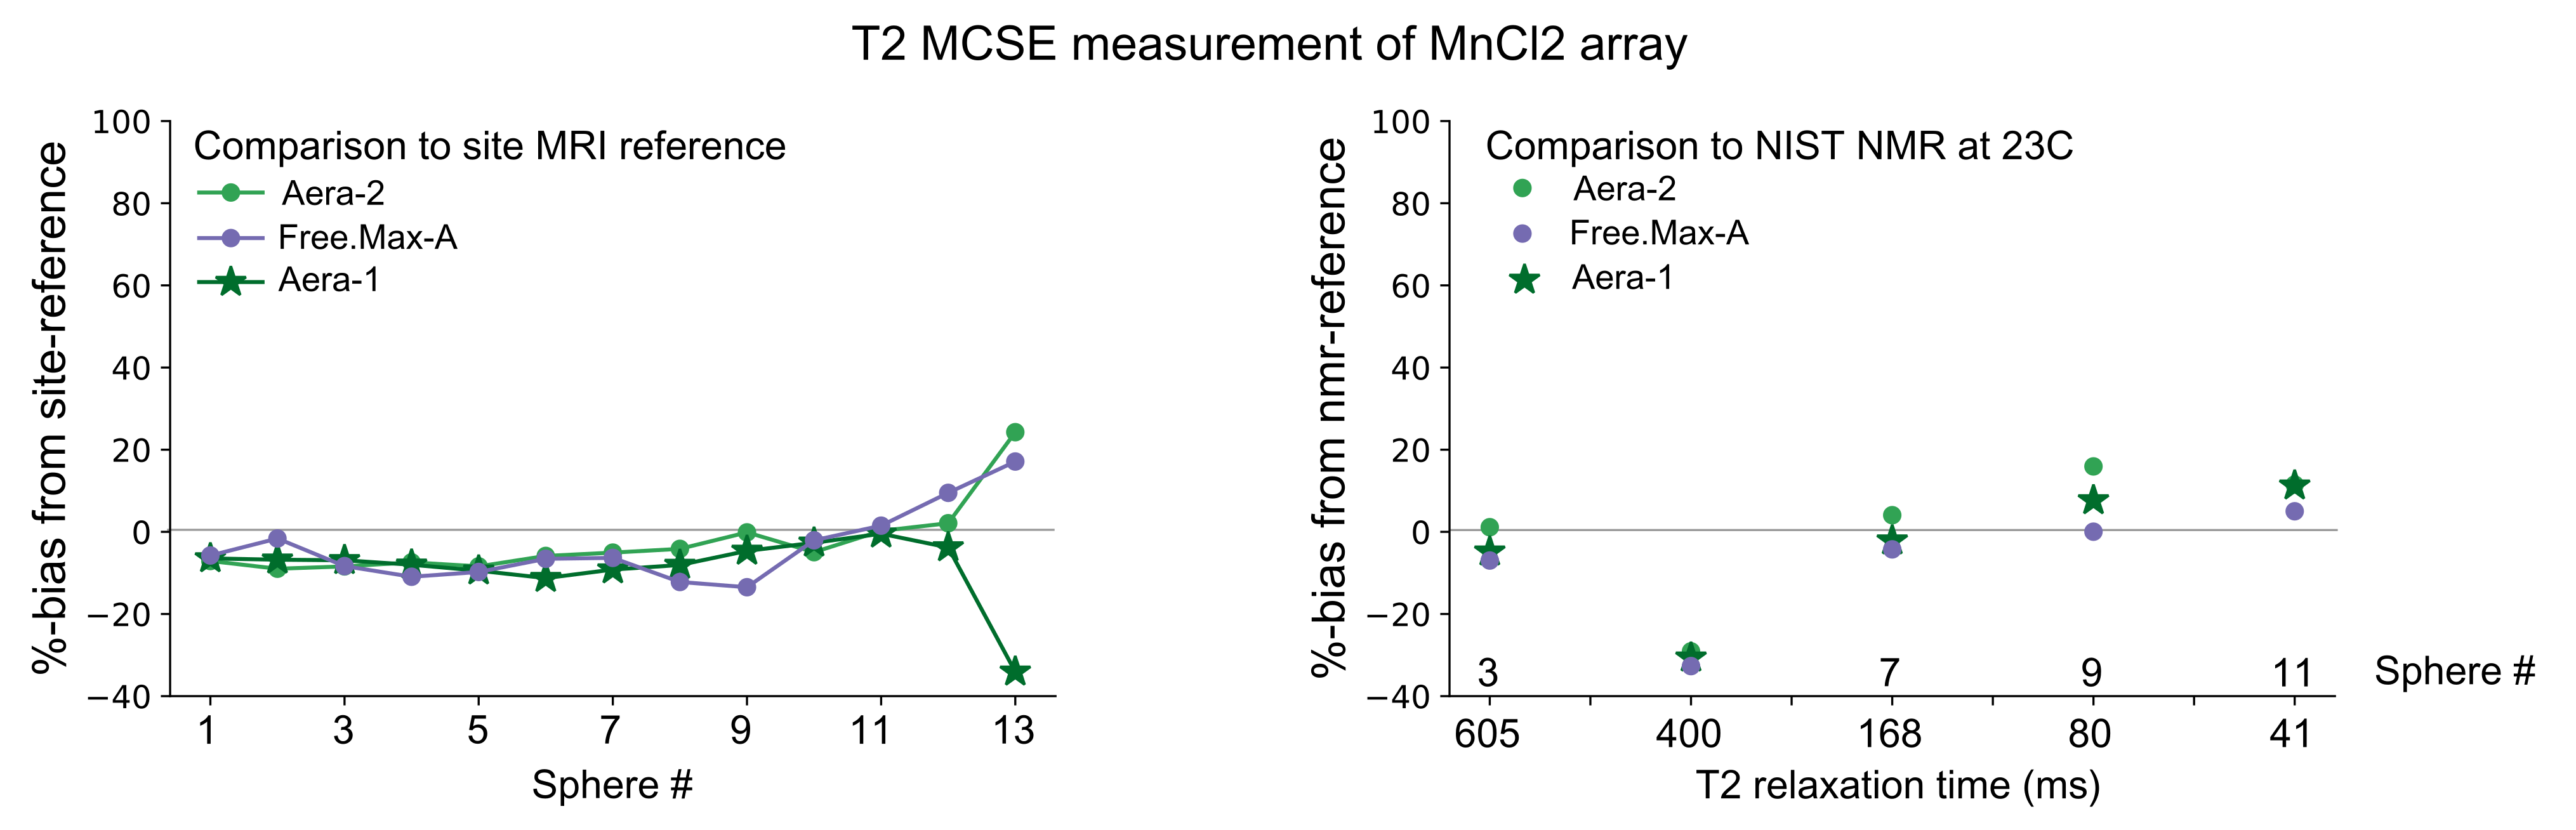
Plots of %-bias are shown for the T1 measurement of the NiCl2 array (Figure 1), T1 of the MnCl2 array (Figure 2), T2 of the NiCl2 array (Figure 3), and T2 of the MnCl2 array (Figure 4). In this preliminary report, complete data sets are included from two sites and a partial data set was available from one site. The faster Pulseq VFA-GRE implementation led to overestimation of T1 compared to the site-reference measurement for NiCl2 and most MnCl2 vials (Figures 1&2). For both the NiCl2 and MnCl2 vials, the faster Pulseq MCSE sequence underestimated T2 for vials 1 through 10 (Figures 3&4).Measurements in sphere-14 of both the MnCl2 and NiCl2 arrays, with the shortest T1 and T2, are challenging. We excluded sphere-14 in the plots, because even the site-reference protocol could not always make a reasonable measurement (i.e., the standard deviation across pixels in the ROI was greater than the measured value). The site-reference measurement estimated the NiCl2 T1<30 ms, T2<30 ms and MnCl2 T1<85 ms, T2<30 ms. The T1 values in particular are much shorter than the expected values in vivo7.
Previous multi-site comparisons studies have seen the largest differences in relaxation measurements between vendors8-10 rather than within a vendor. When the acquisition process can be closely matched, using the same or similar hardware, software, sequences and analysis pipeline, the reported differences in T1 measurement are small11,12. In this case, even with B1+correction on the VFA measurement, NiCl2 T1 was overestimated compared to site-reference by 1% to 92% for both platforms. The remaining measurements – MnCl2 T1, NiCl2 T2, and MnCl2 T2 – were within +/-20% of site-reference and NMR-reference values.
In the future, in vivo data will be collected and complete data sets acquired using the same phantom for all sites. Additionally, there is no temperature correction applied to these measurements, which may be a source of error and could be corrected for in future studies.
Conclusion
In this preliminary analysis, the ramped-down Aera and Free.Max systems had comparable measurements of T1 and T2 on the ISMRM/NIST system phantom.Acknowledgements
Certain commercial equipment, instruments, or materials are identified in this paper in order to specify the experimental procedure adequately. Such identification is not intended to imply recommendation or endorsement by NIST, nor is it intended to imply that the materials or equipment identified are necessarily the best available for the purpose.
The Michigan authors acknowledge grant support from the National Institutes of Health and research support from Siemens Healthineers.
The NHLBI authors would also like to acknowledge the assistance of Siemens Healthcare in the modification of the prototype MAGNETOM Aera MRI system for operation at 0.55T under an existing cooperative research agreement (CRADA) between NHLBI and Siemens Healthcare.
The USC authors acknowledge grant support from the National Science Foundation and National Institutes of Health, and research support from Siemens Healthineers.
References
1. https://www.nist.gov/programs-projects/nistnibib-medical-imaging-phantom-lending-library2. Layton KJ, Kroboth S, Jia F, et al. Pulseq: A rapid and hardware-independent pulse sequence prototyping framework. Magnetic Resonance in Medicine. 2017;77(4):1544-1552. doi:10.1002/mrm.26235
3. Inati SJ, Naegele JD, Zwart NR, et al. ISMRM Raw data format: A proposed standard for MRI raw datasets. Magnetic Resonance in Medicine. 2017;77(1):411-421. doi:10.1002/mrm.26089
4. Keenan KE, Gimbutas Z, Dienstfrey A, et al. Assessing effects of scanner upgrades for clinical studies. Journal of Magnetic Resonance Imaging. 2019;50(6):1948-1954.
5. Karakuzu A, Boudreau M, Duval T, et al. qMRLab: Quantitative MRI analysis, under one umbrella. Journal of Open Source Software. 2020;5(53):2343. doi:10.21105/joss.02343
6. Lebel RM. StimFit: A toolbox for robust T2 mapping with stimulated echo compensation. Proc Intl Soc Mag Reson Med. 2012;20:2588.
7. Campbell-Washburn, AE, Ramasawmy R, Restivo MC, et al. Opportunities in Interventional and Diagnostic Imaging by Using High-Performance Low-Field-Strength MRI. Radiology. 2019;293(2):384–93. doi:10.1148/radiol.2019190452
8. Bane O, Hectors SJ, Wagner M, et al. Accuracy, repeatability, and interplatform reproducibility of T1 quantification methods used for DCE-MRI: Results from a multicenter phantom study. Magnetic Resonance in Medicine. 2018;79(5):2564-2575. doi:10.1002/mrm.26903
9. Keenan KE, Gimbutas Z, Dienstfrey A, et al. Multi-site, multi-platform comparison of MRI T1 measurement using the system phantom. PLOS ONE. 2021;16(6):e0252966. doi:10.1371/journal.pone.0252966
10. Lee Y, Callaghan MF, Acosta-Cabronero J, Lutti A, Nagy Z. Establishing intra- and inter-vendor reproducibility of T1 relaxation time measurements with 3T MRI. Magnetic Resonance in Medicine. 2019;81(1):454-465. doi:10.1002/mrm.27421
11. Weiskopf N, Suckling J, Williams G, et al. Quantitative multi-parameter mapping of R1, PD(*), MT, and R2(*) at 3T: a multi-center validation. Front Neurosci. 2013;7:95. doi:10.3389/fnins.2013.00095
12. Gracien RM, Maiworm M, Brüche N, et al. How stable is quantitative MRI? – Assessment of intra- and inter-scanner-model reproducibility using identical acquisition sequences and data analysis programs. NeuroImage. 2020;207:116364. doi:10.1016/j.neuroimage.2019.116364
Figures