5096
Longitudinal stability of brain and spinal cord structural quantitative MRI measures1NeuroPoly, Polytechnique Montreal, Montreal, QC, Canada, 2Centre de Recherche de l’Institut Universitaire de Gériatrie de Montréal (CRIUGM), Montreal, QC, Canada, 3Unité de Neuroimagerie Fonctionnelle (UNF), Centre de Recherche de l’Institut Universitaire de Gériatrie de Montréal (CRIUGM), Montreal, QC, Canada, 4Faculty of Computer Science and Engineering (FINKI), Skopje, Macedonia, 5Psychology Department, Université de Montréal, Montreal, QC, Canada, 6Mila - Quebec AI Institute, Montreal, QC, Canada, 7Centre de recherche du CHU Sainte-Justine, Université de Montréal, Montreal, QC, Canada
Synopsis
Keywords: Quantitative Imaging, Quantitative Imaging
The stability of quantitative MRI measures of microstructure in the brain and spinal cord was quantified longitudinally over three years. Six healthy subjects were scanned approximately four times per year with an structural quantitative imaging protocol (T1w, T2w, T2*w, DWI, MP2RAGE, MTsat, and B1). The intra-subject COV indicated good stability of all quantitative metrics measured in the brain (< 2.3% in WM, < 3.1% in GM). The spinal cord resulted in slightly higher COVs (3.9% - 9.5%). This work is part of a larger project, the Courtois project on neural modelling (CNeuroMod).Introduction
Longitudinal stability of qMRI metrics are an important feature needed to quantify tissue properties during the progression of diseases or therapies that are probed by longitudinal clinical studies. The aim of this study was to measure the stability of quantitative microstructure MRI measurements across ten time points over 3 years in the brain and cervical spinal cord, and share the dataset and automated and containerized processing pipelines with the community.Methods
Quantitative MRI protocols (brain and spinal cord) were acquired as part of the the Courtois project on neural modelling (CNeuroMod), which aims to collect data on six healthy subject, over the course of 5 years to train and improve artificial intelligence models on brain behaviour and activity. Over the course of 3 years, subjects were scanned up to 10 times on a 3T MRI scanner (Prisma Fit, Siemens, Erlangen, Germany). Custom headcases (Caseforge, Berkeley, USA) were designed and used for each participant to minimize movements during the imaging sessions. Two sets of quantitative imaging protocols were acquired, one for the brain (MP2RAGE (T1), MTsat (MTsat, T1, and MTR), and B1) and one for the spinal cord (T1w, T2w, MTsat (MTsata, T1, and MTR), and B1). Figure 1 illustrates the dataset; more information on the protocols can be found at http://docs.cneuromod.ca.The data are accessible via the CNeuroMod databank (cneuromod.ca). The data are anonymized and defaced, in BIDS format [1,2] and managed using Datalad [3] and git-annex. Different post-processing pipelines were used for the brain and spine. The brain pipelines were built using Nextflow and Docker containers which used qMRLab [4] for B1, T1, MTsat, and MTR mapping and TractoFlow [5] for diffusion processing. For the spinal cord, the pipeline was developed in a shell script using all tools available through the Spinal Cord Toolbox (SCT). The pipelines and details are available on GitHub (https://github.com/courtois-neuromod/anat-processing).
Results
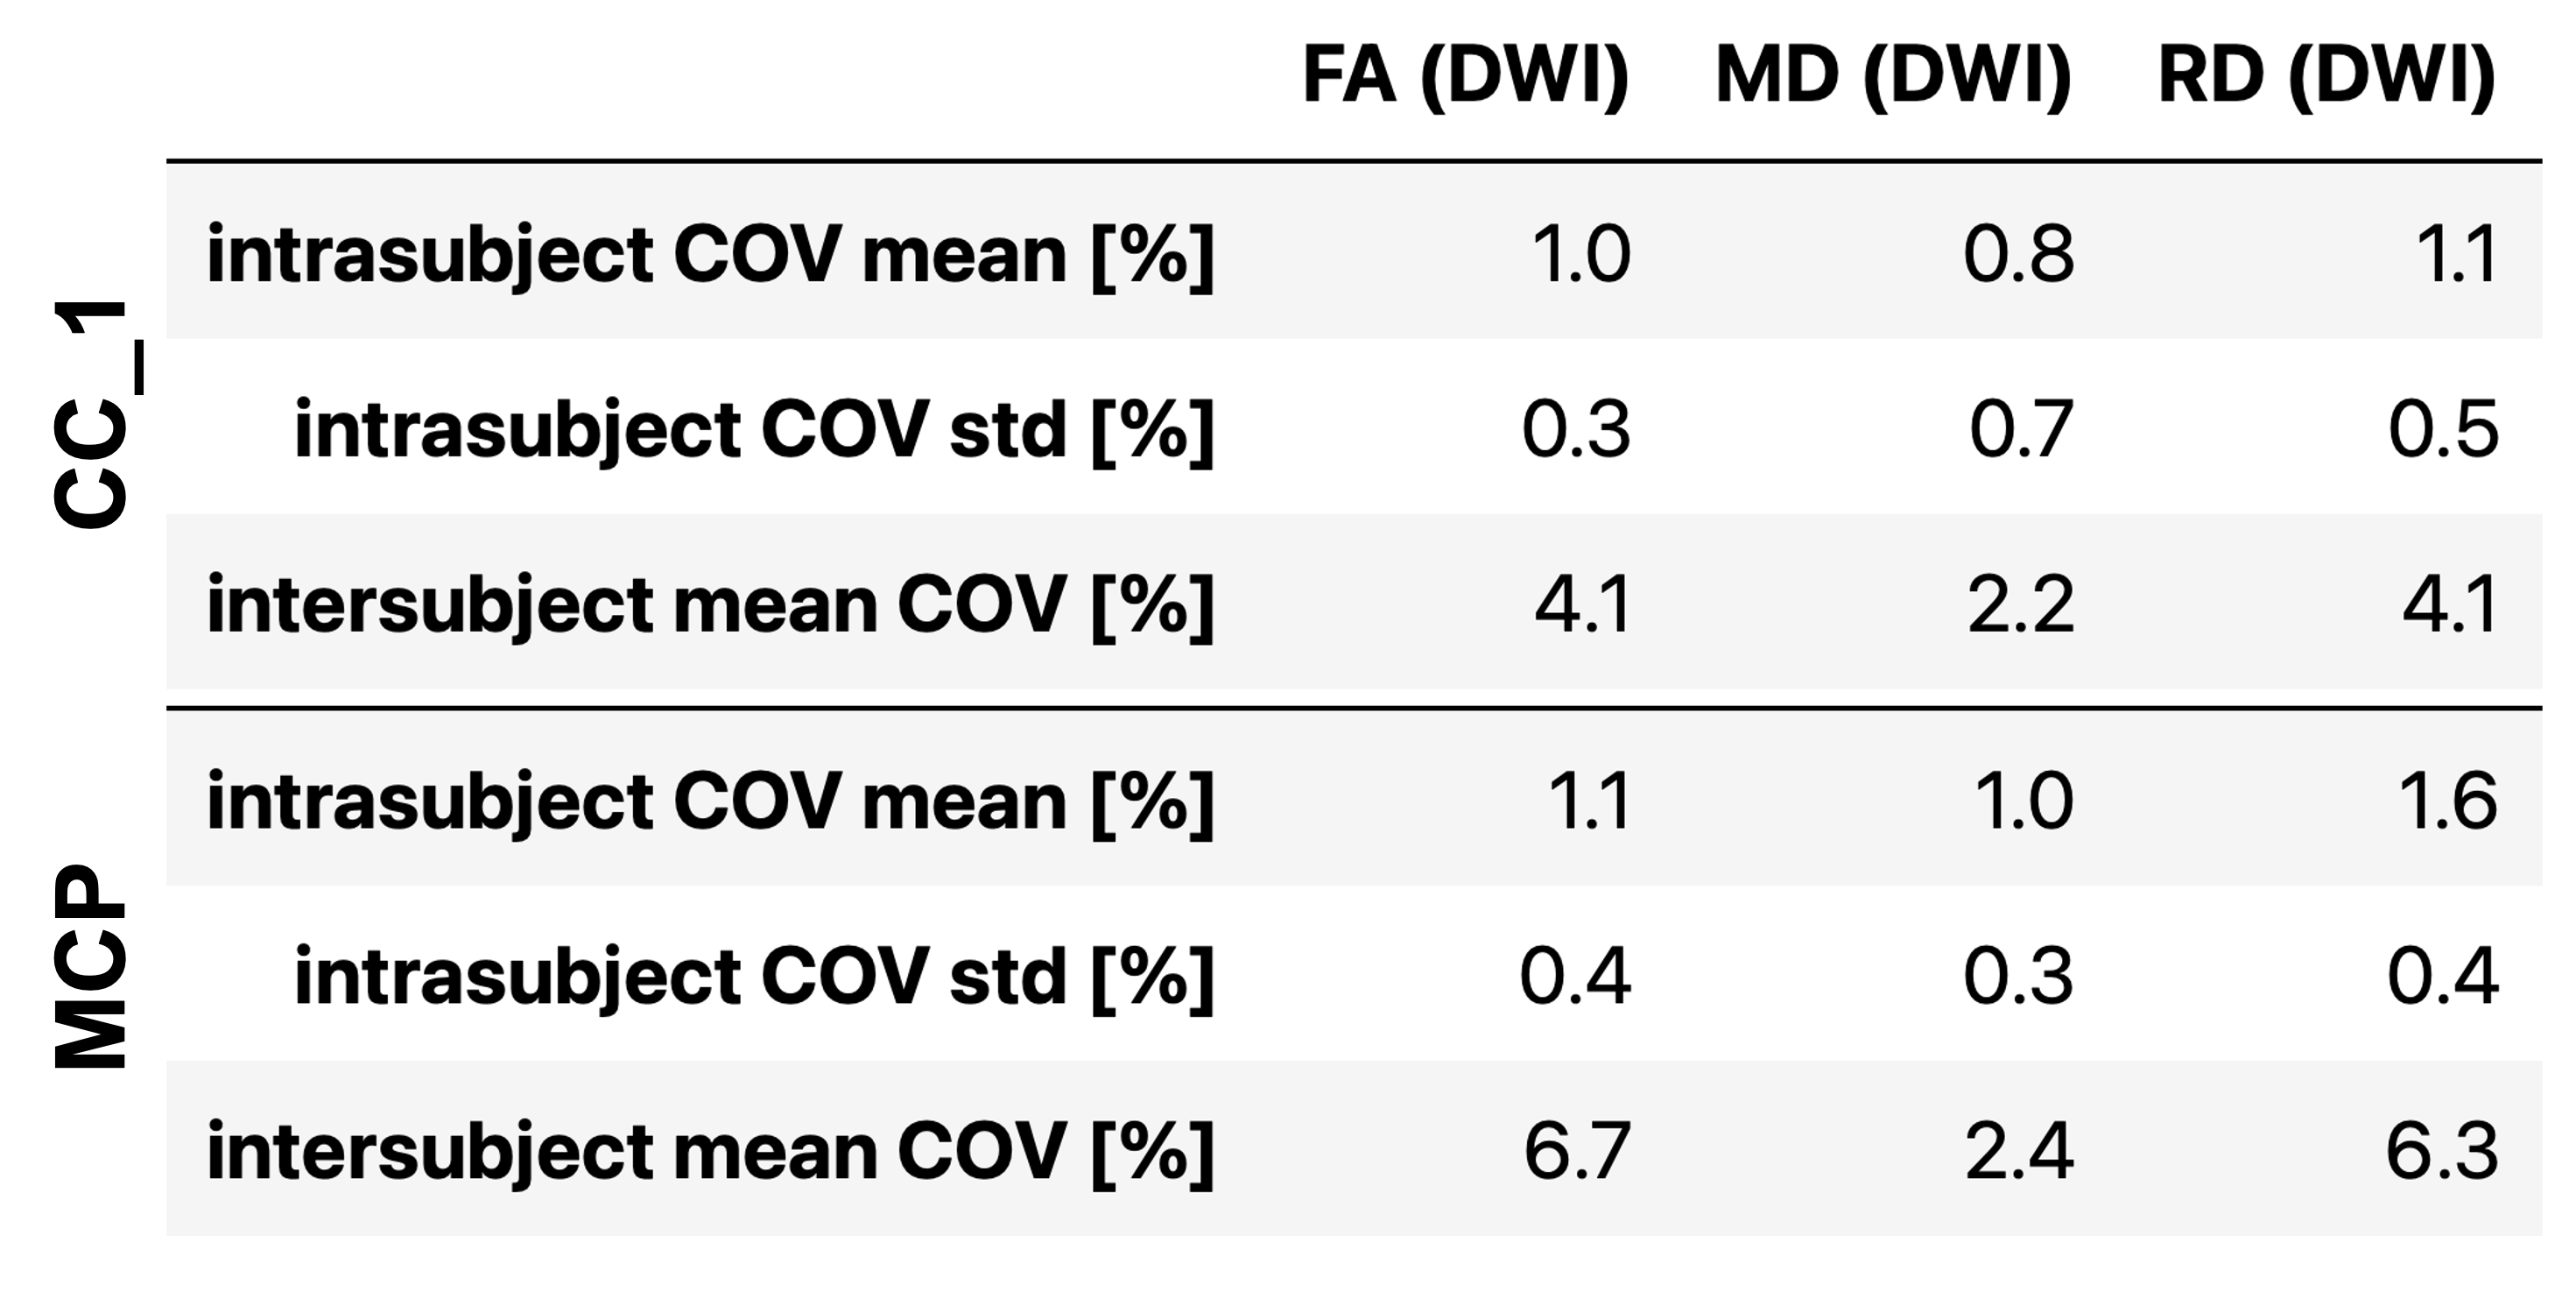
Mean quantitative MRI metrics (T1, MTR, and MTsat) are shown in Figure 2 for the segmented white and grey matters of each subject. Note that MTR is calculated from a subset of the MTsat measurements, and B1 is not shown because it is only used as a RF field correction factor for the MTsat measurement and does not have biological specificity. The intrasubject coefficient of variation (COV) means for WM T1 calculated from MP2RAGE (0.6%) was 4 times lower than for T1 calculated from MTsat (2.3%), possibly due to the lower number of measurements needed: two for MP2RAGE, and five for MTsat (including the two needed for B1 mapping). Intrasubject COVs for WM MTR were similar to those from MP2RAGE, and 3 times lower than MTsat (note that MTR is a subset of MTsat measurements). Intersubject mean COV was highest for WM T1 calculated from MTsat at 3.5%, and lowest for MTR at 0.4%.Figure 3 shows the COVs of the three diffusion metrics (FA, MD, and RD) along two axonal tracts (rostrum – CC_1, and middle cerebellar peduncle – MCP). All three methods exhibited high intersubject mean COVs (> 2%), but low intrasubject COV means (~<= 1%, except for RD in the MCP at 1.6%). MD exhibited the lowest intrsubject COV means (~1%) and inter-subject mean COVs (~2.4%).
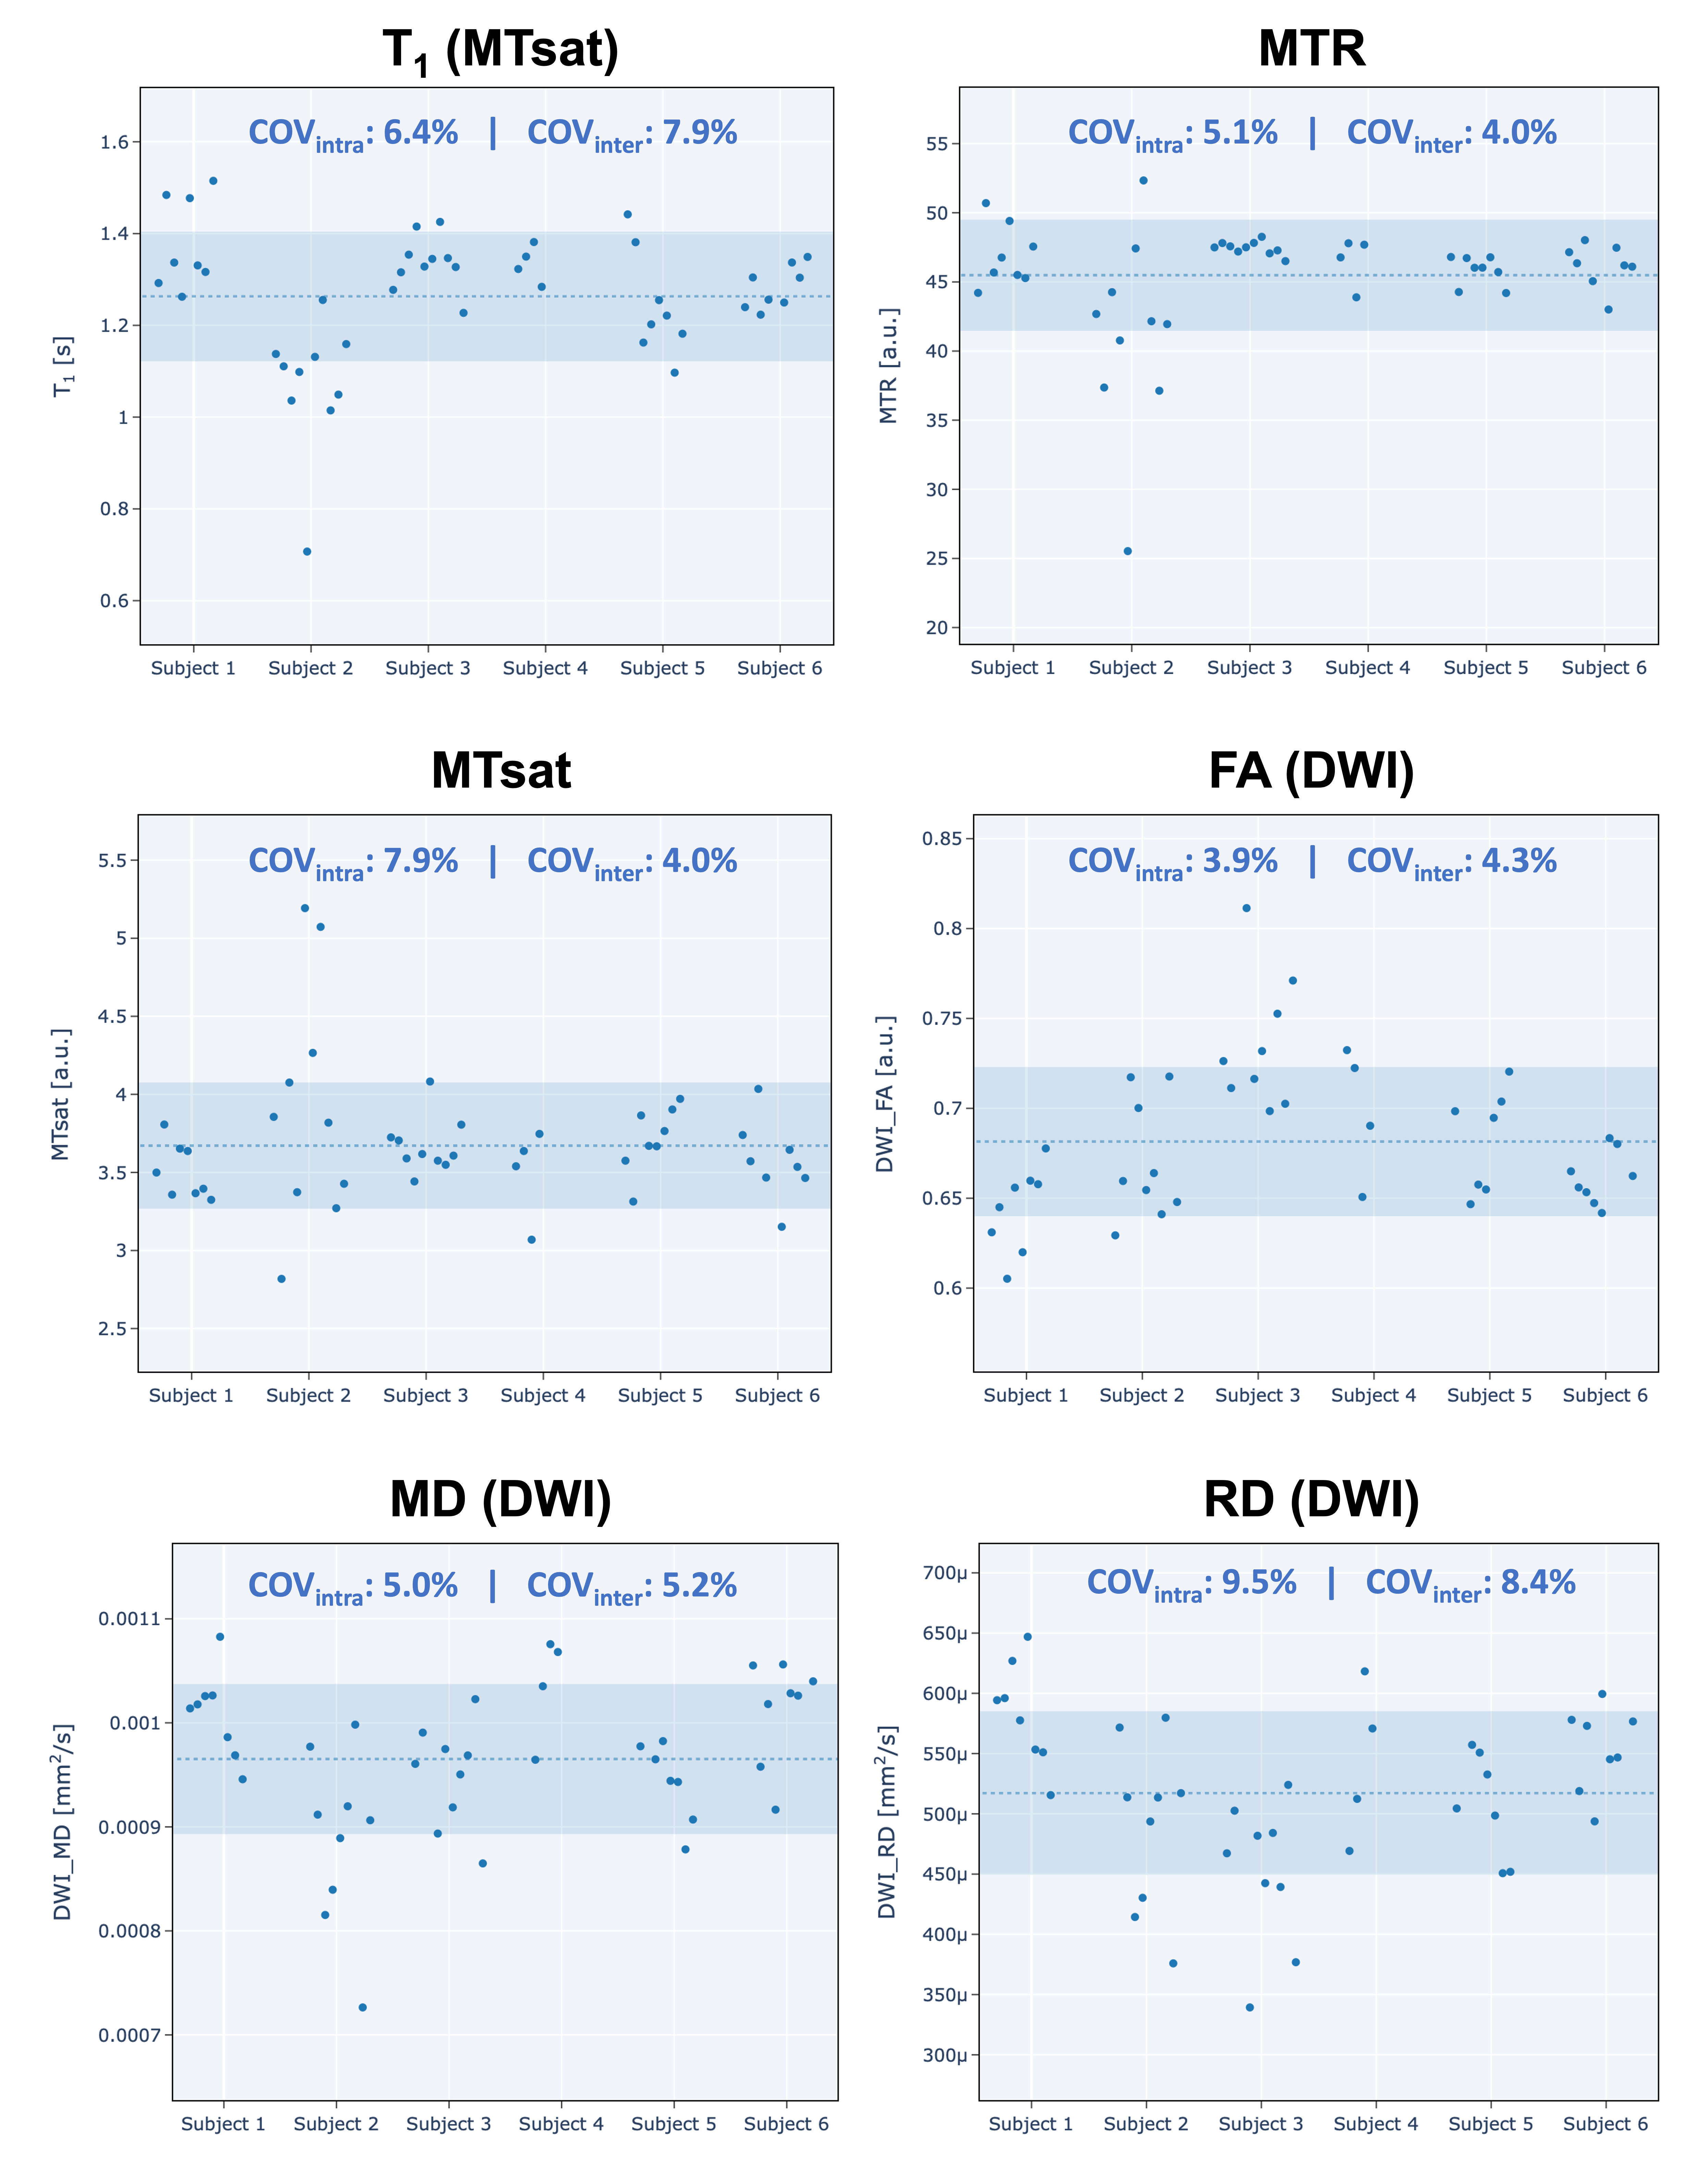
Figure 4 shows the scatter plots and COVs of all qMRI metric means calculated in the WM across the C2-C5 vertebral levels of the spinal cord. Also, as observed in the brain, MTR resulted in lower intrasubject COV means (5.1%) than MTsat (7.9%). T1 had the better mean intersubject COV (7.9%) relative to its two concomitant metrics (MTR - 4.6%, MTsat - 4.0%). For diffusion, FA resulted in the lowest intrasubject COV means (3.9%), and MD and RD were substantially higher, as opposed to the observations seen in the brain.
Conclusions
We report on the stability of fundamental MR parameters (T1, diffusion) and myelin-specific biomarkers (MTR, MTsat) in the central nervous system (brain and spinal cord) over the course of three years at a single imaging site. The reported intra-subject COV means indicate good stability of all quantitative metrics measured in the brain (< 2.3% in WM, < 3.1% in GM) through 10 repeated sessions over about 3 years. The metrics that exhibited the lowest COVs (MTR and T1 (MP2RAGE)) were also the metrics that used the lowest number of raw MRI images to calculate the metrics (two, versus three plus a B1 map for MTsat and its calculated T1), suggesting that quantitative MRI metric stability may be degraded if they need substantially more measurements, versus than measures that can be calculate from a lower number images (i.e. MTR and T1 (MP2RAGE), calculated from two images). This work complements findings from recent longitudinal studies qMRI [6–8], in particular one study that looked at a set of complementary metrics (T2/T2*, quantitative susceptibility, cerebral blood flow, and diffusivity) to investigate the impact of scanner software and hardware upgrades over 7 years [9]. Our work is part of a larger project, CNeuroMod, and this long-term dataset of quantitative MRI measurements may be valuable to incorporate in deep learning models of other measurements (eg, fMRI, MEG) to account for confounding changes in the brain.Acknowledgements
This project was supported by funds given to PB by the Foundation Courtois. We’d like to also thank all the staff involved in scanning the subjects for the Courtois Neuromod project.References
1. Gorgolewski KJ, Auer T, Calhoun VD, Craddock RC, Das S, Duff EP, et al. The brain imaging data structure, a format for organizing and describing outputs of neuroimaging experiments. Scientific Data. 2016;3: 1–9.
2. Karakuzu A, Appelhoff S, Auer T, Boudreau M, Feingold F, Khan AR, et al. qMRI-BIDS: An extension to the brain imaging data structure for quantitative magnetic resonance imaging data. Sci Data. 2022;9: 517.
3. Halchenko Y, Meyer K, Poldrack B, Solanky D, Wagner A, Gors J, et al. DataLad: distributed system for joint management of code, data, and their relationship. J Open Source Softw. 2021;6: 3262.
4. Karakuzu A, Boudreau M, Duval T, Boshkovski T, Leppert I, Cabana J-F, et al. qMRLab: Quantitative MRI analysis, under one umbrella. J Open Source Softw. 2020;5: 2343.
5. Theaud G, Houde J-C, Boré A, Rheault F, Morency F, Descoteaux M. TractoFlow: A robust, efficient and reproducible diffusion MRI pipeline leveraging Nextflow & Singularity. Neuroimage. 2020;218: 116889.
6. Gracien R-M, Nürnberger L, Hok P, Hof S-M, Reitz SC, Rüb U, et al. Evaluation of brain ageing: a quantitative longitudinal MRI study over 7 years. Eur Radiol. 2017;27: 1568–1576.
7. Gracien R-M, Maiworm M, Brüche N, Shrestha M, Nöth U, Hattingen E, et al. How stable is quantitative MRI? - Assessment of intra- and inter-scanner-model reproducibility using identical acquisition sequences and data analysis programs. Neuroimage. 2020;207: 116364.
8. York EN, Meijboom R, Thrippleton MJ, Bastin ME, Kampaite A, White N, et al. Longitudinal microstructural MRI markers of demyelination and neurodegeneration in early relapsing-remitting multiple sclerosis: magnetisation transfer, water diffusion and g-ratio. medRxiv. 2022. p. 2022.06.08.22276139. doi:10.1101/2022.06.08.22276139
9. Salluzzi M, McCreary CR, Gobbi DG, Lauzon ML, Frayne R. Short-term repeatability and long-term reproducibility of quantitative MR imaging biomarkers in a single centre longitudinal study. Neuroimage. 2022;260: 119488.
Figures
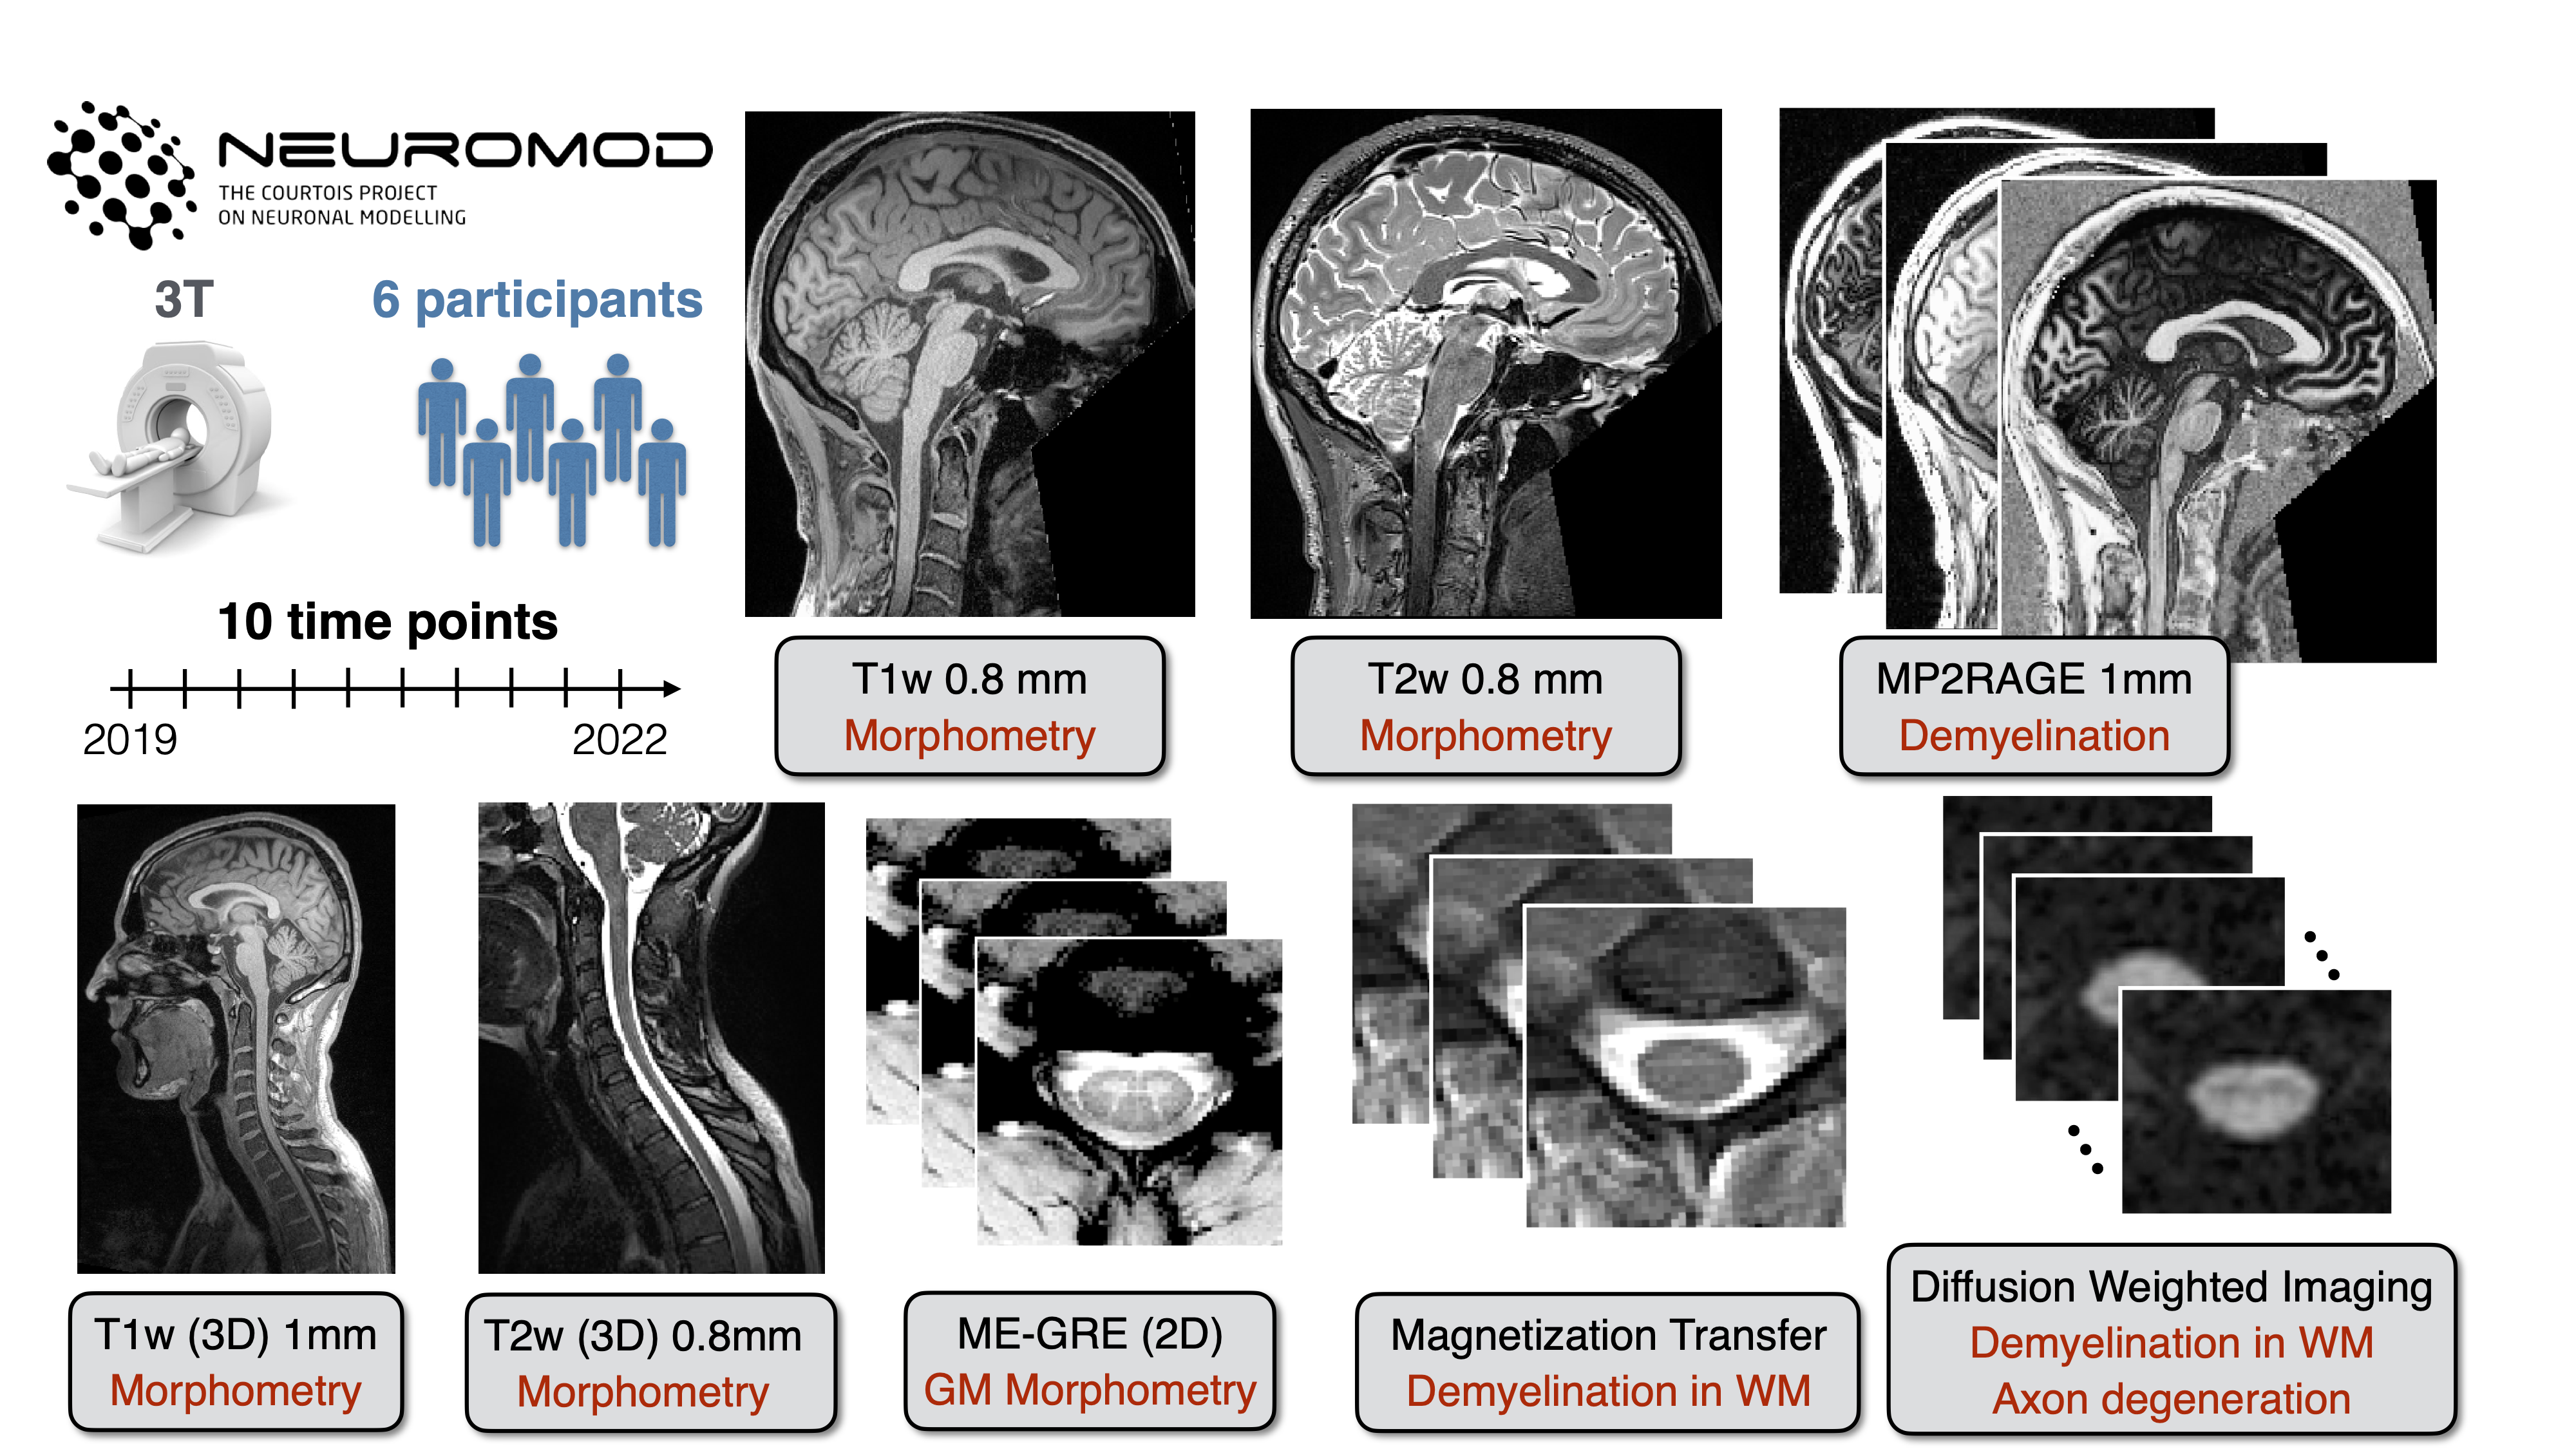
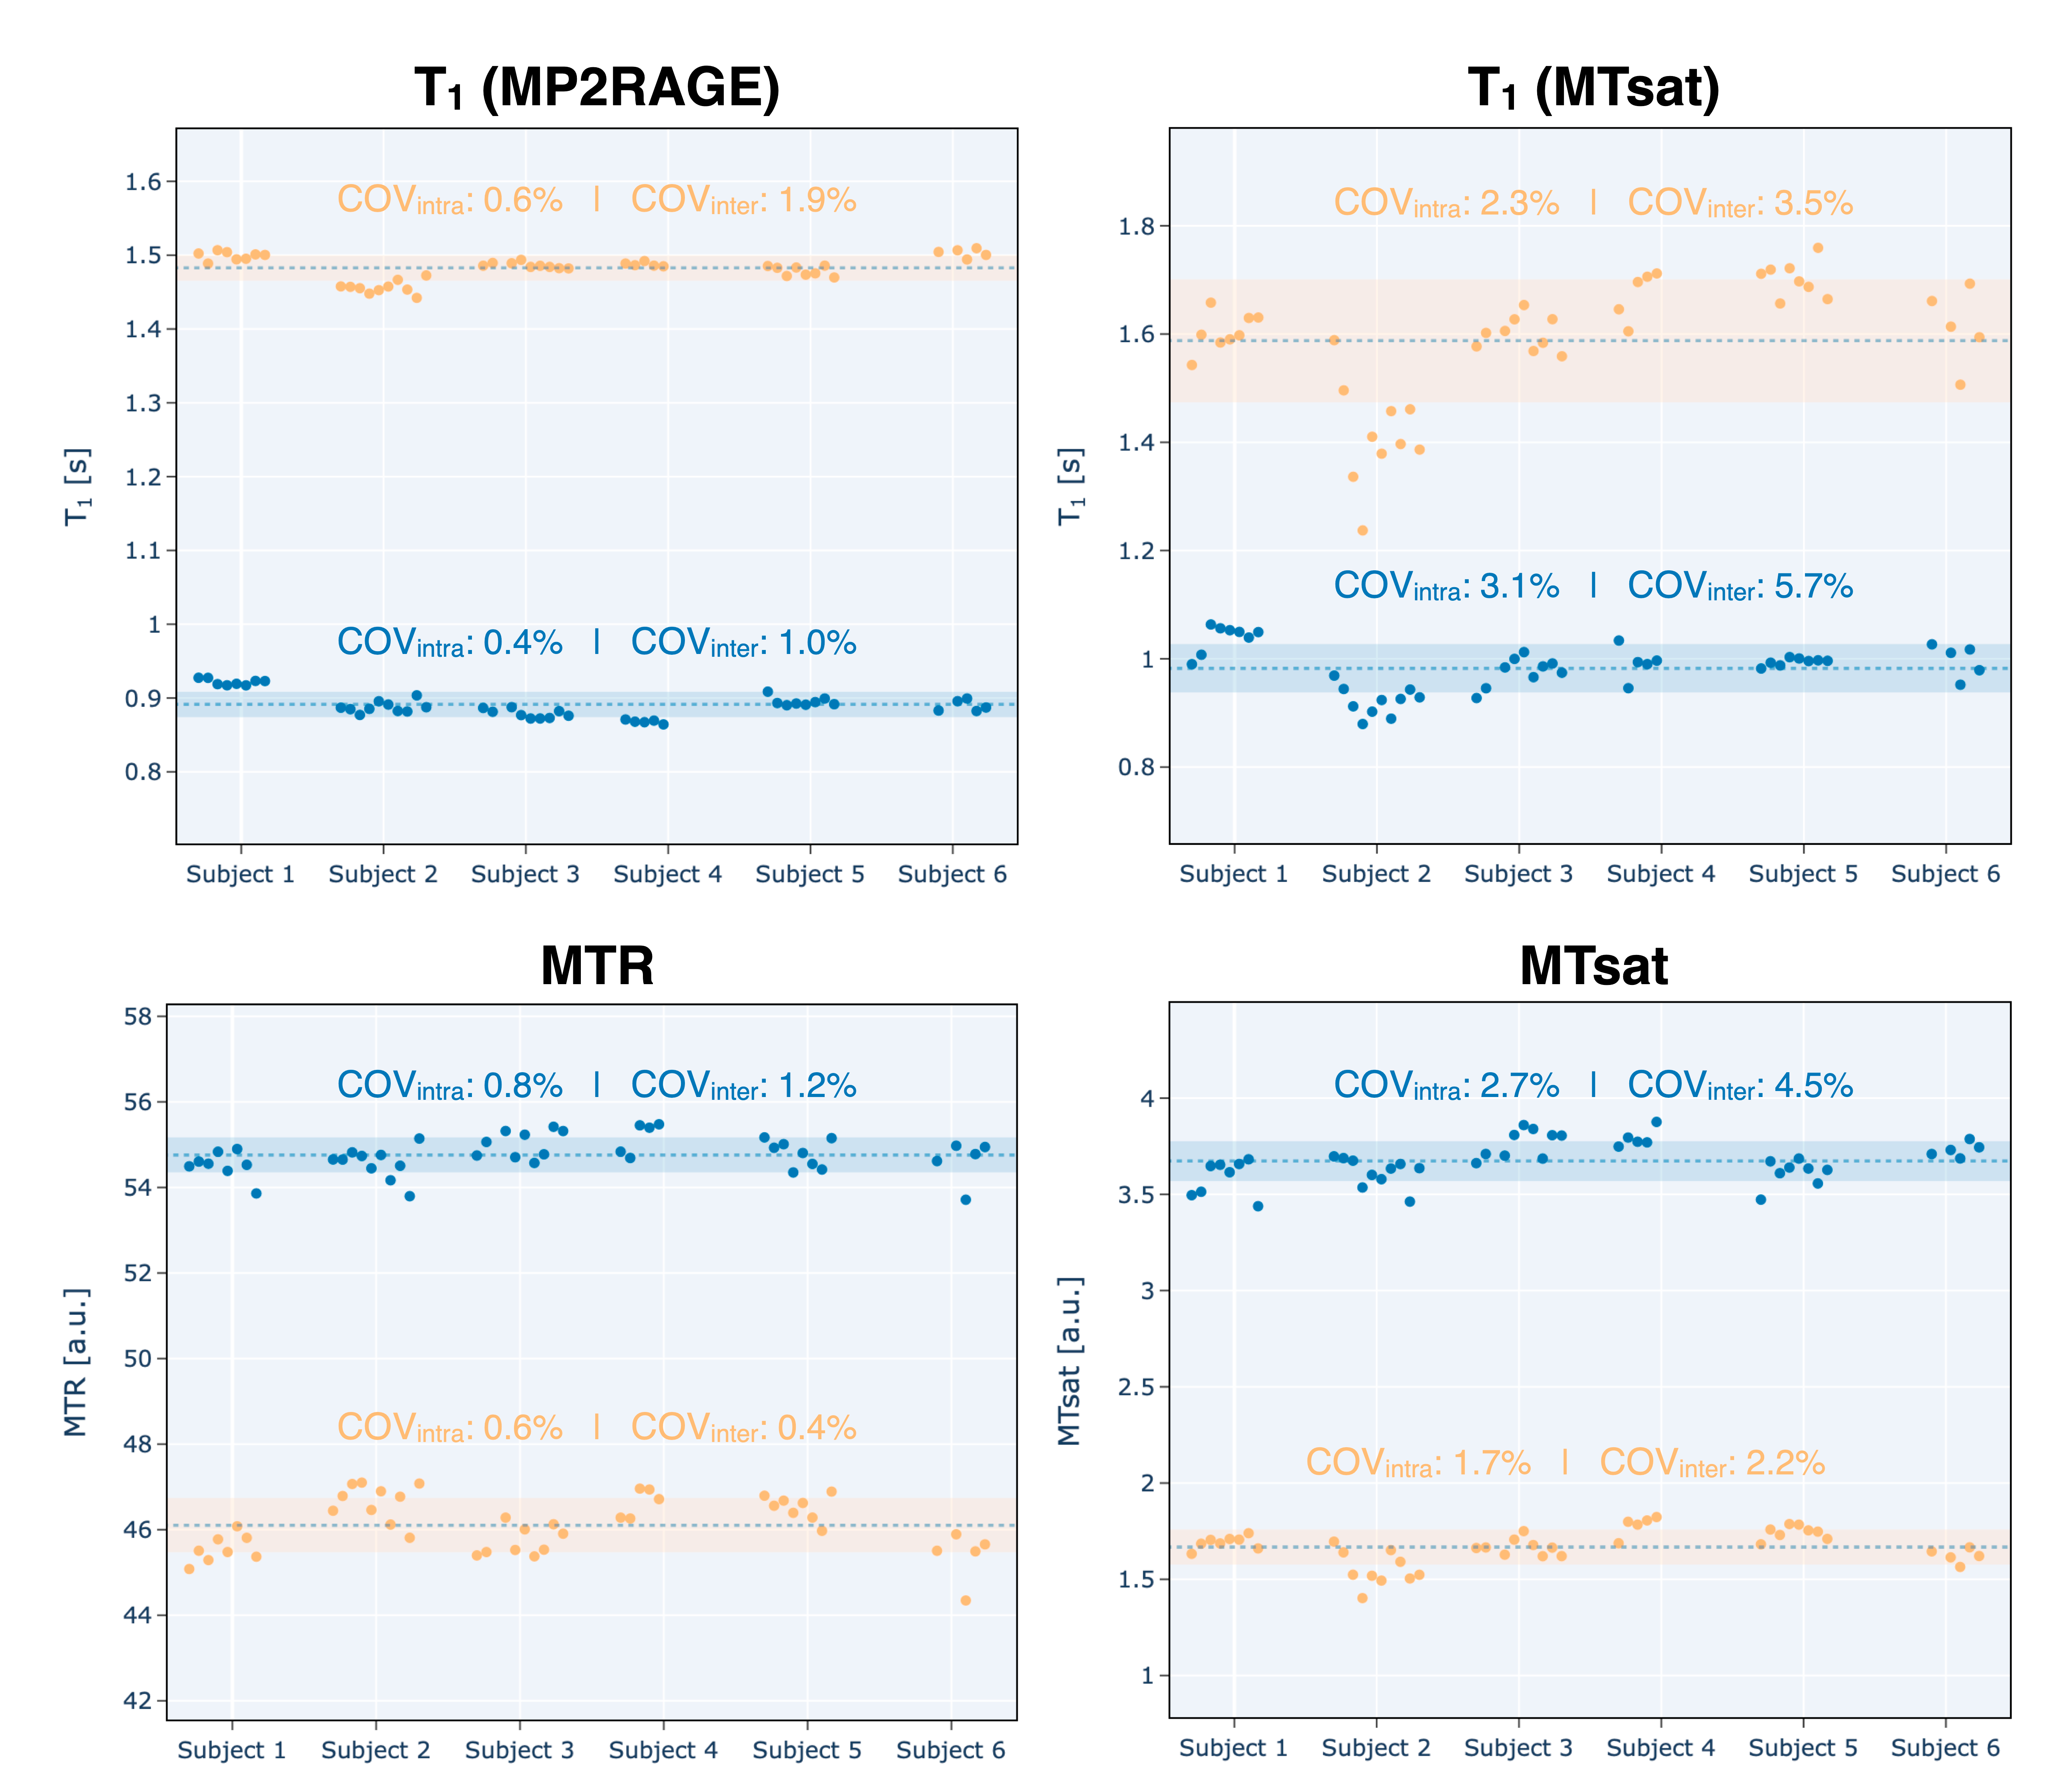
Figure 2. The mean quantitative MRI metrics (T1, MTR, and MTsat) for each acquired session are shown for the segmented brain white and grey matter of each subject. Missing data points are due to sessions that were acquired and aborted due to various scanning issues, or because they were excluded after undergoing quality control. Note: the 10th session of subject 5 has not yet occurred, and subject 4 stopped participating after their 5th session for reasons out of our control. The intra- and inter- subject COVs for these metrics in white and grey matter are shown inside each respective plot.