5095
Multicenter and multi-vendor reproducibility of T1, T2 and ADC phantom data on 1.5T and 3T MRI scanners1Bioengineering Department, Istituto di Ricerche Farmacologiche Mario Negri IRCCS, Ranica (BG), Italy, 2The MR Research Centre, Aarhus University, Aarhus, Denmark, 3Computer Assisted Clinical Medicine, Medical Faculty Mannheim, Heidelberg University, Mannheim, Germany, 4Mannheim Institute for Intelligent Systems in Medicine, Medical Faculty Mannheim, Heidelberg University, Mannheim, Germany, 5Clínica Universidad de Navarra, Pamplona, Spain, 6Unit of Radiology, ASST Papa Giovanni XXIII, Bergamo, Italy, 7University of Nottingham, Nottingham, United Kingdom
Synopsis
Keywords: Quantitative Imaging, System Imperfections: Measurement & Correction
This multicentre study aimed at assessing multi-vendor accuracy and reproducibility of typical MR biomarkers on 3T and 1.5T scanners from 5 clinical centers. MRI acquisitions were performed using NIST protocols, on Essential System and Diffusion NIST phantoms. T1 was measured by 3-parameter fitting, while T2 and ADC by mono-exponential fitting, using PhantomViewer software. When compared with reference values, non-negligible discrepancies were found across vendors, especially for T1 and T2 measurements. Reproducibility was vendor-dependent, and higher on 3T than on 1.5T scanners. ADC and T1 showed highest reproducibility. Corrections are likely needed to account for possible temperature and scanner differences.Introduction
With the advent of quantitative MRI (qMRI), tackling the challenge of standardization and harmonization among vendors and centers has become a fundamental step for multi-center clinical studies involving MRI, and the ultimate translation of MRI biomarkers to clinical practice1.The aim of this international study was thus to assess multisite and multi-vendor accuracy and reproducibility of typical MR biomarkers (T1, T2 and ADC). Field strength dependency was also taken into account by including both 3T and 1.5T scanners.Methods
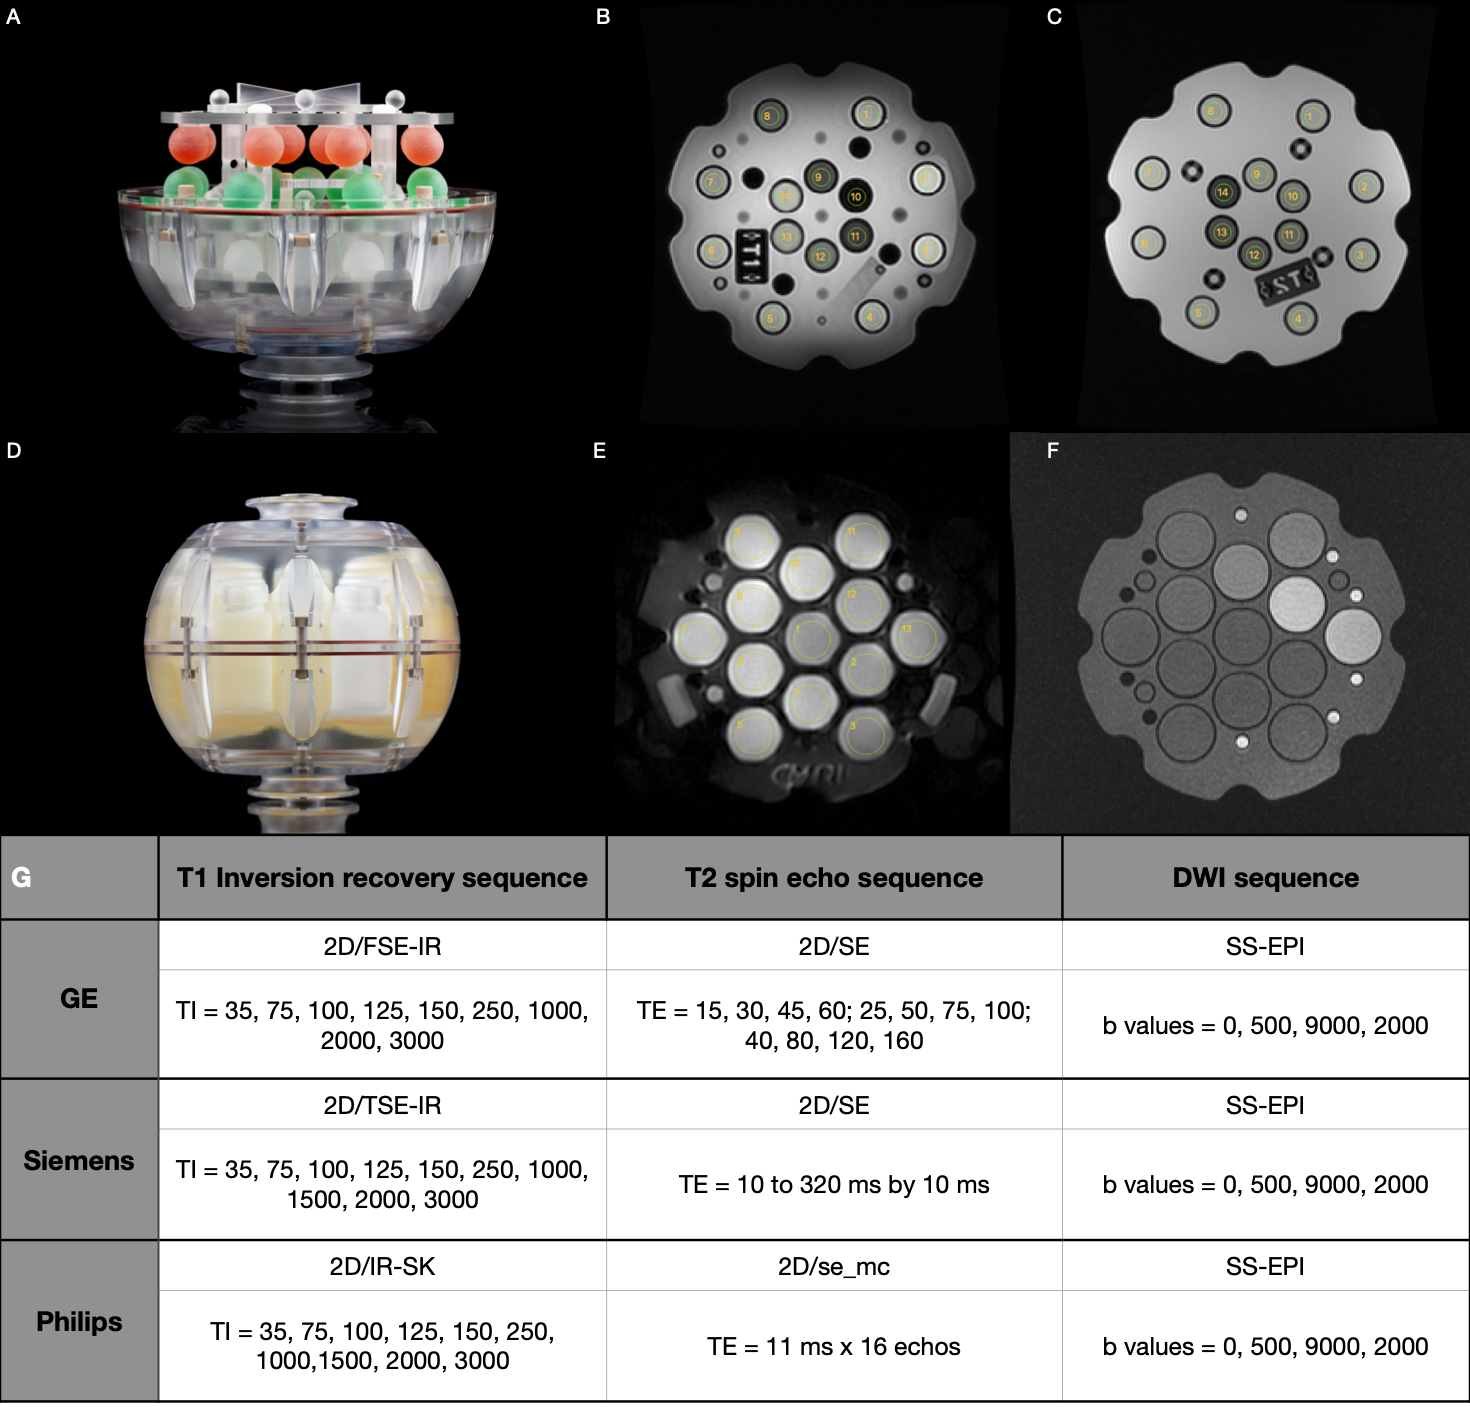
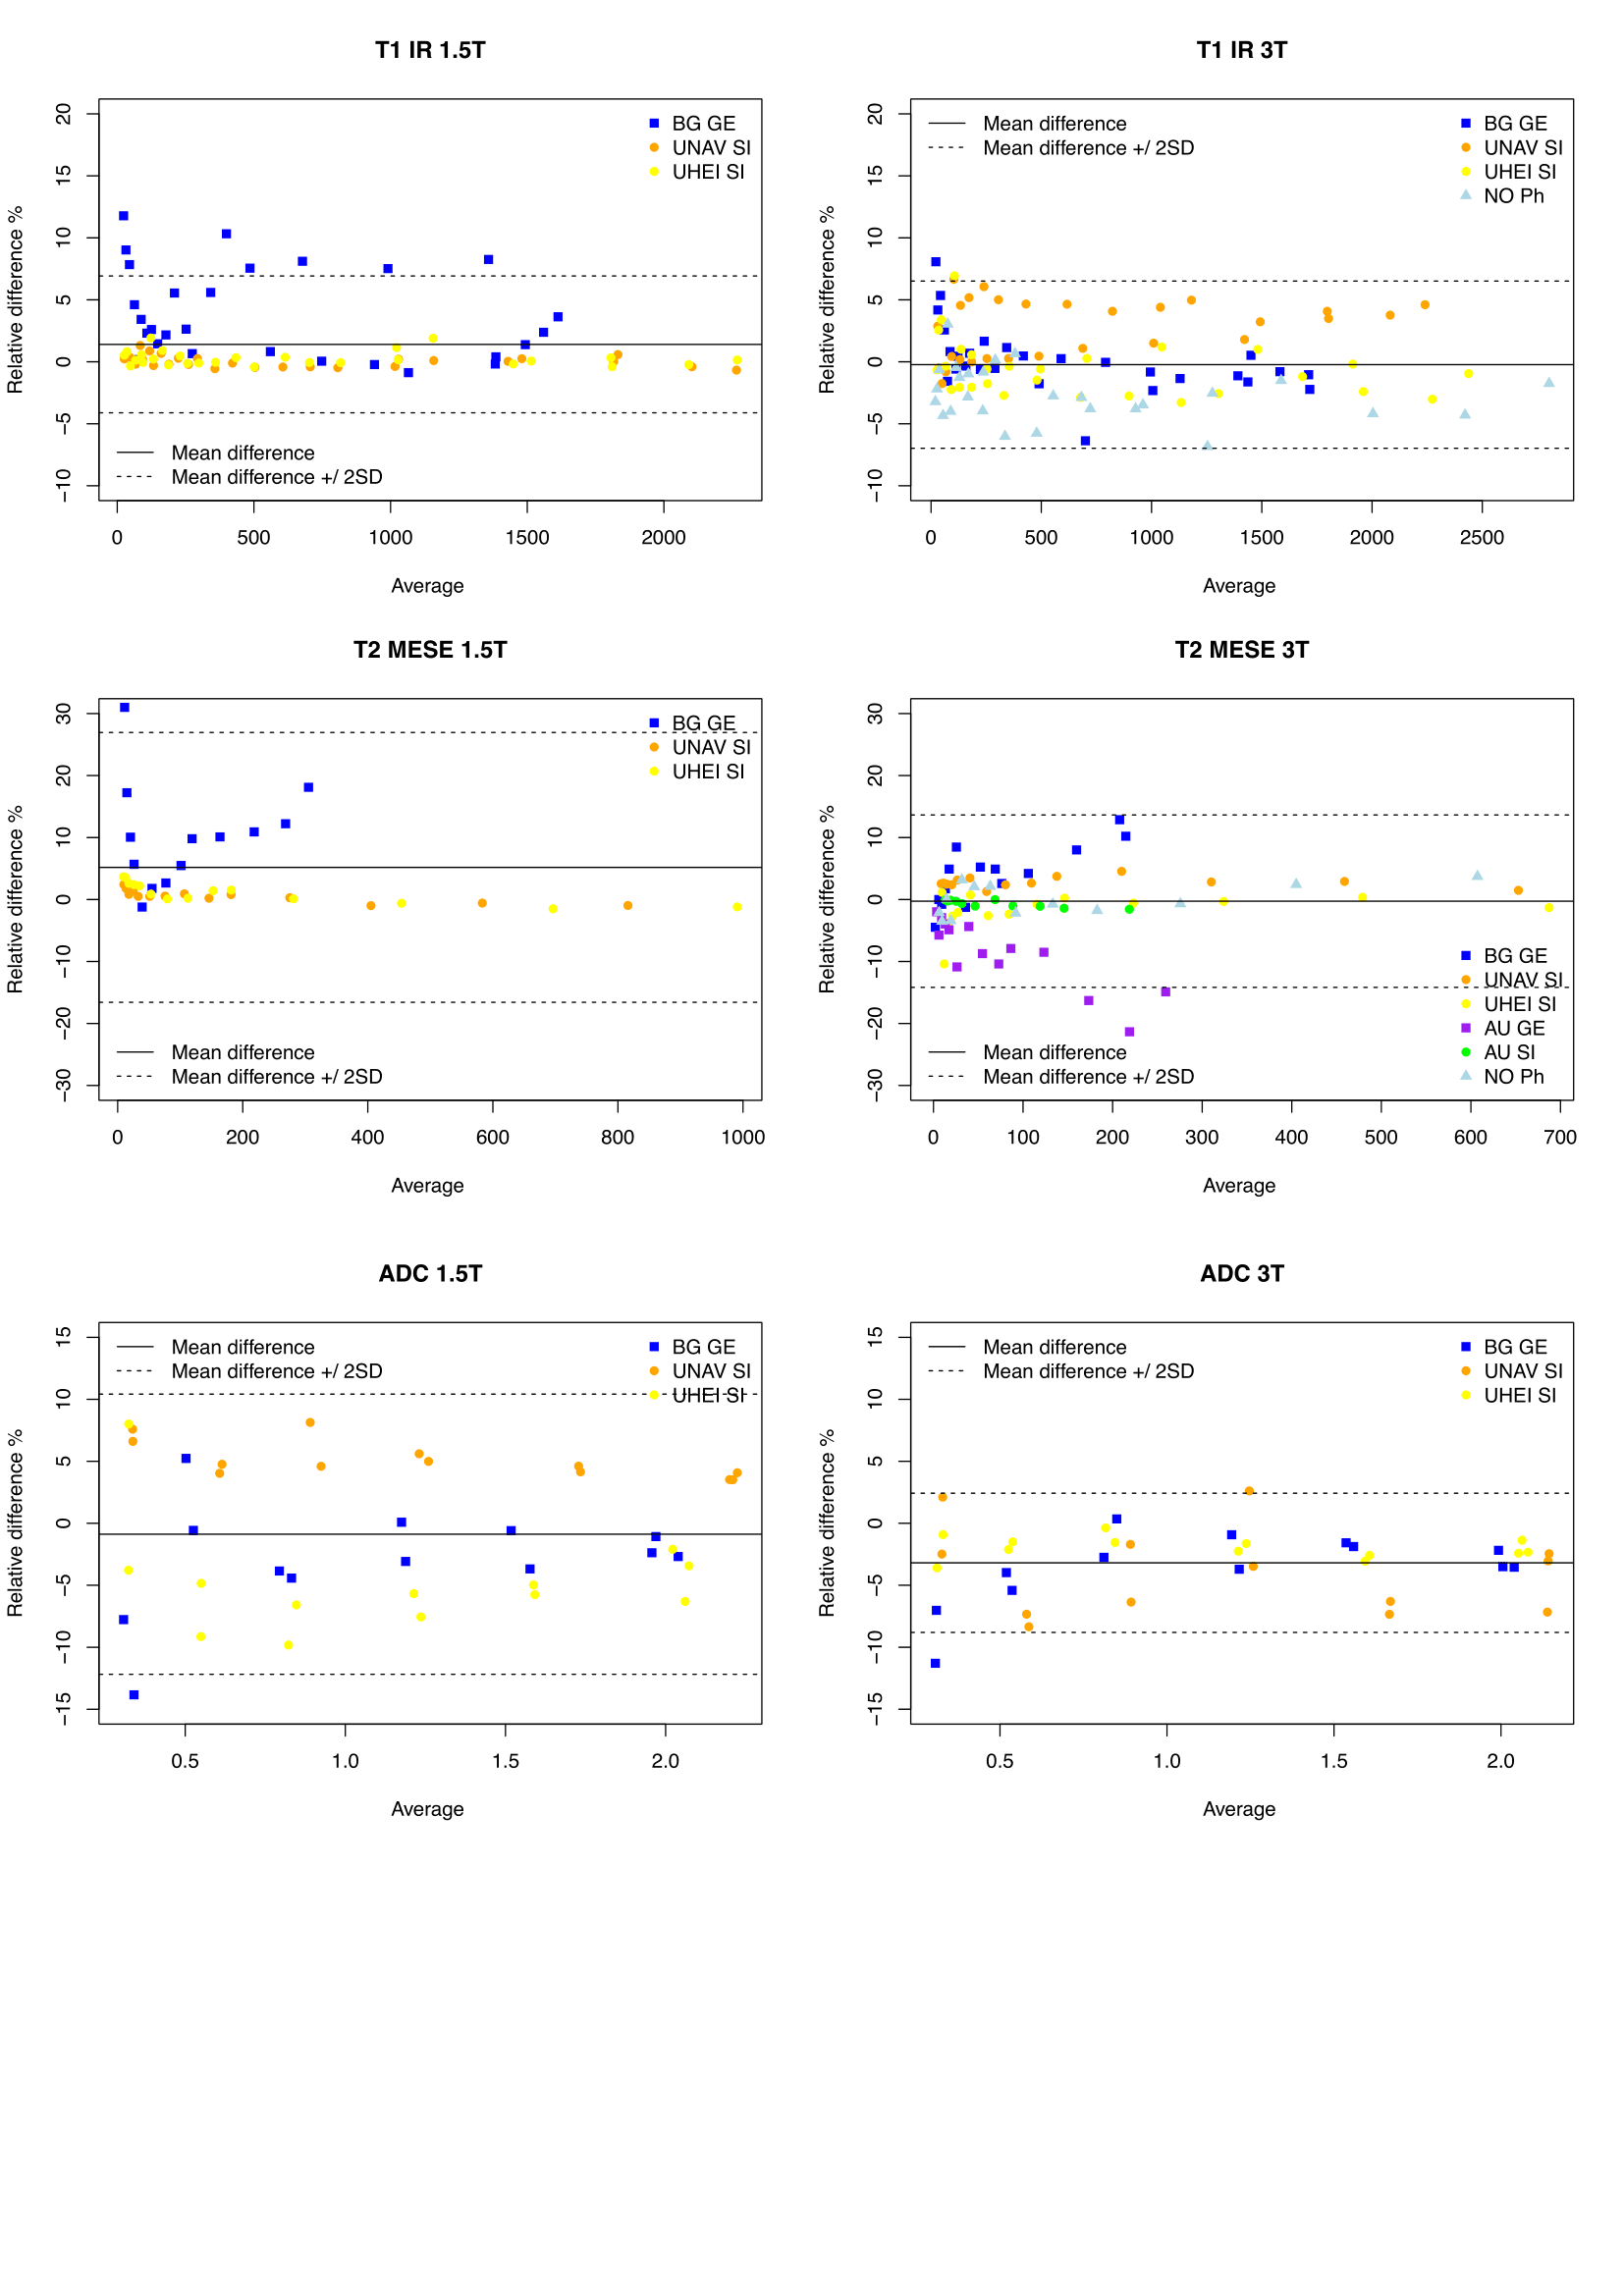
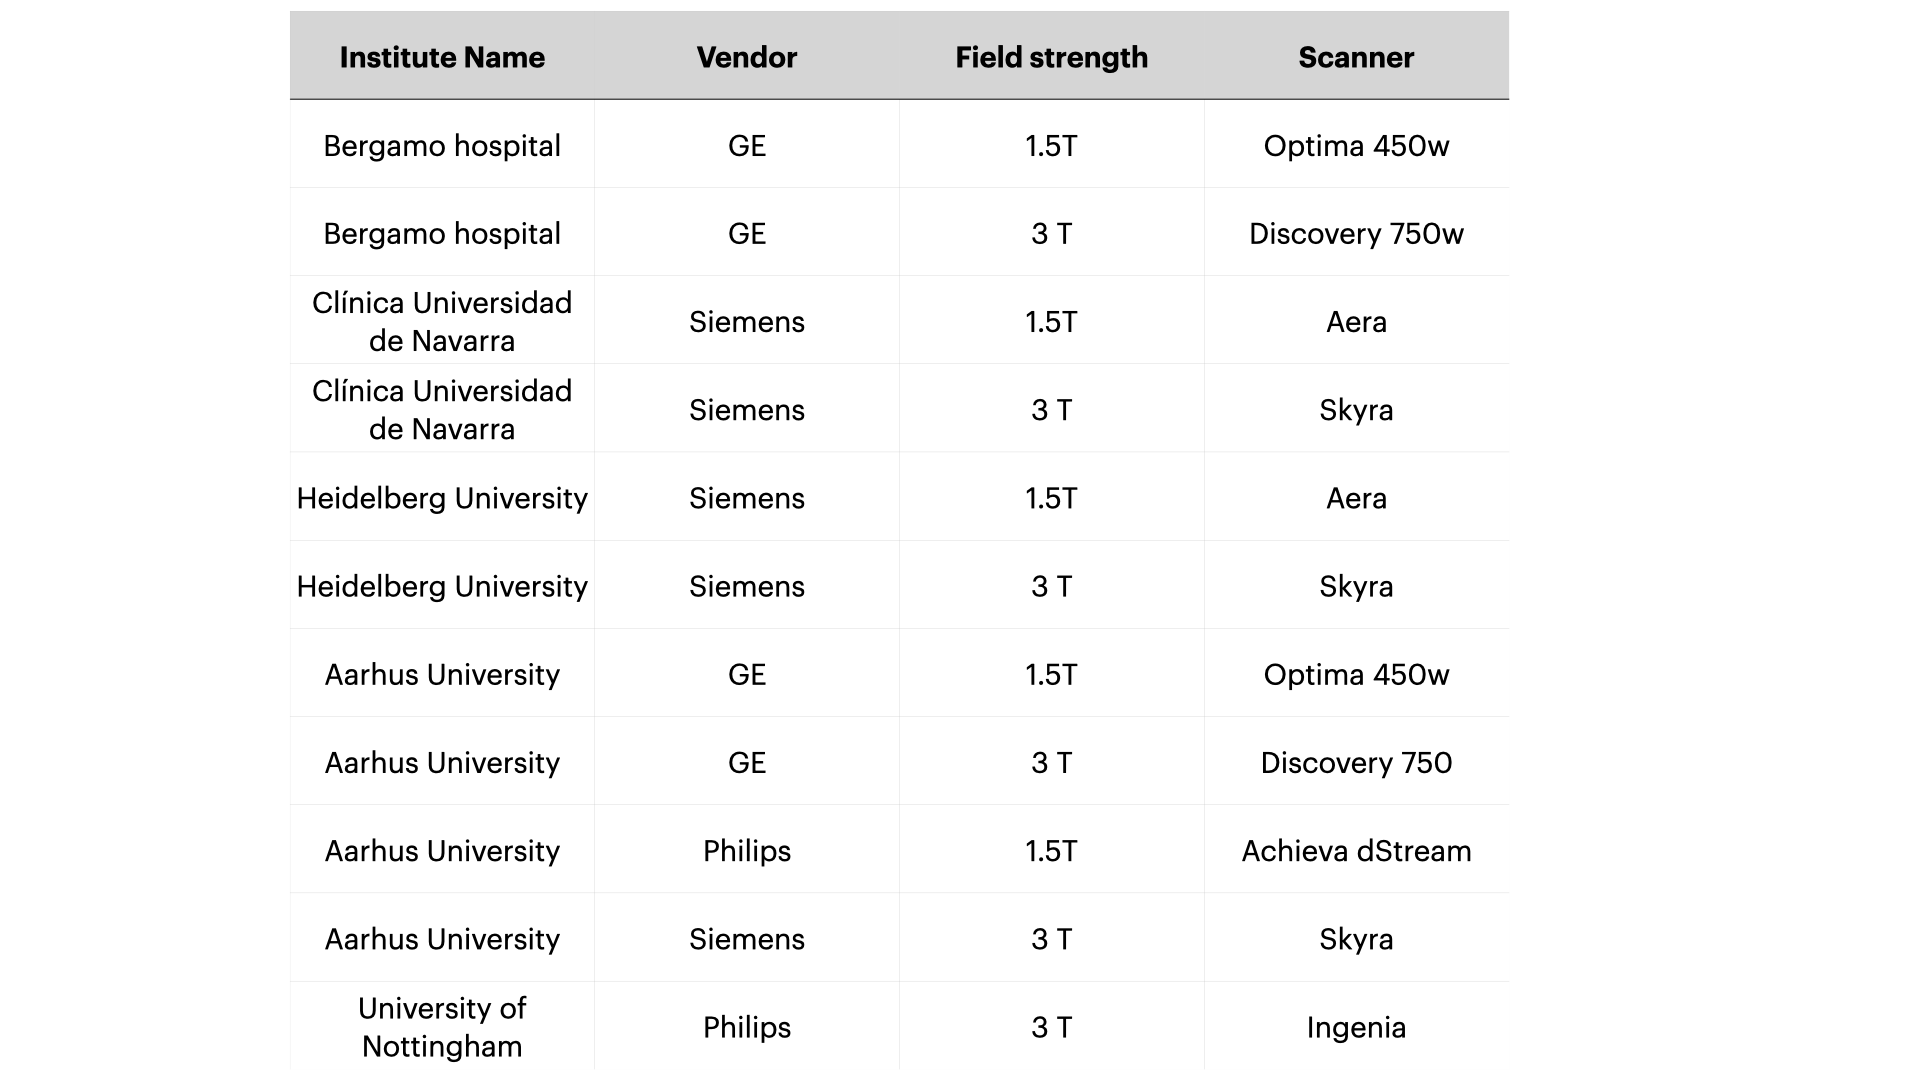
Five centers participated in this study providing MRI data from 3T and 1.5T scanners (Table 1). T1 and T2 data were acquired on the NIST Essential System Phantom (Figure 1A), while ADC values were acquired on the Diffusion Phantom (Figure 1D)(CaliberMRI, Boulder, CO, USA). Data was collected using the NIST approved protocols for each vendor. We acquired T1 maps on both T1 and T2 spheres2, T2 maps on T2 spheres2 and four ADC maps along the coronal, axial and sagittal plane3. For all acquisitions, only the central slice containing the spheres was used in the analyses. Regions of interest were manually placed on each sphere (Figure 1B, 1C and 1E). The phantom temperature was assessed via the phantom built-in liquid crystal MR-readable thermometer4 by an isotropic SPGR sequence (Figure 1F), both at the beginning and at the end of each acquisition session. We adopted an Inversion Recovery (IR) sequence for T1 determination, such that the average signal in each ROI could be determined with a 3-parameter fit S(TI) = S0|(1-(1+δ)e-TI/T1)|. T2 was measured with a Multi Echo Spin Echo sequence and determined using a mono exponential fit. For DWI an EPI sequence with four b-values (0,500,900,2000) was adopted and ADC was obtained with a mono exponential fit. Only coronal acquisitions were considered for subsequent analysis. MRI analyses were performed with PhantomViewer software2. Measured data were compared with NIST reference values at 20° provided by the pertinent manuals. In each center, all data were acquired twice. Vendor-specific reproducibility was assessed both visually, by Bland-Altman plots, and quantitatively, by computing the intraclass correlation coefficient (ICC), the coefficient of variation (CV), and the summary descriptives of the relative difference between acquisitions.Results
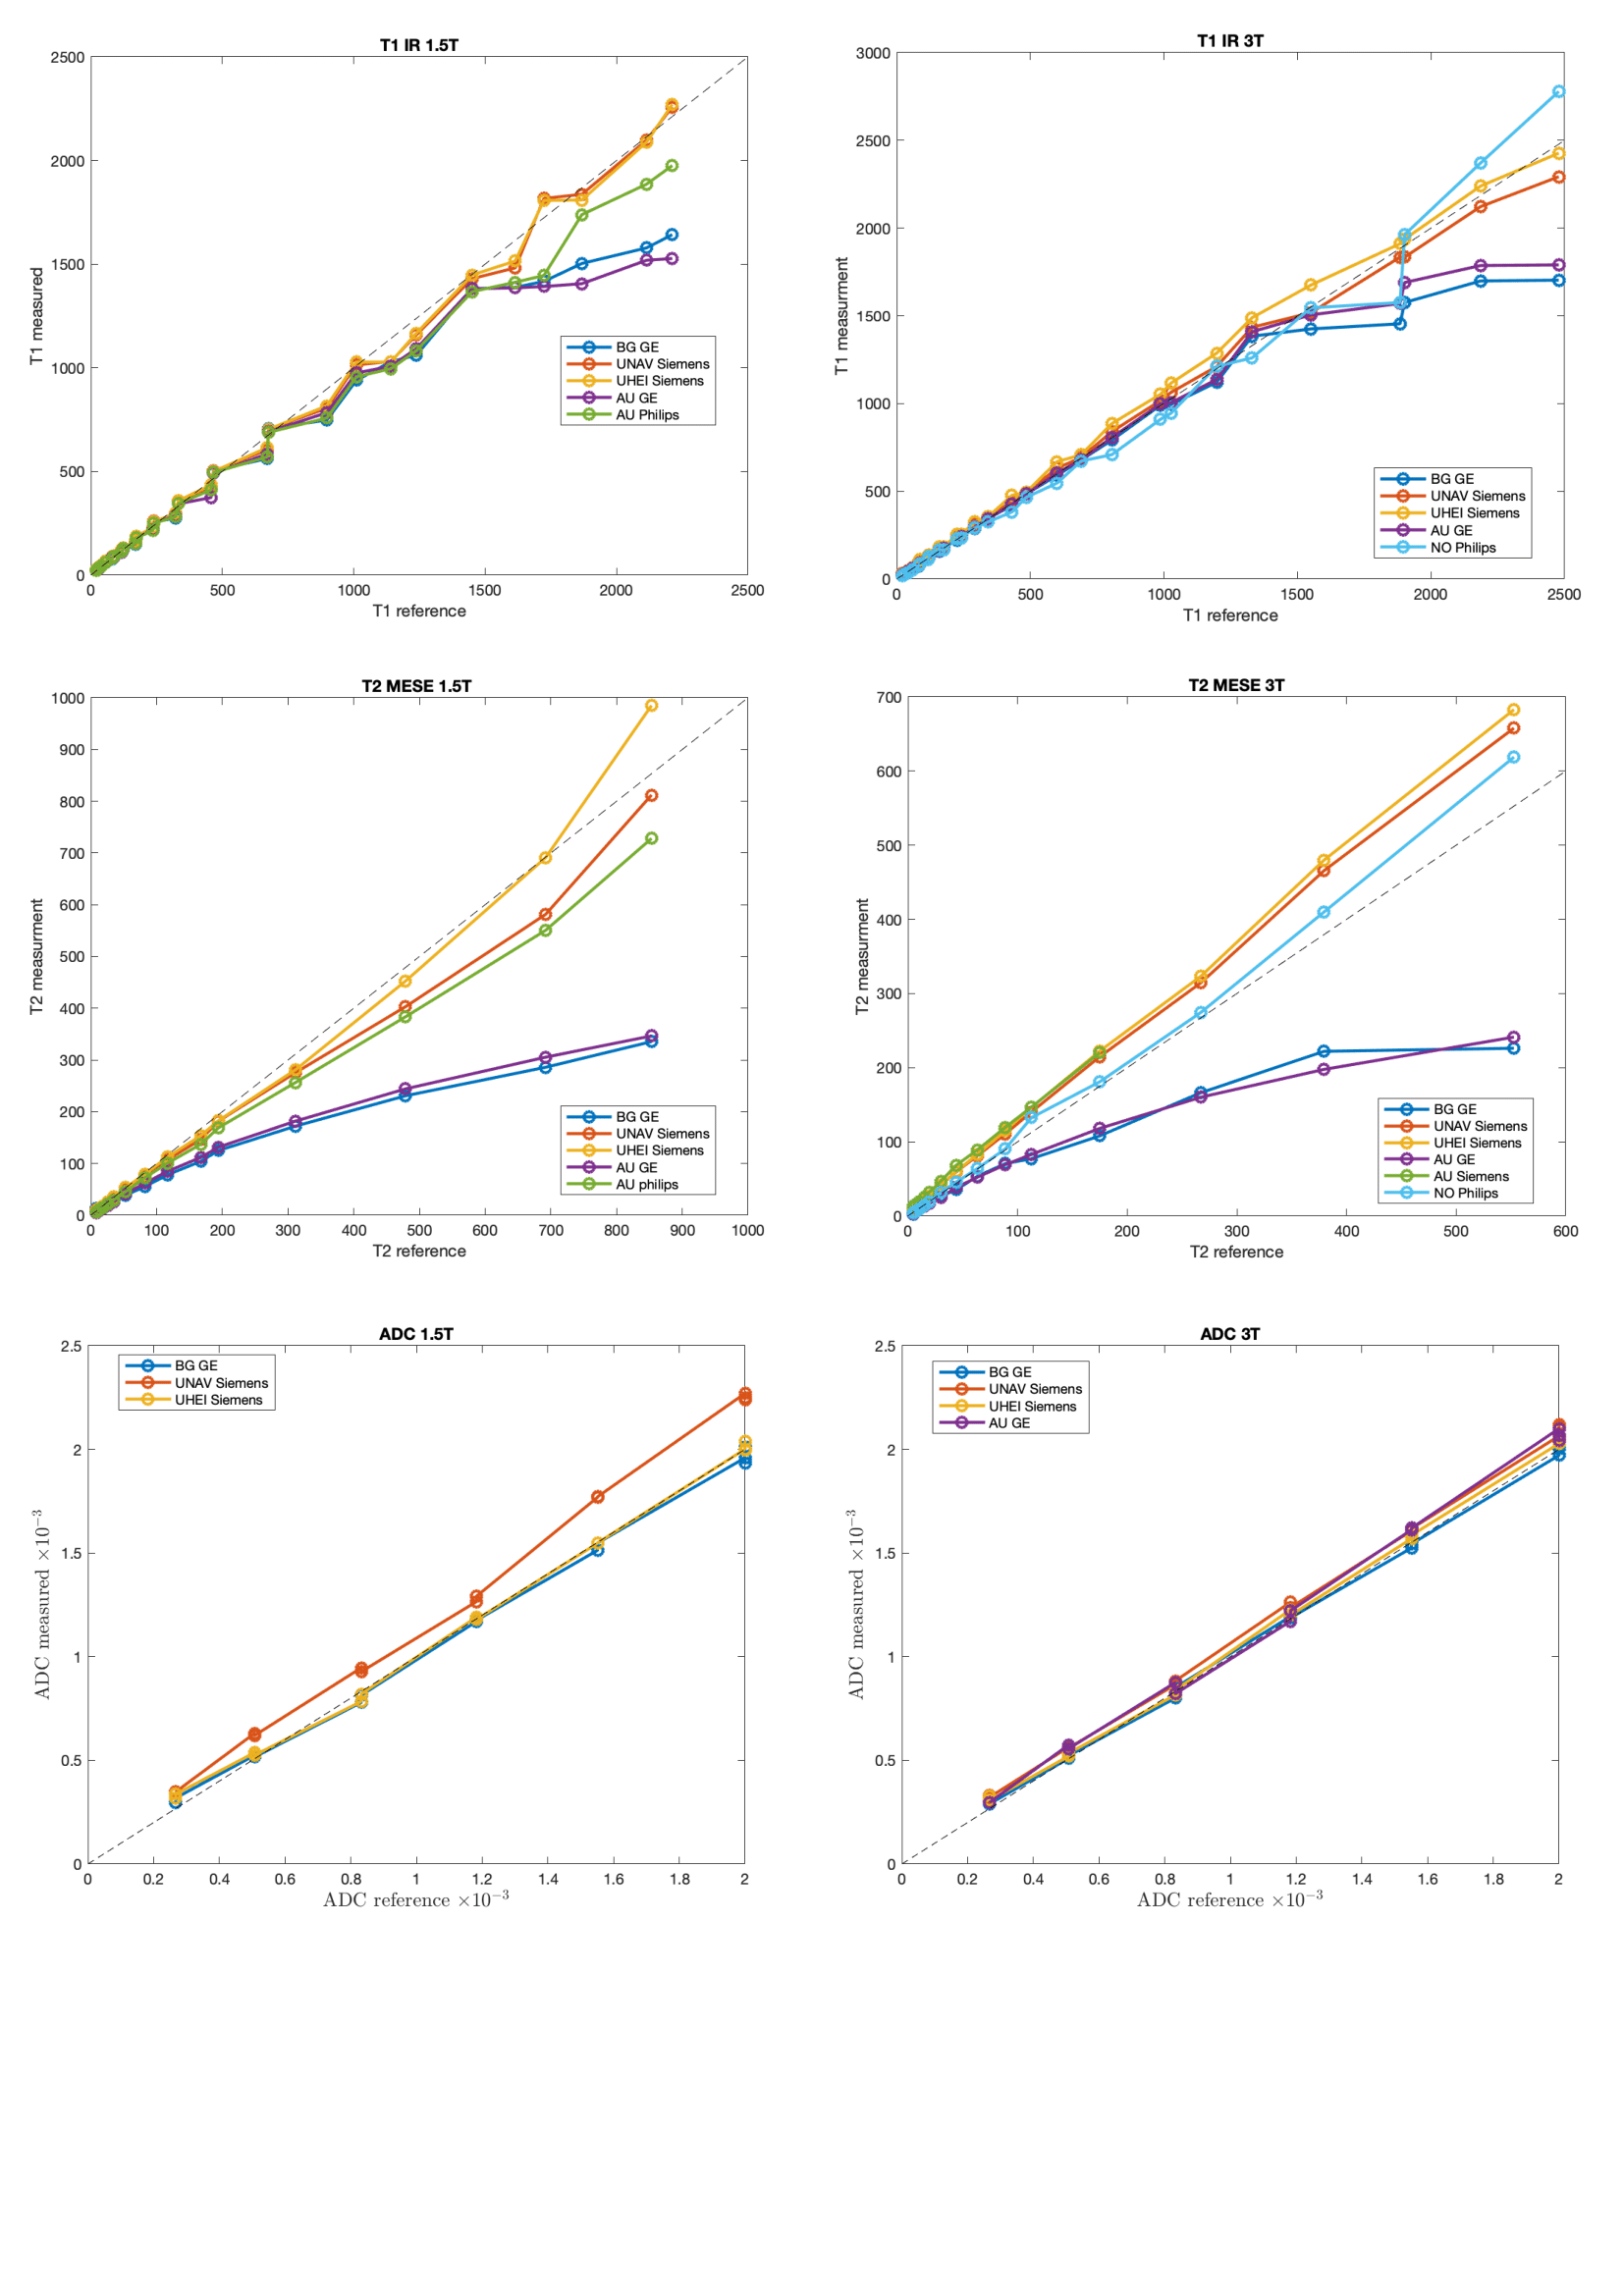
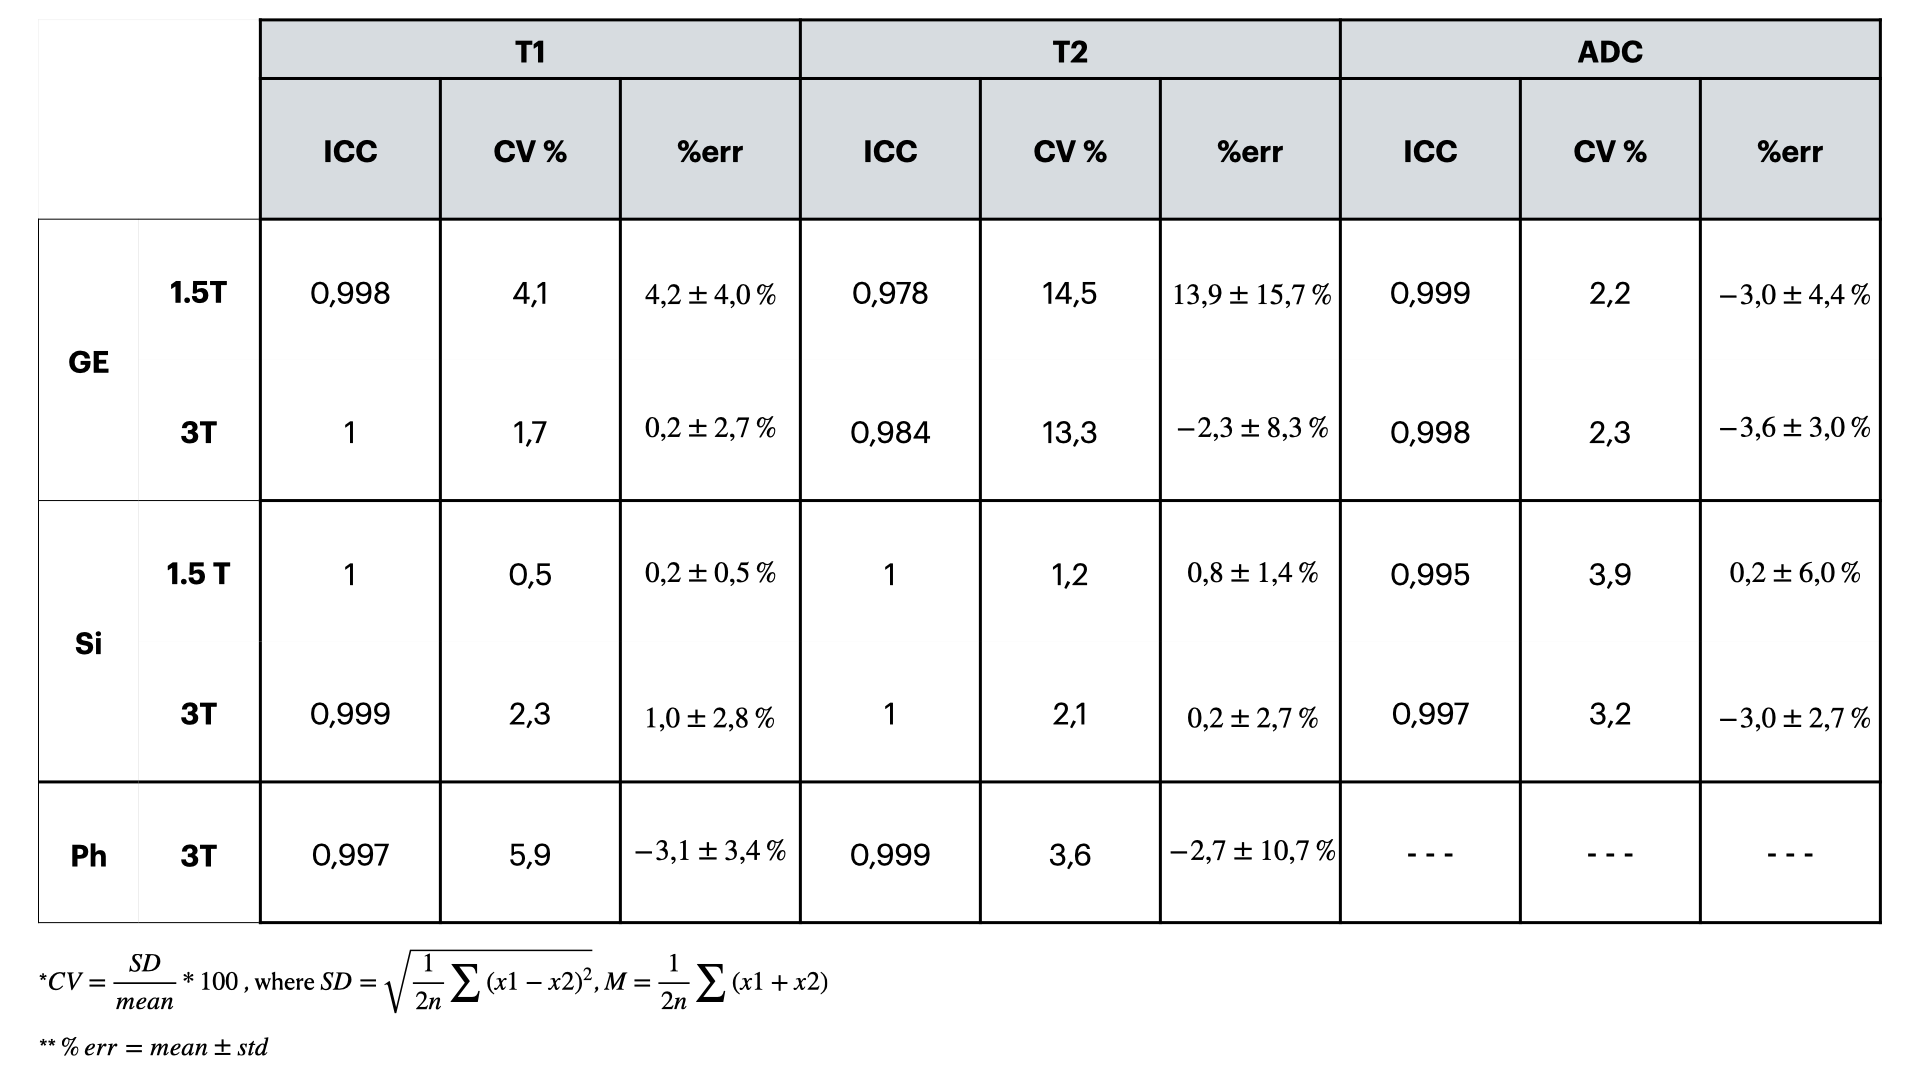
This study comprised 2 GE, 3 Siemens and 1 Philips 3T scanners and 2 GE, 2 Siemens and 1 Philips 1.5T scanners (Table 1). No diffusion data for Philips scanners were collected. T1 data acquired on all Siemens scanners showed a considerable overestimation of the NIST reference values (up to 40% on 3T and up to 20% on 1.5T) for low T1 values. On the contrary all GE scanners showed a non-negligible underestimation (up to 30%) for high T1 values (Figure 2). T2 data acquired on GE scanners underestimated considerably the reference values and the effect was higher with increasing T2 values (up to 60% for the highest value). T2 values on Philips scanner at 1.5T also showed an underestimation. On the other hand, T2 data acquired on Siemens 3T scanners showed an overestimation of the reference values that increases for low values of T2 (up to 70% for the lowest value). This trend is no longer visible on the 1.5T scanners where only one scanner shows an overestimation of the highest T2 value (Figure 2). ADC measured data were consistent with reference values for all vendors (Figure 2). Data acquired on 3T scanners were more reproducible than those acquired on 1.5T scanners independently on vendors. T2 data reproducibility was lower for GE scanners (with CV up to 14% for 1.5T and 13% for 3T) compared to the other vendors (CV<4% in all cases). T1 and ADC data were reproducible independently on vendors and field strength (ICC ≥ 0.995 and CV< 4% in all cases except for Philips where T1 CV was about 6%) (Figure 3, Table 2).Discussion
Our study shows that multicenter MRI data obtained using the NIST approved protocol are comparable for each vendor, while non-negligible discrepancies can be found across vendors, especially for T1 and T2 measurements. ADC results show good comparability across sites, vendors and field strength, in line with the findings from a previous study5. While most previous multicenter harmonization studies on the NIST phantom have focused on T16,7, this study investigated the reproducibility of multiparametric MRI across vendors. This study has few limitations to acknowledge. MRI data were not corrected by temperature, which may account for some data mismatch. Moreover, B0 and B1 values could be included in T1 and T2 fitting to correct for possible scanner differences. Finally, reproducibility across vendors was assessed on different numbers of scanners, and additional data are needed to confirm current results.Conclusion
These findings provide additional evidence in favor of the need of MRI harmonization across vendors, especially for T1 and T2 measurements, to allow reliable multicenter MRI studies and ultimate transfer of MRI biomarkers to clinical practice.Acknowledgements
This study was supported by the Italian Ministry of Health, the Innovation Fund Denmark, the German Federal Ministry of Education and Research (BMBF, funding code 01KU2102) and the Gobierno de Navarra under the framework of ERAPerMed (ERAPERMED 2020-326 - RESPECT).References
1. deSouza NM, Achten E, Alberich-Bayarri A, et al. Validated imaging biomarkers as decision-making tools in clinical trials and routine practice: current status and recommendations from the EIBALL subcommittee of the European Society of Radiology (ESR). Insights Imaging 2019; 10(1):87
2. Stupic KF, Ainslie M, Boss MA, et al. A standard system phantom for magnetic resonance imaging. Magn Reson Med. 2021;86:1194-1211.
3. https://qibawiki.rsna.org/images/6/63/QIBA_DWIProfile_Consensus_Dec2019_Final.pdf
4. Keenan KE, Stupic KF, Russek SE, Mirowski E. MRI-visible liquid crystal thermometer. Magn Reson Med. 2020;00:1–12.
5. van Houdt PJ, Kallehauge JF, Tenderup K, Nout R, Zaletelj M, Tadic T, et al. Phantom-based quality assurance for multicenter quantitative MRI in locally advanced cervical cancer. Radiother Oncol. 2020;153:114-121
6. Keenan KE, Gimbutas Z, Dienstfrey A, Stupic KF, Boss MA, Russek SE, et al. (2021) Multi-site, multi-platform comparison of MRI T1 measurement using the system phantom. PLoS ONE 16(6): e0252966.
7. Bane O, Hectors SJ, Wagner M, Arlinghaus LL, Aryal MP, Cao Y, et al. Accuracy, repeatability, and interplatform reproducibility of T1 quantification methods used for DCE-MRI: Results from a multicenter phantom study. Magn Res Med 2018; 79(5):2564–75.
Figures