5094
Test-Retest Repeatability of Smart BrainQuant (STAGE) of the healthy brain at 1.5T1Neusoft Medical Systems Co., Ltd., Shanghai, China, 2Department of Radiology, Affiliated Zhejiang Hospital, Zhejiang University School of Medicine, Hangzhou, China
Synopsis
Keywords: Stroke, Screening
Smart BrainQuant, adapted from strategically acquired gradient echo (STAGE) method, is capable to provide 10 multi-contrast and multi-quantitative images with high image quality in 4:21 minutes at 1.5T. A preclinical validation work was introduced in this study with the aim to assess the test-retest repeatability of T1, proton spin density (PSD), susceptibility, and R2* by recruiting 18 healthy volunteers. Coefficient of variation of T1, PSD, and R2* ranged from 3.3% to 4.1%. Bland-Altman demonstrated that the line of equality is in the 95% confidence interval (CI) of the mean difference for the four maps.
INTRODUCTION
Quantitative MRI (qMRI) imaging is still of challenge to achieve within short acquisition times in the current clinical routine practice, albeit qMRI is ideal to improve the reliability of determining subtle disease changes[1], especially for the brain. In recent years, multi-parametric quantitative MRI methods have received increasing attention, including, Magnetic Resonance Fingerprinting (MRF)[2], MAGnetic resonance Image Compilation (MAGIC)[3], and strategically acquired gradient echo (STAGE)[4]. Owing to their ability to shorten the acquisition time with a single acquisition still acquiring multiple quantitative maps, these methods are appealing for screening for various diseases, especially for multi-center clinical trials. Notably, Smart BrainQuant is one such method that adapted from STAGE method for 1.5T scanners which are still commonly used in clinical practice. Combining the conventional methods and deep learning with complete data fidelity reconstruction, a previous study[5] has demonstrated the potential of Smart BrainQuant to achieve 10 multi-contrast and multi-quantitative maps offering similar image quality comparable to the fully sampled data at 1.5T. Nevertheless, there have been scarce studies evaluating the reliability of the relatively new technique with a sufficient sample size of healthy volunteers. The objective of this study was to assess the test-retest repeatability of four quantitative measurements derived from Smart BrainQuant, i.e. T1 mapping, proton spin density mapping (PSD), quantitative susceptibility mapping (QSM), and R2* mapping.METHODS
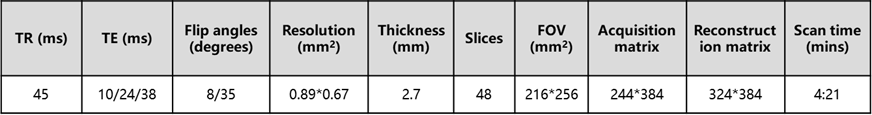
Data acquisitionIn order to evaluate the repeatability of Smart BrainQuant, two scans (test and retest) of the same subject were planned to perform at an interval of two weeks. Eighteen healthy volunteers (11 females, 7 males, ages=23-27 years) were initially recruited for this study, but two quit the second scan, leading to a total of 34 datasets. All volunteers underwent scanning using one 1.5T scanner (Neusoft Medical Systems, Shenyang, China) with a 16-channel head coil, and the scanning parameters were presented in Fig. 1.
Data processing
To process the data, the enhanced T1W image (T1WE) was used to segment brain tissues (white matter, WM; grey matter, GM; and cerebrospinal fluid, CSF) using the Statistical Parametric Mapping (SPM12) Segmentation pipeline. Deep GM structures such as caudate nucleus (CN), thalamus (THA), putamen (PUT), and globus pallidus (GP)) were firstly normalized to the MNI space and segmented using the AAL3 template in the SPM12 toolbox. The segmented brain tissues and structures from SPM12 were further processed in the Matlab 2021b (The MathWorks, Inc., Natick, MA, USA) to generate corresponding masks. Lastly, T1 relaxation time, PSD, susceptibility, and R2* transverse relaxation rate were computed from the structures of interest on the multi-parametric maps of T1, PSD, QSM, and R2*. Among them, PSD values were normalized to CSF which is assumed to be 100% water.
Statistical analysis
Statistical analysis was conducted for each parameter by computing the mean, standard deviation (SD), and coefficient of variation (CoV = SD / average) to assess test-retest variance. Bland-Altman plots were created to visualize the agreement between test and retest values.
RESULTS
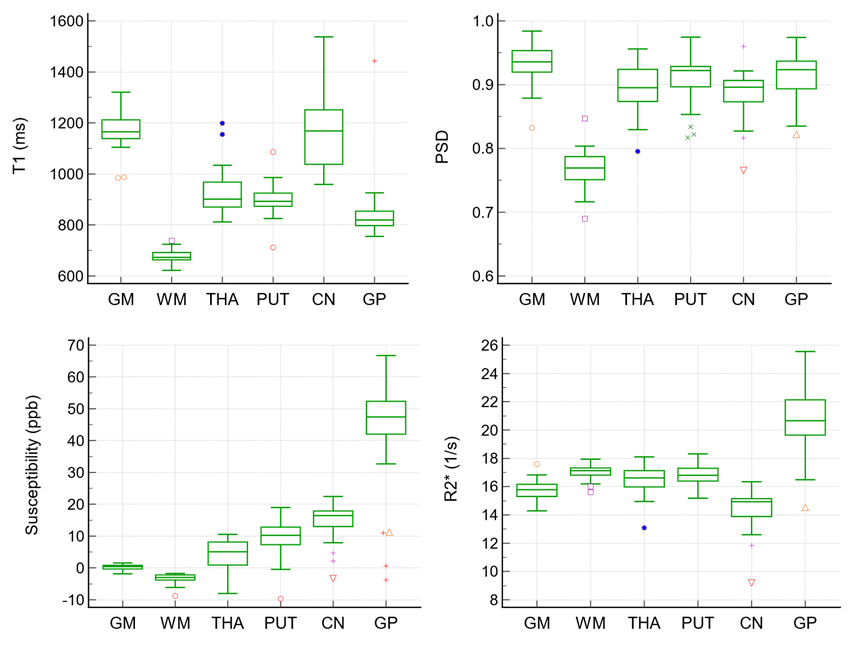
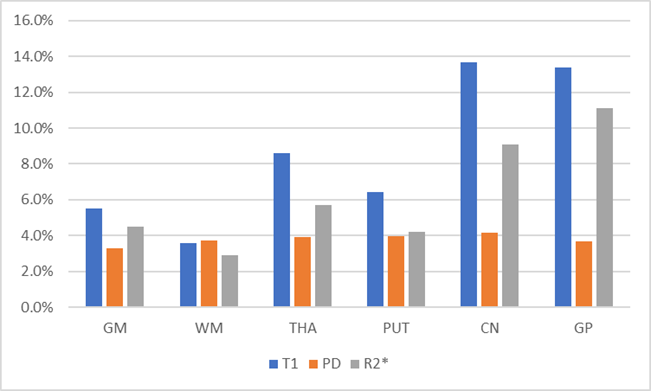
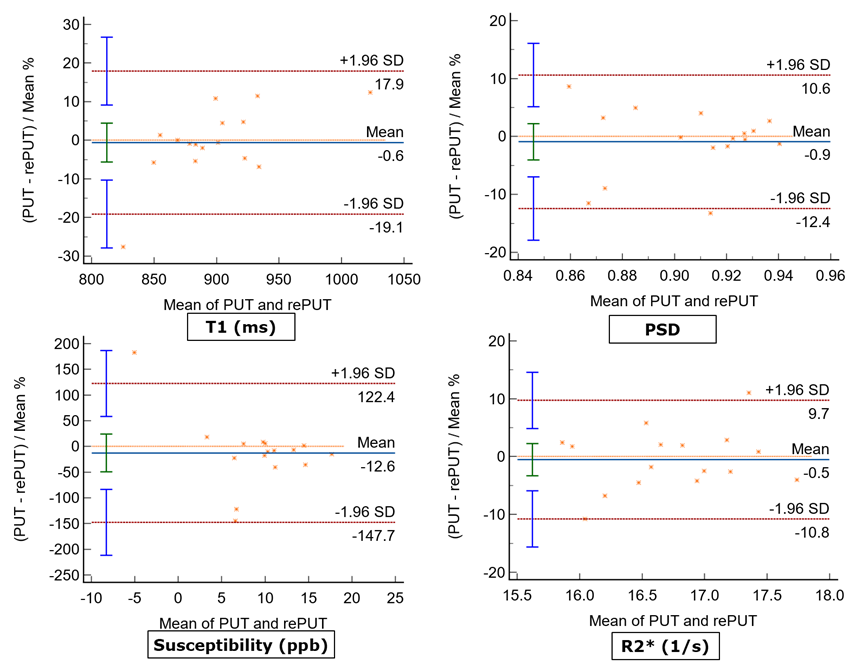
As shown in Fig. 2., the mean and SD values of T1, PSD, susceptibility, and R2* were plotted with Box-Whisker plots, where whiskers are determined by the minimum and maximum values; whereas the line indicates the mean value. Among them, the SD of susceptibility is between 0.7-15.9 ppb. CoVs of T1, PSD, and R2* were presented in Fig. 3 with PSD having the lowest variance across all tissues and structures in a range from 3.3% to 4.1%. WM on T1 and R2* maps demonstrate lower variance when compared to other tissues and structures, i.e. 3.6% and 2.9%, respectively. Fig. 4. displays Bland-Altman plots for the test and retest scan of T1, PSD, susceptibility, and R2* of putamen. The line of equality is in the 95% confidence interval (CI) of the mean difference for the four maps (p= 0.81, 0.54, 0.47, and 0.69).DISCUSSION
The quantitative values calculated from the T1, PSD, QSM, and R2* maps are consistent with those reported in the literature[6–9]. A total of 34 datasets Sixteen pairs of scan-rescan datasets provided a sufficient sample size to evaluate the test-retest repeatability. CoV results are within the acceptable range[4,7]. Moreover, the line of equality is close to the line of mean difference in the Bland-Altman plots, which indicates the bias is not significant[10]. The limitation of this study is that the experiments for the reproducibility of the quantified values are still undergoing, and will be presented in the near future.CONCLUSION
We have demonstrated that Smart BrainQuant provides a fast and reliable scheme for brain qMRI with satisfactory repeatability in quantifying T1, PSD, susceptibility, and R2*. These high repeatability results would encourage further clinical adoption of Smart BrainQuant. This work provides the groundwork to use this method for the early detection of disease using 1.5T as a clinical practice.Acknowledgements
No acknowledgement found.References
[1] Tofts P, Steens SCA. Quantitative MRI of the brain. Measuring changes caused by disease. John Wiley & Sons. 2005.
[2] Ma D, Gulani V, Seiberlich N, Liu K, Sunshine JL, Duerk JL, et al. Magnetic Resonance Fingerprinting. Nature 2013;495:187–92. https://doi.org/10.1038/nature11971.
[3] Tanenbaum LN, Tsiouris AJ, Johnson AN, Naidich TP, DeLano MC, Melhem ER, et al. Synthetic MRI for Clinical Neuroimaging: Results of the Magnetic Resonance Image Compilation (MAGiC) Prospective, Multicenter, Multireader Trial. American Journal of Neuroradiology 2017. https://doi.org/10.3174/ajnr.A5227.
[4] Haacke EM, Chen Y, Utriainen D, Wu B, Wang Y, Xia S, et al. STrategically Acquired Gradient Echo (STAGE) imaging, part III: Technical advances and clinical applications of a rapid multi-contrast multi-parametric brain imaging method. Magnetic Resonance Imaging 2020;65:15–26. https://doi.org/10.1016/j.mri.2019.09.006.
[5] Chen M, Sun A, Xu W, et al. Smart BrainQuant: Ten high quality 3D clinically meaningful contrasts/maps in 6 min on 1.5T using DNN. Proc. Intl. Soc. Mag. Reson. Med. 26 (2019) #2977 https://archive.ismrm.org/2019/2977.html.
[6] Wang Y, Chen Y, Wu D, Wang Y, Sethi SK, Yang G, et al. STrategically Acquired Gradient Echo (STAGE) imaging, part II: Correcting for RF inhomogeneities in estimating T1 and proton density. Magnetic Resonance Imaging 2018;46:140–50. https://doi.org/10.1016/j.mri.2017.10.006.
[7] Pirastru A, Chen Y, Pelizzari L, Baglio F, Clerici M, Haacke EM, et al. Quantitative MRI using STrategically Acquired Gradient Echo (STAGE): optimization for 1.5 T scanners and T1 relaxation map validation. Eur Radiol 2021;31:4504–13. https://doi.org/10.1007/s00330-020-07515-z.
[8] Treit S, Naji N, Seres P, Rickard J, Stolz E, Wilman AH, et al. R2* and quantitative susceptibility mapping in deep gray matter of 498 healthy controls from 5 to 90 years. Hum Brain Mapp 2021;42:4597–610. https://doi.org/10.1002/hbm.25569.
[9] Li X, Chen L, Kutten K, Ceritoglu C, Li Y, Kang N, et al. Multi-atlas tool for automated segmentation of brain gray matter nuclei and quantification of their magnetic susceptibility. NeuroImage 2019;191:337–49. https://doi.org/10.1016/j.neuroimage.2019.02.016.
[10] Giavarina D. Understanding Bland Altman analysis. Biochem Med (Zagreb) 2015;25:141–51. https://doi.org/10.11613/BM.2015.015.
Figures