5093
Long-term QSM reproducibility phantom from a commercially available design1Imaging and Epilepsy, The Florey Institute of Neuroscience and Mental Health, Melbourne, Australia, 2Department of Neurology, Austin Health, Melbourne, Australia, 3Department of Psychiatry, The University of Melbourne, Melbourne, Australia
Synopsis
Keywords: Quantitative Imaging, Quantitative Susceptibility mapping, Reproducible Research
We propose the customization of a commercially-available phantom design to be used for QSM reproducibility research with long-term stability, allowing reproduction of the phantom itself commercially. The proposed phantom is based on master-dilution of Gadolinium in pure water vials, offering long-term stability, with theoretical susceptibility range chosen to match normal tissue and common pathologies in the brain. We evaluate the suitability of the phantom for QSM reproducible research for different sequences, orientation within the scanner and regularization algorithms.INTRODUCTION
QSM validation is challenging but necessary given the vast parameter space of acquisition and pipelines. To this end many QSM-phantom MR studies have been done in experimental settings(1–5).Unlike other quantitative methods like T1-, T2- or Diffusion mapping(6), to date no QSM standardization phantom is available commercially, limiting reproducibility analysis mostly to groups with phantom-design capabilities.
One adverse factor for commercial QSM phantoms is the challenge posed by long-term stability. Gel-based solutions of susceptibility agents (e.g. Gadolinium) can mimic tissue properties well(2,3), and do not have the kind of boundary issues introduced by thick rigid compartments, but do not offer long-term stability of ground-truth parameters(7).
This work aims to demonstrate the possibility of repurposing a commercially available phantom design to be used for QSM, with a view to help democratize long-term reproducibility and standardization studies in QSM.
METHODS - PHANTOM DESIGN
The proposed phantom is adapted from the CaliberMRI Diffusion phantom design (https://qmri.com) and ordered from the same manufacturer as a custom design.A diagram of the phantom is shown in figure 1: 13 vials of 50mL each were filled with different Gd concentrations as shown in the figure by serial dilution, with initial concentration confirmed by Inductively-Coupled-Plasma Mass-Spectrometer.
The concentration range was chosen to cover susceptibility measurements in normal brain tissue and some common pathologies(8). An additional 3 vials of pure water were added for reference and orientation. The vials are held in place by an acrylic plate. The interstitial liquid was pure water.
The phantom also has 10 MR-readable temperature crystal probes ranging from 15°C to 24°C.
METHODS - QSM IMAGING
Imaging was performed on a Siemens 3T Prisma-fit system (Siemens Healthineers, Erlangen, Germany) with two QSM acquisitions tailored for epilepsy cohorts(9):- a 5-echo 3D GRE (5e-GRE) at 1.2mm3 voxels, FOV 230x187x144mm, TE1/DTE/TR=5.84/4.79/30ms, FA 15°, GRAPPA 3 in-plane acceleration, (acquisition time 3:39 min)
- a 6-echo 3D GRE (6e-GRE) at 1.3 mm3, FOV 208x182x136mm, TE1/DTE/TR=5.38/4.15/30ms, GRAPPA 2 in-plane acceleration.
METHODS – QSM COMPUTATION
Muti-echo GRE data was analyzed with the MEDI+0 method(10), over a mask of the whole phantom-sphere. Each Gd-solution, pure water and acrylic plate (AcP) region was segmented by k-means clustering and connectivity analysis from the magnitude-image averaged across echoes.The AcP region was used as an L2-regularization uniformity-penalty and zero-referencing region(10). The pure-water region for zero-reference and uniformity-penalty was also used for comparison, as well as the MEDI algorithm with no zero-reference(11,12).
The upper half of each vial was excluded in the ROI analysis due to their complex geometry close to the cap.
RESULTS
The built-in thermometric probes indicated a phantom temperature between 20°C and 21°C for all imaging experiments. Example QSM maps for the different imaging setting are shown in figure 2. At perpendicular B0 orientation, streaking boundary artifacts are visible close to the vial walls. As expected from theory(1), these artifacts are noticeably reduced when orientation is parallel to the field. Discounting orientation and resolution differences, 5e-GRE and 6e-GRE produced very similar maps regardless of field orientation.The mean QSM values measured in vial ROIs are analyzed in figure 3. Both sequences were in good-agreement within a +/-0.047ppm 95%CI and a slight bias of -0.01ppm. For test-retest analysis of the same sequence, the difference CI increased to +/-0.078. These results appeared to be mostly driven by the vials corresponding to pathological tissue ranges (0.25-0.93ppm).
All experiments yielded excellent linear fits with r2 > 0.996, with r the Pearson coefficient. However, the slope of the fit, corresponding to the molar susceptibility of Gd in water, was noticeably different between field orientations, dropping from 301 ppm.M-1 parallel to the field to 255 ppm.M-1, against a theoretical molar susceptibility of 320 ppm.M-1(1).
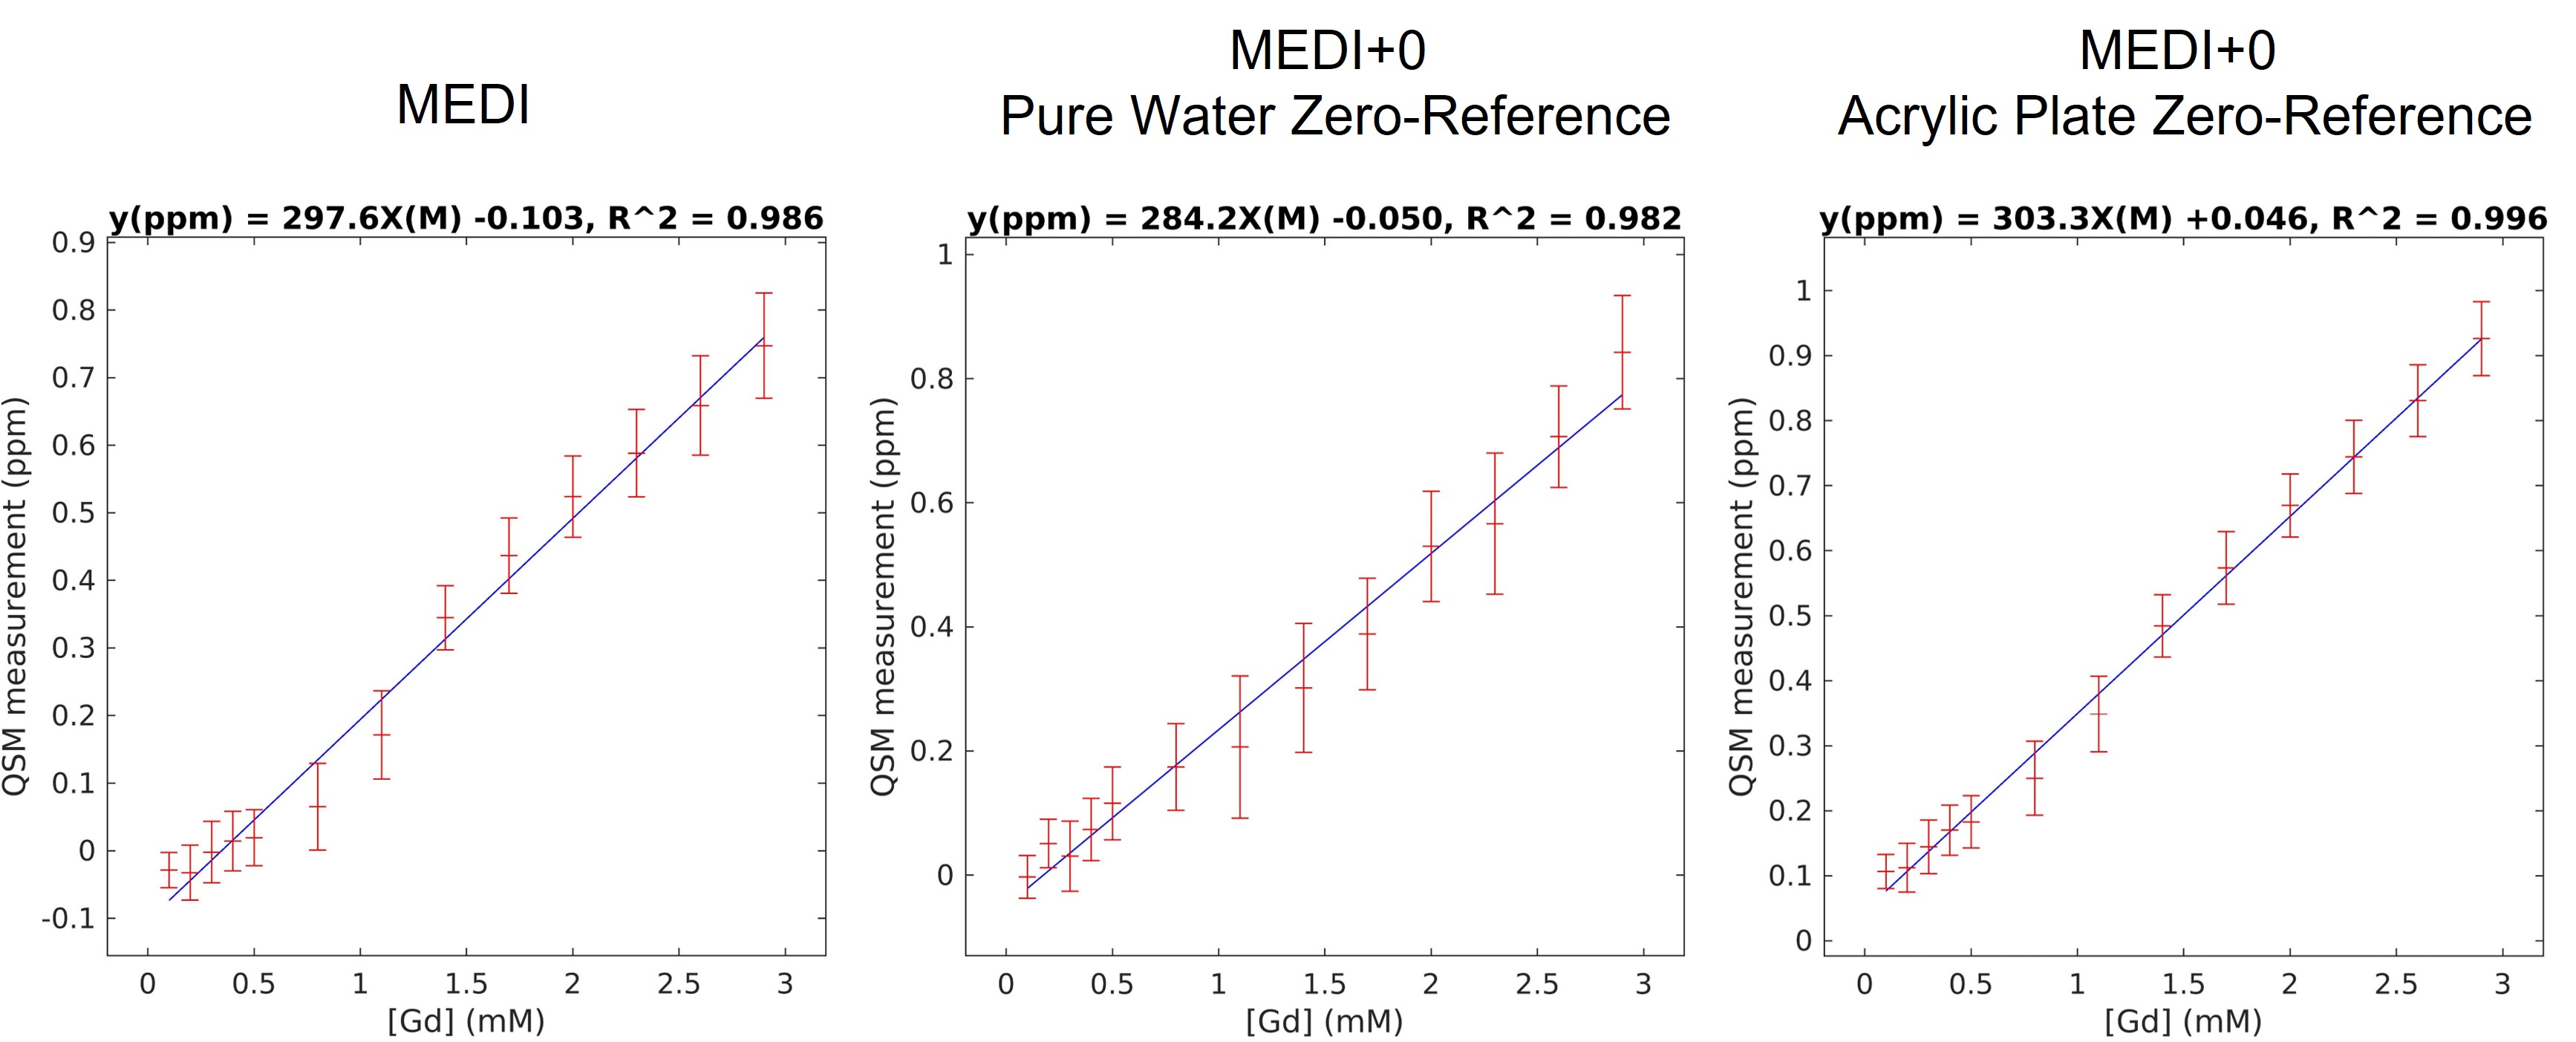
Comparison between the MEDI and MEDI+0 algorithms are shown in figure 4. While all regressions had r2 >0.98, the regression coefficients yielded a Gd-molar-susceptibility < 300 ppm.M-1 without a zero-reference, or by using pure-water as zero-reference. By comparison, the AcP-region zero-reference had improved r2 and a measured molar susceptibility closer to theoretical value.
Discussion and Conclusion
The standard deviation within ROIs indicated a slight overlap of measured susceptibility from one vial to the next, suggesting that the phantom design could be optimized by increasing the concentration-step between vials. Regardless, the proposed phantom achieved excellent linear fitting of mean susceptibility values against known concentrations of Gd-solutions (r2>0.996).Interestingly, using an Acrylic Plate mask for zero-referencing and uniformity regularization appeared to noticeably improve QSM regression with MEDI+0 over MEDI with no regularization, while pure-water zero-referencing had the opposite effect.
With vials parallel to the field, values appeared very stable against change in number of echoes and voxel size, with detected Molar Susceptibility close to the theoretical value, with a slight underestimation bias which remains to be investigated. The 95%CI in test-retest analyses were mostly driven by large Gd concentrations, but an order of magnitude less than the ranges themselves, indicating suitability for neuroimaging studies.
Finally, the proposed customized phantom is commercially-available, making it easily replicable. The water-based Gd solution yielded good agreement to theoretical measurements while offering long-term stability of ground-truth susceptibility parameters.
Acknowledgements
We acknowledge the facilities and scientific and technical assistance of the National Imaging Facility, a National Collaborative Research Infrastructure Strategy (NCRIS) capability, at The Florey Institute of Neuroscience and Mental Health. We also acknowledge the strong support from the Victorian Government and in particular the funding from the Operational Infrastructure Support Grant, and support from the Victorian Biomedical Imaging Capability (VBIC). The Australian Epilepsy Project received funding from the Australian Government under the Medical Research Future Fund.
The authors would also like to thank William Hollander, Todor Karaulanov and Chamni Jayarathna for valuable input to this project, and Remika Mito and Lea Vinokur for help with editing this abstract.
References
1. Olsson E, Wirestam R, Lind E. MRI-Based Quantification of Magnetic Susceptibility in Gel Phantoms: Assessment of Measurement and Calculation Accuracy. Radiol Res Pract 2018;2018:1–13 doi: 10.1155/2018/6709525.
2. Kato H, Kuroda M, Yoshimura K, et al. Composition of MRI phantom equivalent to human tissues. Med Phys 2005;32:3199–3208 doi: 10.1118/1.2047807.
3. Hattori K, Ikemoto Y, Takao W, et al. Development of MRI phantom equivalent to human tissues for 3.0-T MRI. Med Phys 2013;40 doi: 10.1118/1.4790023.
4. Deh K, Kawaji K, Bulk M, et al. Multicenter reproducibility of quantitative susceptibility mapping in a gadolinium phantom using MEDI+0 automatic zero referencing. Magn Reson Med 2019;81:1229–1236 doi: 10.1002/mrm.27410.
5. Hobson N, Polster SP, Cao Y, et al. Phantom validation of quantitative susceptibility and dynamic contrast-enhanced permeability MR sequences across instruments and sites. Journal of Magnetic Resonance Imaging 2020;51:1192–1199 doi: 10.1002/jmri.26927.
6. Stupic KF, Ainslie M, Boss MA, et al. A standard system phantom for magnetic resonance imaging. Magn Reson Med 2021;86:1194–1211 doi: 10.1002/mrm.28779.
7. Er WX, Lim WJ, Dwihapsari Y, Awang MNA, Yusoff AN. Signal-to-noise ratio uniformity and stability of agar gel phantom with iron (III) oxide as relaxation modifier. Beni Suef Univ J Basic Appl Sci 2021;10 doi: 10.1186/s43088-021-00173-0.
8. Girard R, Fam MD, Zeineddine HA, et al. Vascular permeability and iron deposition biomarkers in longitudinal follow-up of cerebral cavernous malformations. J Neurosurg 2017;127:102–110 doi: 10.3171/2016.5.JNS16687.
9. The Australian Epilepsy Project, https://epilepsyproject.org.au.
10. Liu Z, Spincemaille P, Yao Y, Zhang Y, Wang Y. MEDI+0: Morphology enabled dipole inversion with automatic uniform cerebrospinal fluid zero reference for quantitative susceptibility mapping. Magn Reson Med 2018;79:2795–2803 doi: 10.1002/mrm.26946.
11. Liu T, Xu W, Spincemaille P, Avestimehr AS, Wang Y. Accuracy of the morphology enabled dipole inversion (MEDI) algorithm for quantitative susceptibility mapping in MRI. IEEE Trans Med Imaging 2012;31:816–824 doi: 10.1109/TMI.2011.2182523.
12. Liu T, Wisnieff C, Lou M, Chen W, Spincemaille P, Wang Y. Nonlinear formulation of the magnetic field to source relationship for robust quantitative susceptibility mapping. Magn Reson Med 2013;69:467–476 doi: 10.1002/mrm.24272.
Figures
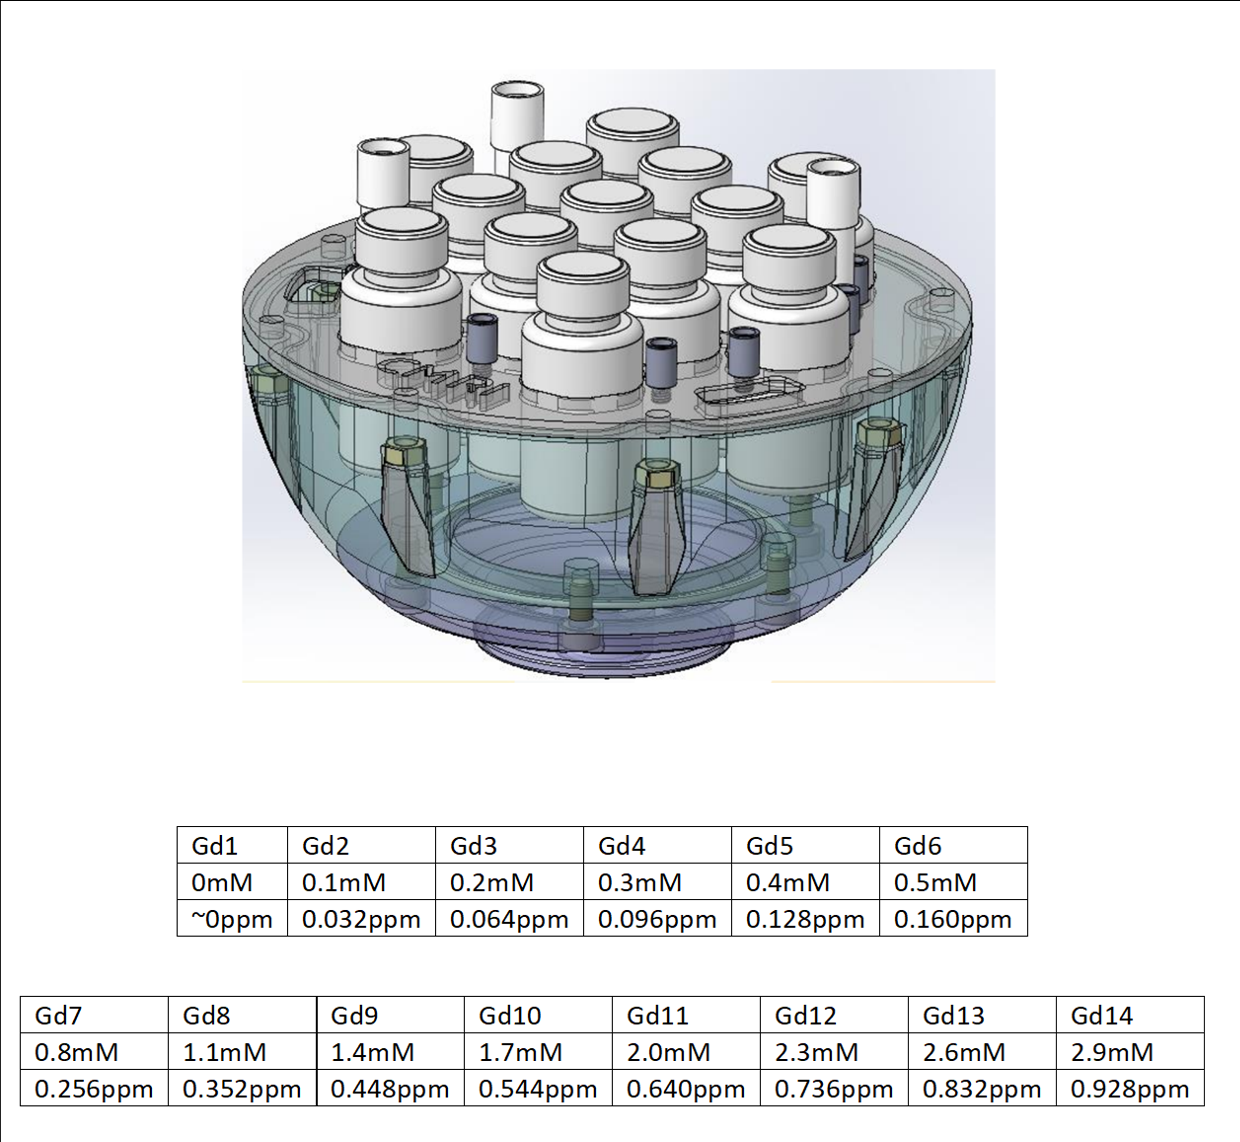
Figure 1 - Phantom Design (without upper hemisphere for visualization) and [Gd] tables. Tables show expected apparent susceptibility for range of normal (top table) and abnormal brain tissue (bottom table).
IP rights to the design belong to CaliberMRI (qmri.com).
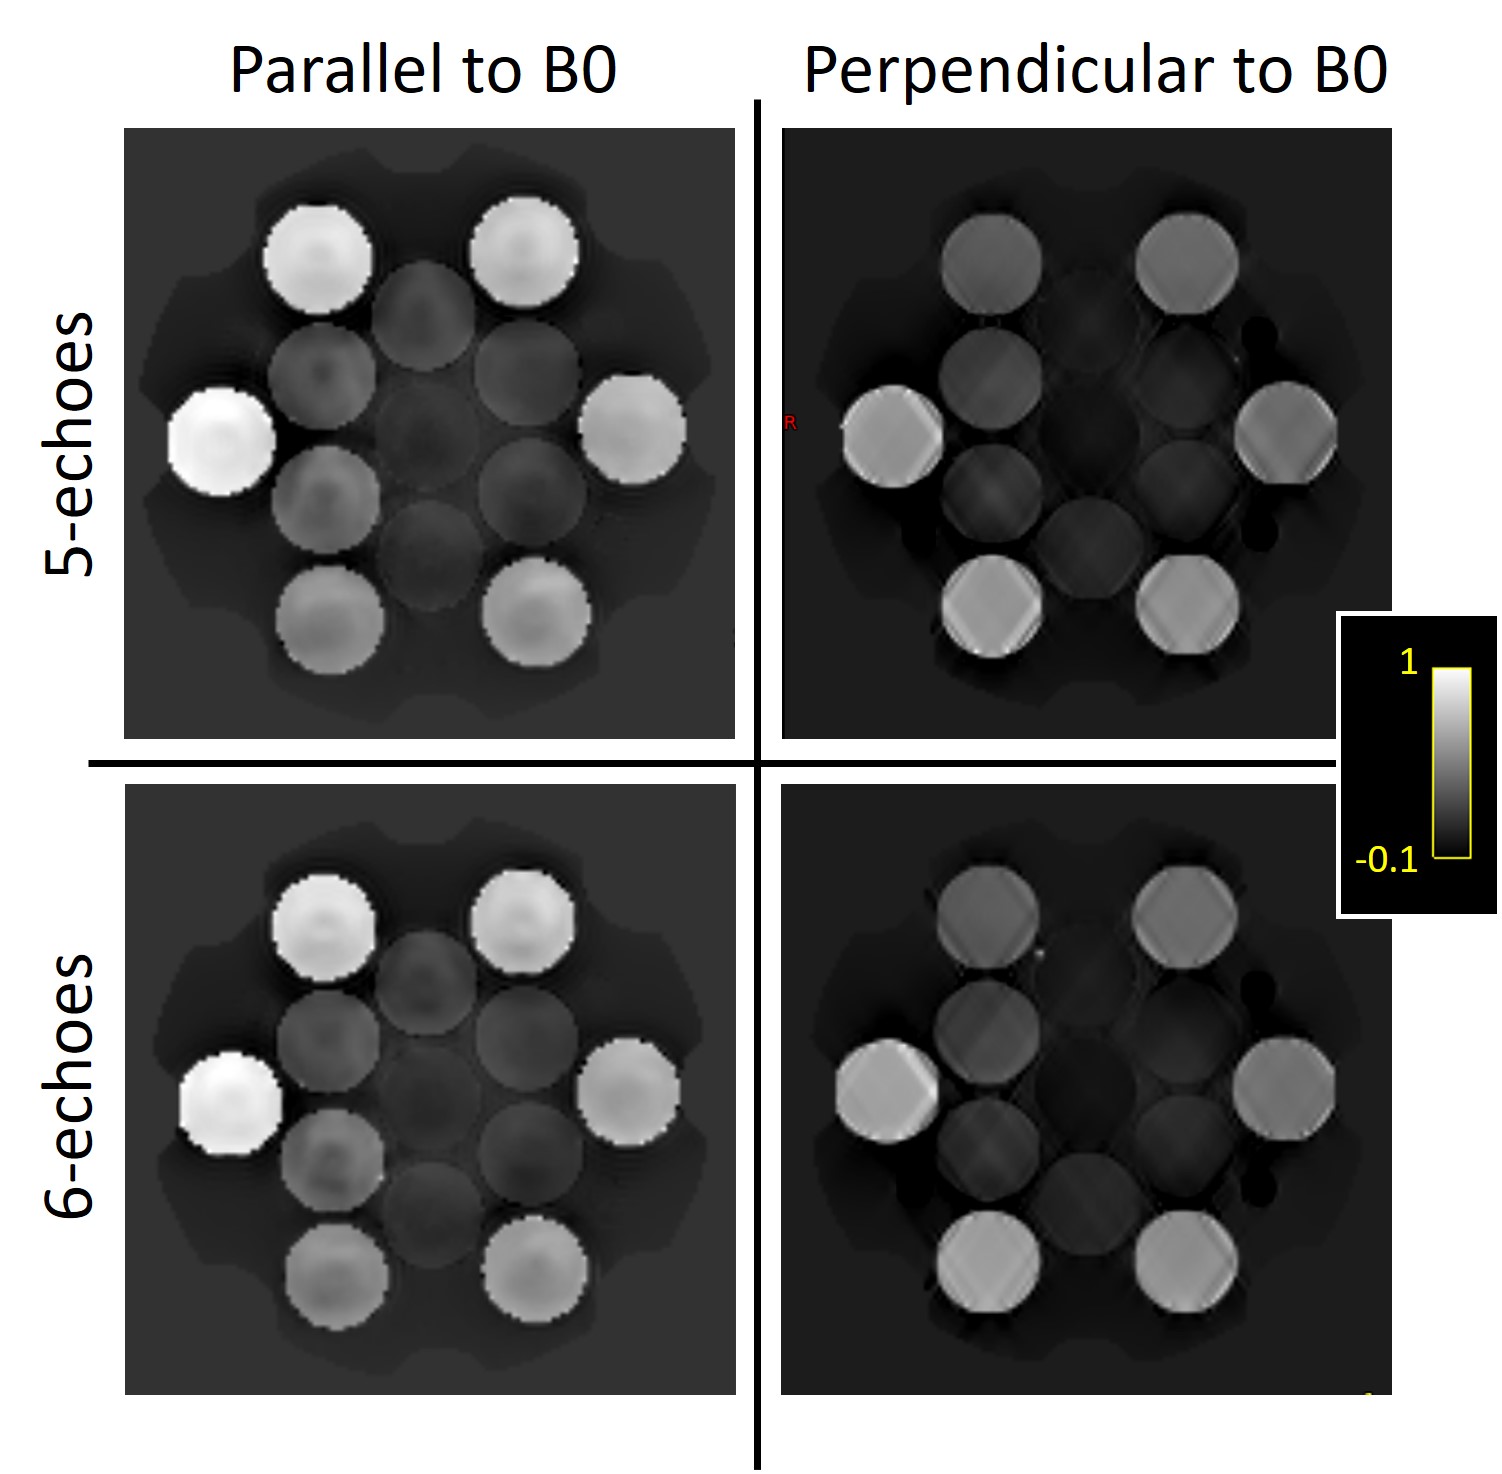
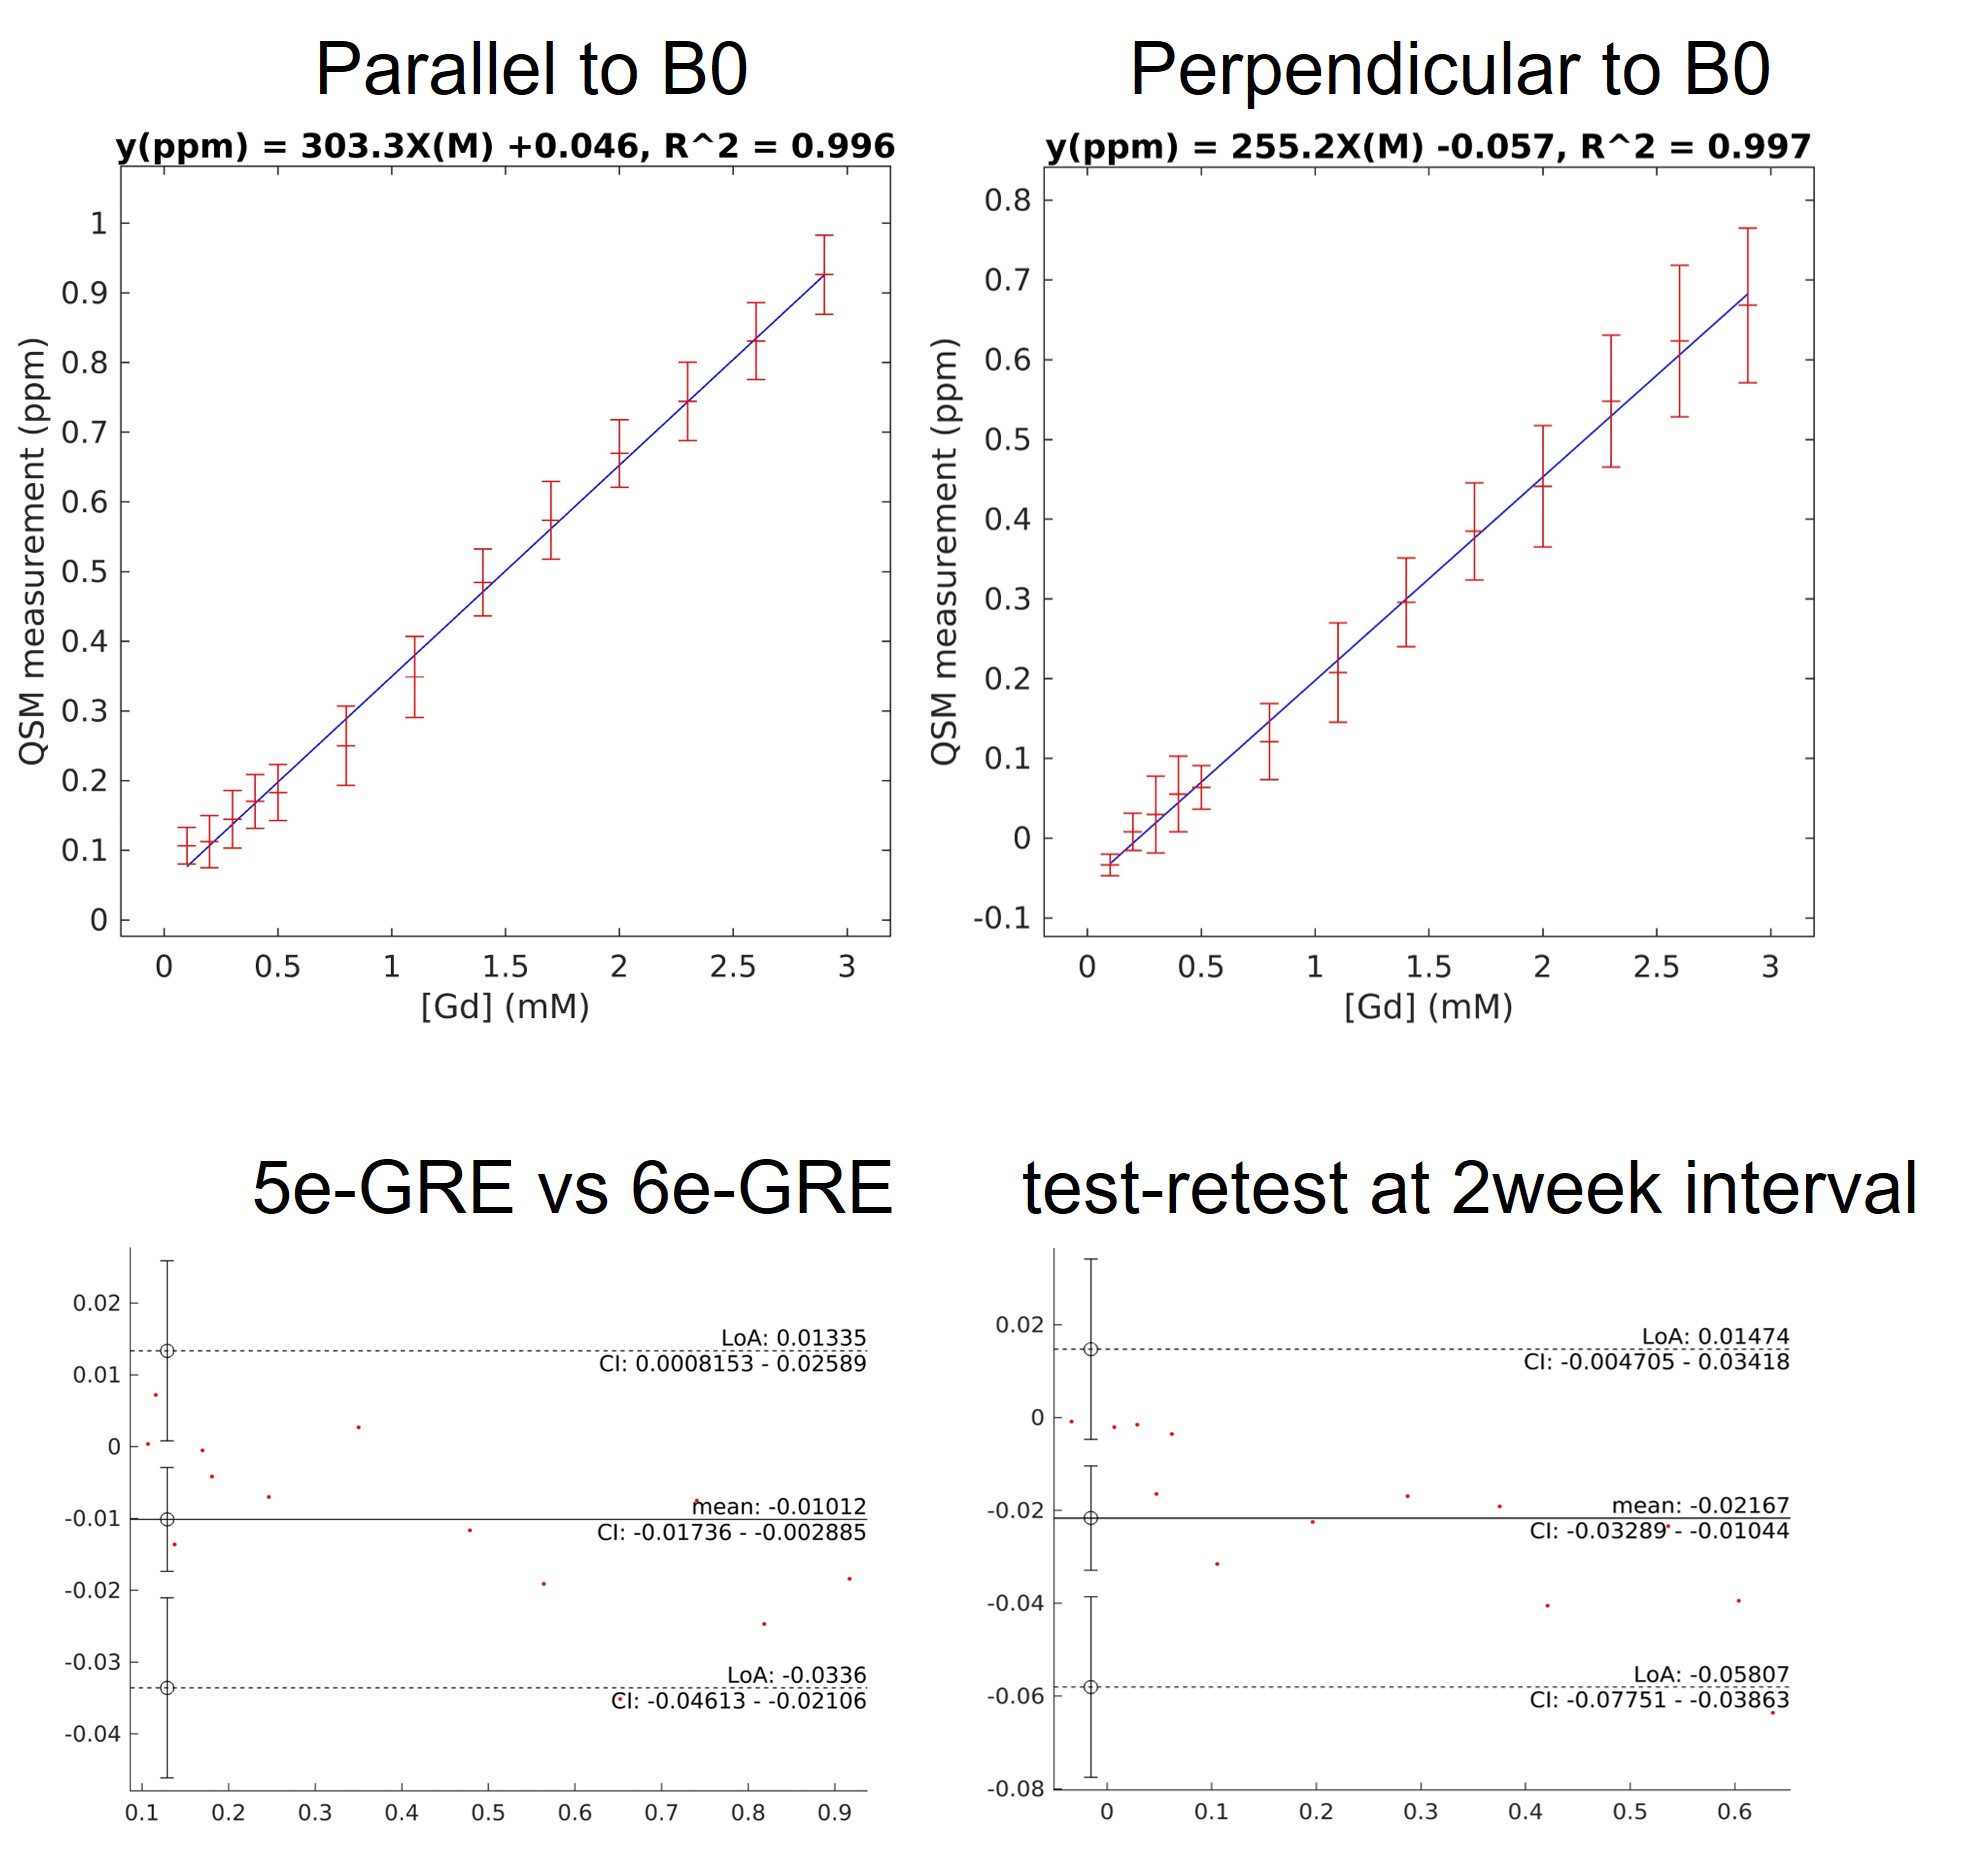
Figure 3 -Top: Mean QSM values for each Gd-solution vial against [Gd] with vials parallel to B0 (left) and perpendicular to B0 (right) with 5e-GRE. Standard deviation within each ROI is displayed as error bar. Regression coefficients displayed at the top of the graph.
Bottom: Bland-Altman plots between 5echo and 6echo acquisitions parallel to B0 (left), and test-retests at 2 week interval perpendicular to B0 (right).