5092
Reproducibility of Whole-Body Variable Flip Angle T1 Mapping Using Only Two Flip Angles1Department of Medical Physics & Biomedical Engineering, University College London, London, United Kingdom, 2Centre for Medical Imaging, University College London, London, United Kingdom, 3Centre for Medical Image Computing, University College London, London, United Kingdom, 4King's Technology Evaluation Centre, King's College London, London, United Kingdom
Synopsis
Keywords: Quantitative Imaging, Whole Body, T1-mapping
We investigate the feasibility of whole-body (WB) variable flip angle (VFA) T1 mapping using linear least squares fitting with only two flip angles (FAs) in order to obtain WB T1 maps within a clinically viable timeframe. This could enable its use as an imaging biomarker in metastatic cancer. We assessed the agreement across eight subjects in a variety of abdominal tissues between T1 estimates fitted using eight FAs and just 2 FAs. We found that VFA T1 mapping can be achieved by acquiring only two FAs with minimal loss to precision, providing the lower FA is between 2.5° and 7.5°.Introduction
Assessing the response to new cancer agents is challenging for conventional imaging methods that rely upon evaluation of size changes as a marker of response. Alternative methods of assessing drug efficacy are necessary. One possibility is T1 mapping, as T1 relaxation time is known to differ between tumour and benign tissue. Moreover, changes in this quantity have been observed in cancers during therapy1–3. Variable flip angle (VFA) T1 mapping4–6 is a rapid quantitative T1 measurement technique widely used to acquire 3D T1 maps of the whole-brain in a clinically feasible time. VFA estimates T1 values by acquiring multiple spoiled gradient echo acquisitions, each with different excitation flip angles (FAs), which can then be used to derive a T1 map via linear least squares (LLS) fitting.Due to the large area of coverage in whole-body (WB) examinations for diseases like metastatic cancer, it is usually necessary to acquire a minimum of three anatomical stations, depending on the size of the field of view (FoV). Typically, 8-10 FAs are acquired for each anatomical station in VFA examinations, although in the brain it has been shown that this can be reduced to just two7,8. While T1 mapping has been studied extensively in the brain9–12 and the heart13–16, abdominal T1 quantitation poses unique challenges. Namely respiratory motion, and the need for a large field of view (FOV) coverage. As a result, obtaining reliable abdominal T1 maps within a time-frame acceptable to patients has to date not been reported. In order to obtain WB T1 maps within a clinically viable timeframe, we investigate the feasibility of estimating T1 maps in the abdomen using LLS fitting with only two FAs.
Method
Study DesignEight healthy subjects underwent three WB test-retest VFA mDixon sequences on a Philips 3T Ingenia: voxel size 2.56 × 2.56 × 5 mm, TR = 4 ms, TE = 1.15 ms and 2.3 ms, matrix size 192 × 192 × 120, with breath holds. Eight FAs were collected (2.5°, 5°, 7.5°, 10°, 12.5°, 15°, 17.5°, 20°) at each anatomical station. Transmit RF amplitude (B1) maps were collected for each FoV in order to perform B1 correction on the mDixon data: voxel size 5.13 x 5.13 x 3 mm, TR = 20 and 100 ms, TE= 2.8 ms, FA=60, matrix size 96 × 96 × 100, no breath holds.
Image Analysis
T1 maps were calculated from B1 corrected in phase images using LLS fitting. Maps calculated from all eight FAs were then used as a reference point to compare maps calculated from just two. Regions of interest (ROIs) were drawn in a variety of tissues, the summary statistics of which can be seen in Table 1, along with those of a second study for comparison. For each tissue studied, a single ROI was drawn in the acquisition plane of each of the 24 scans (8 subjects, each with 3 test-retest examinations).
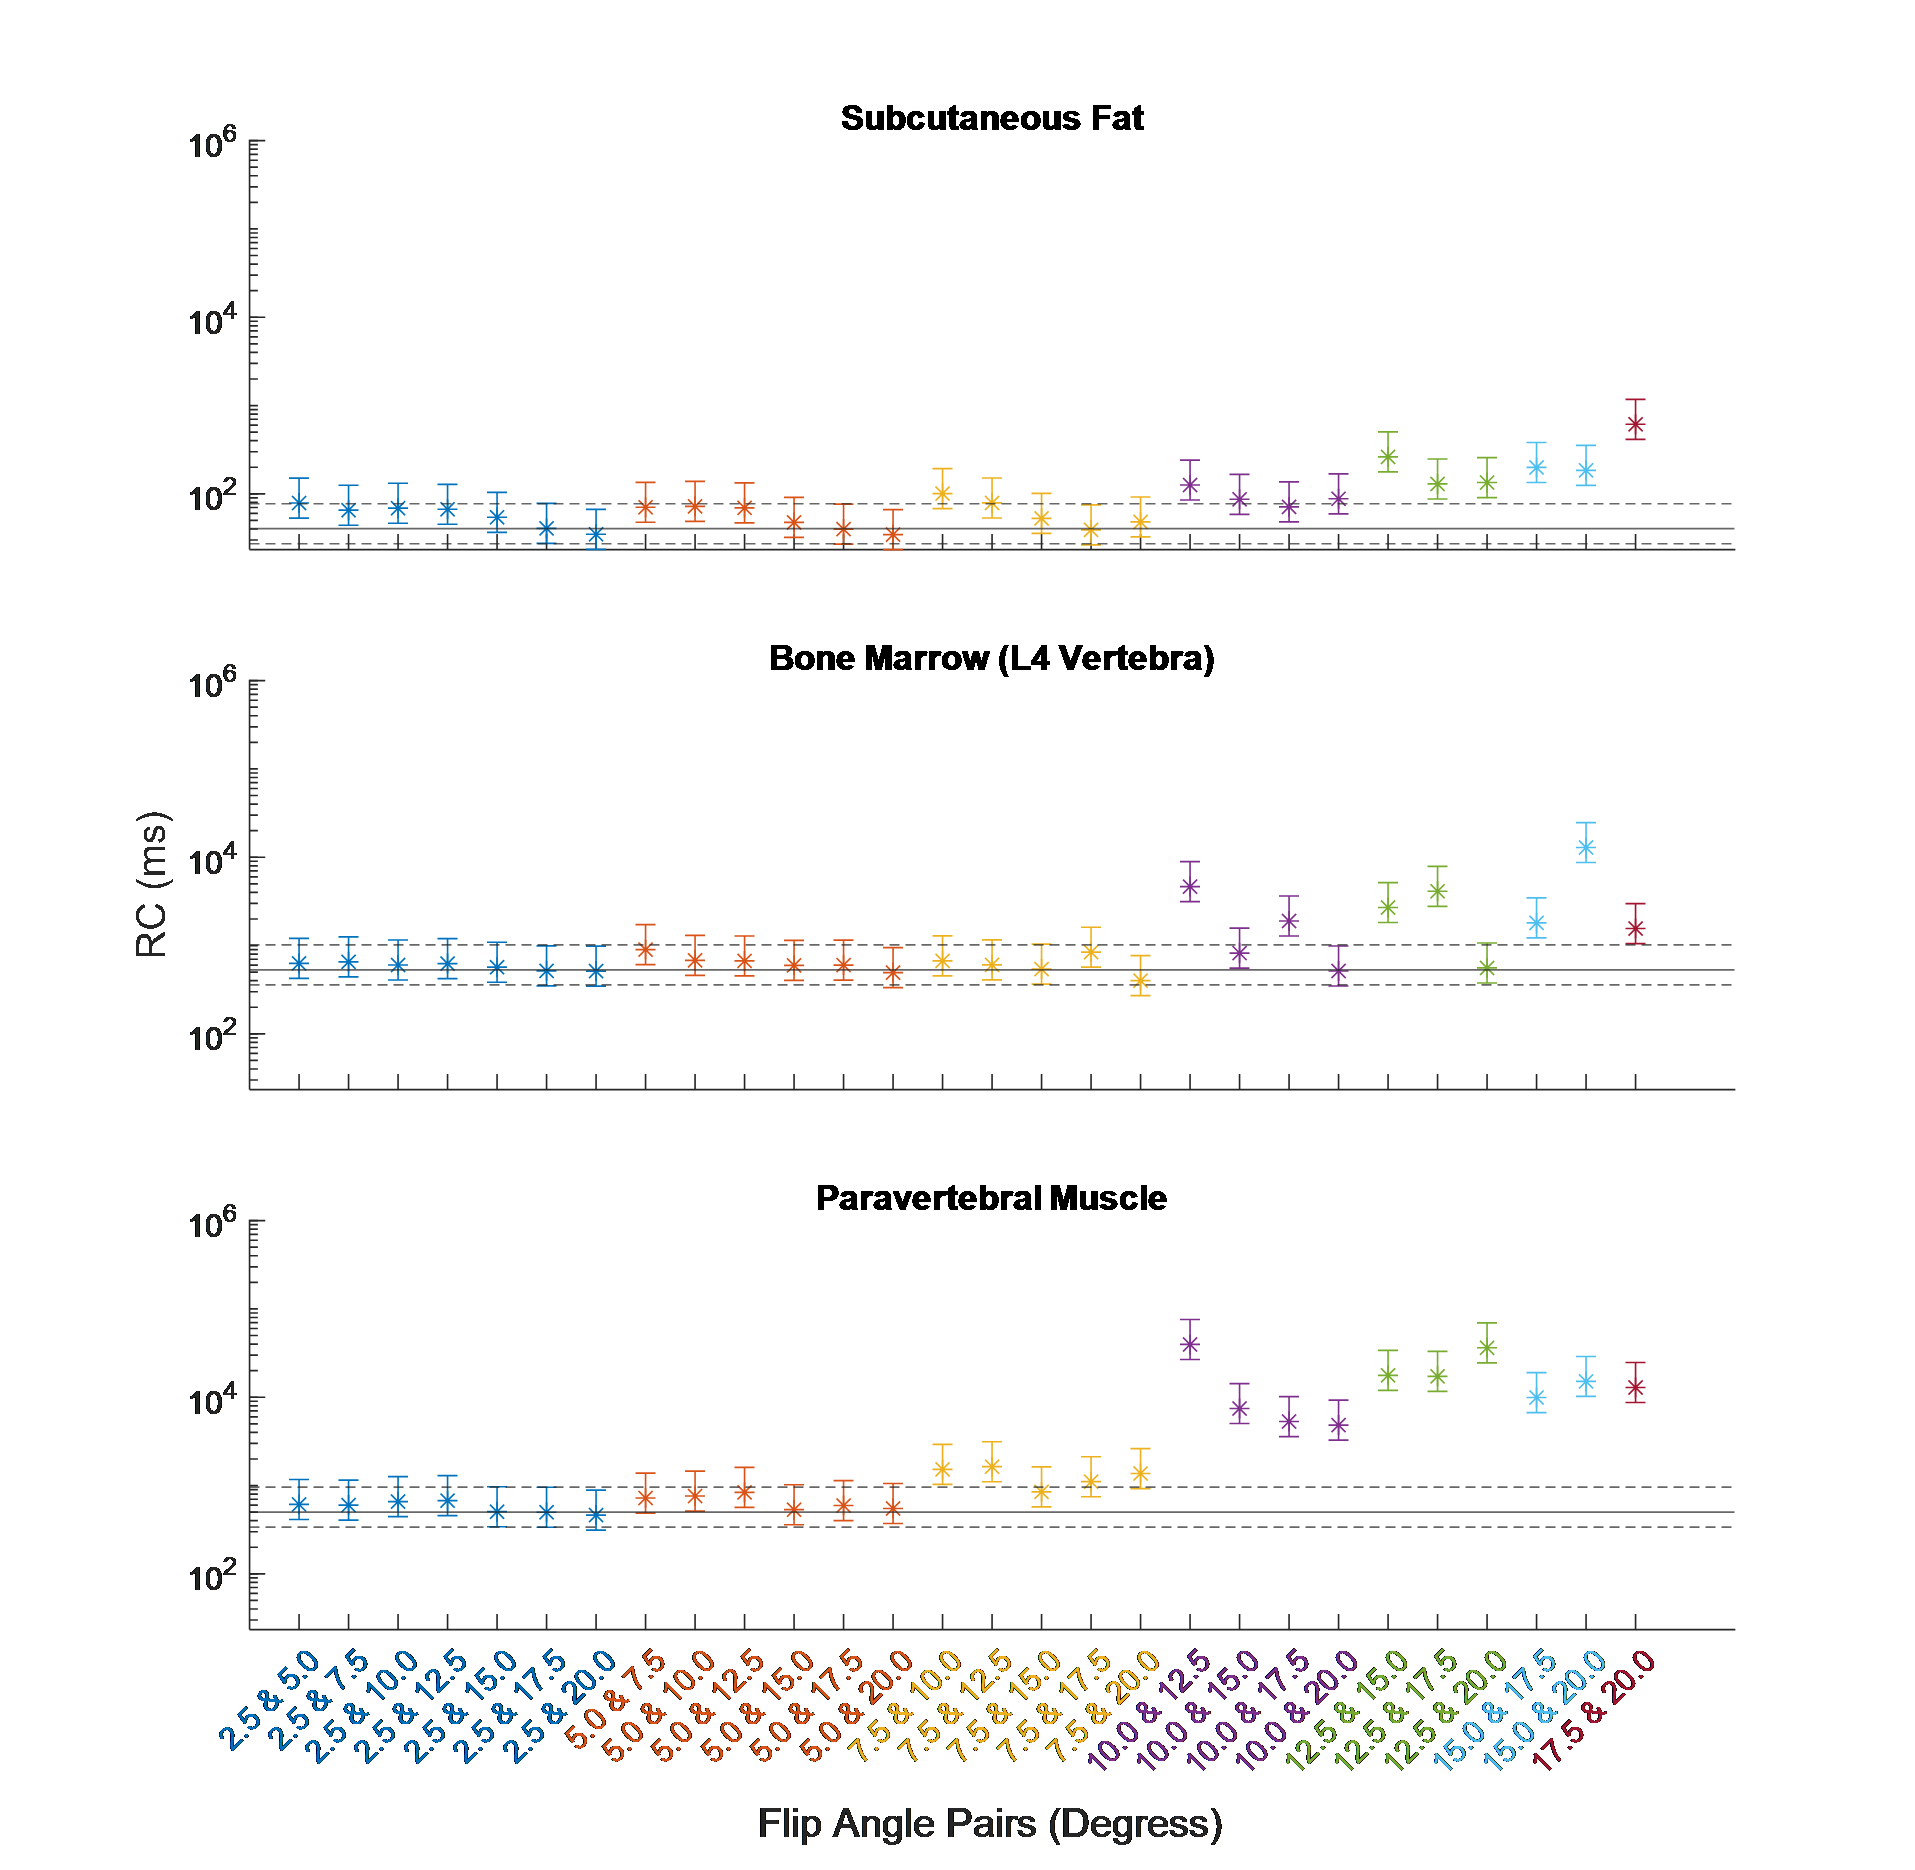
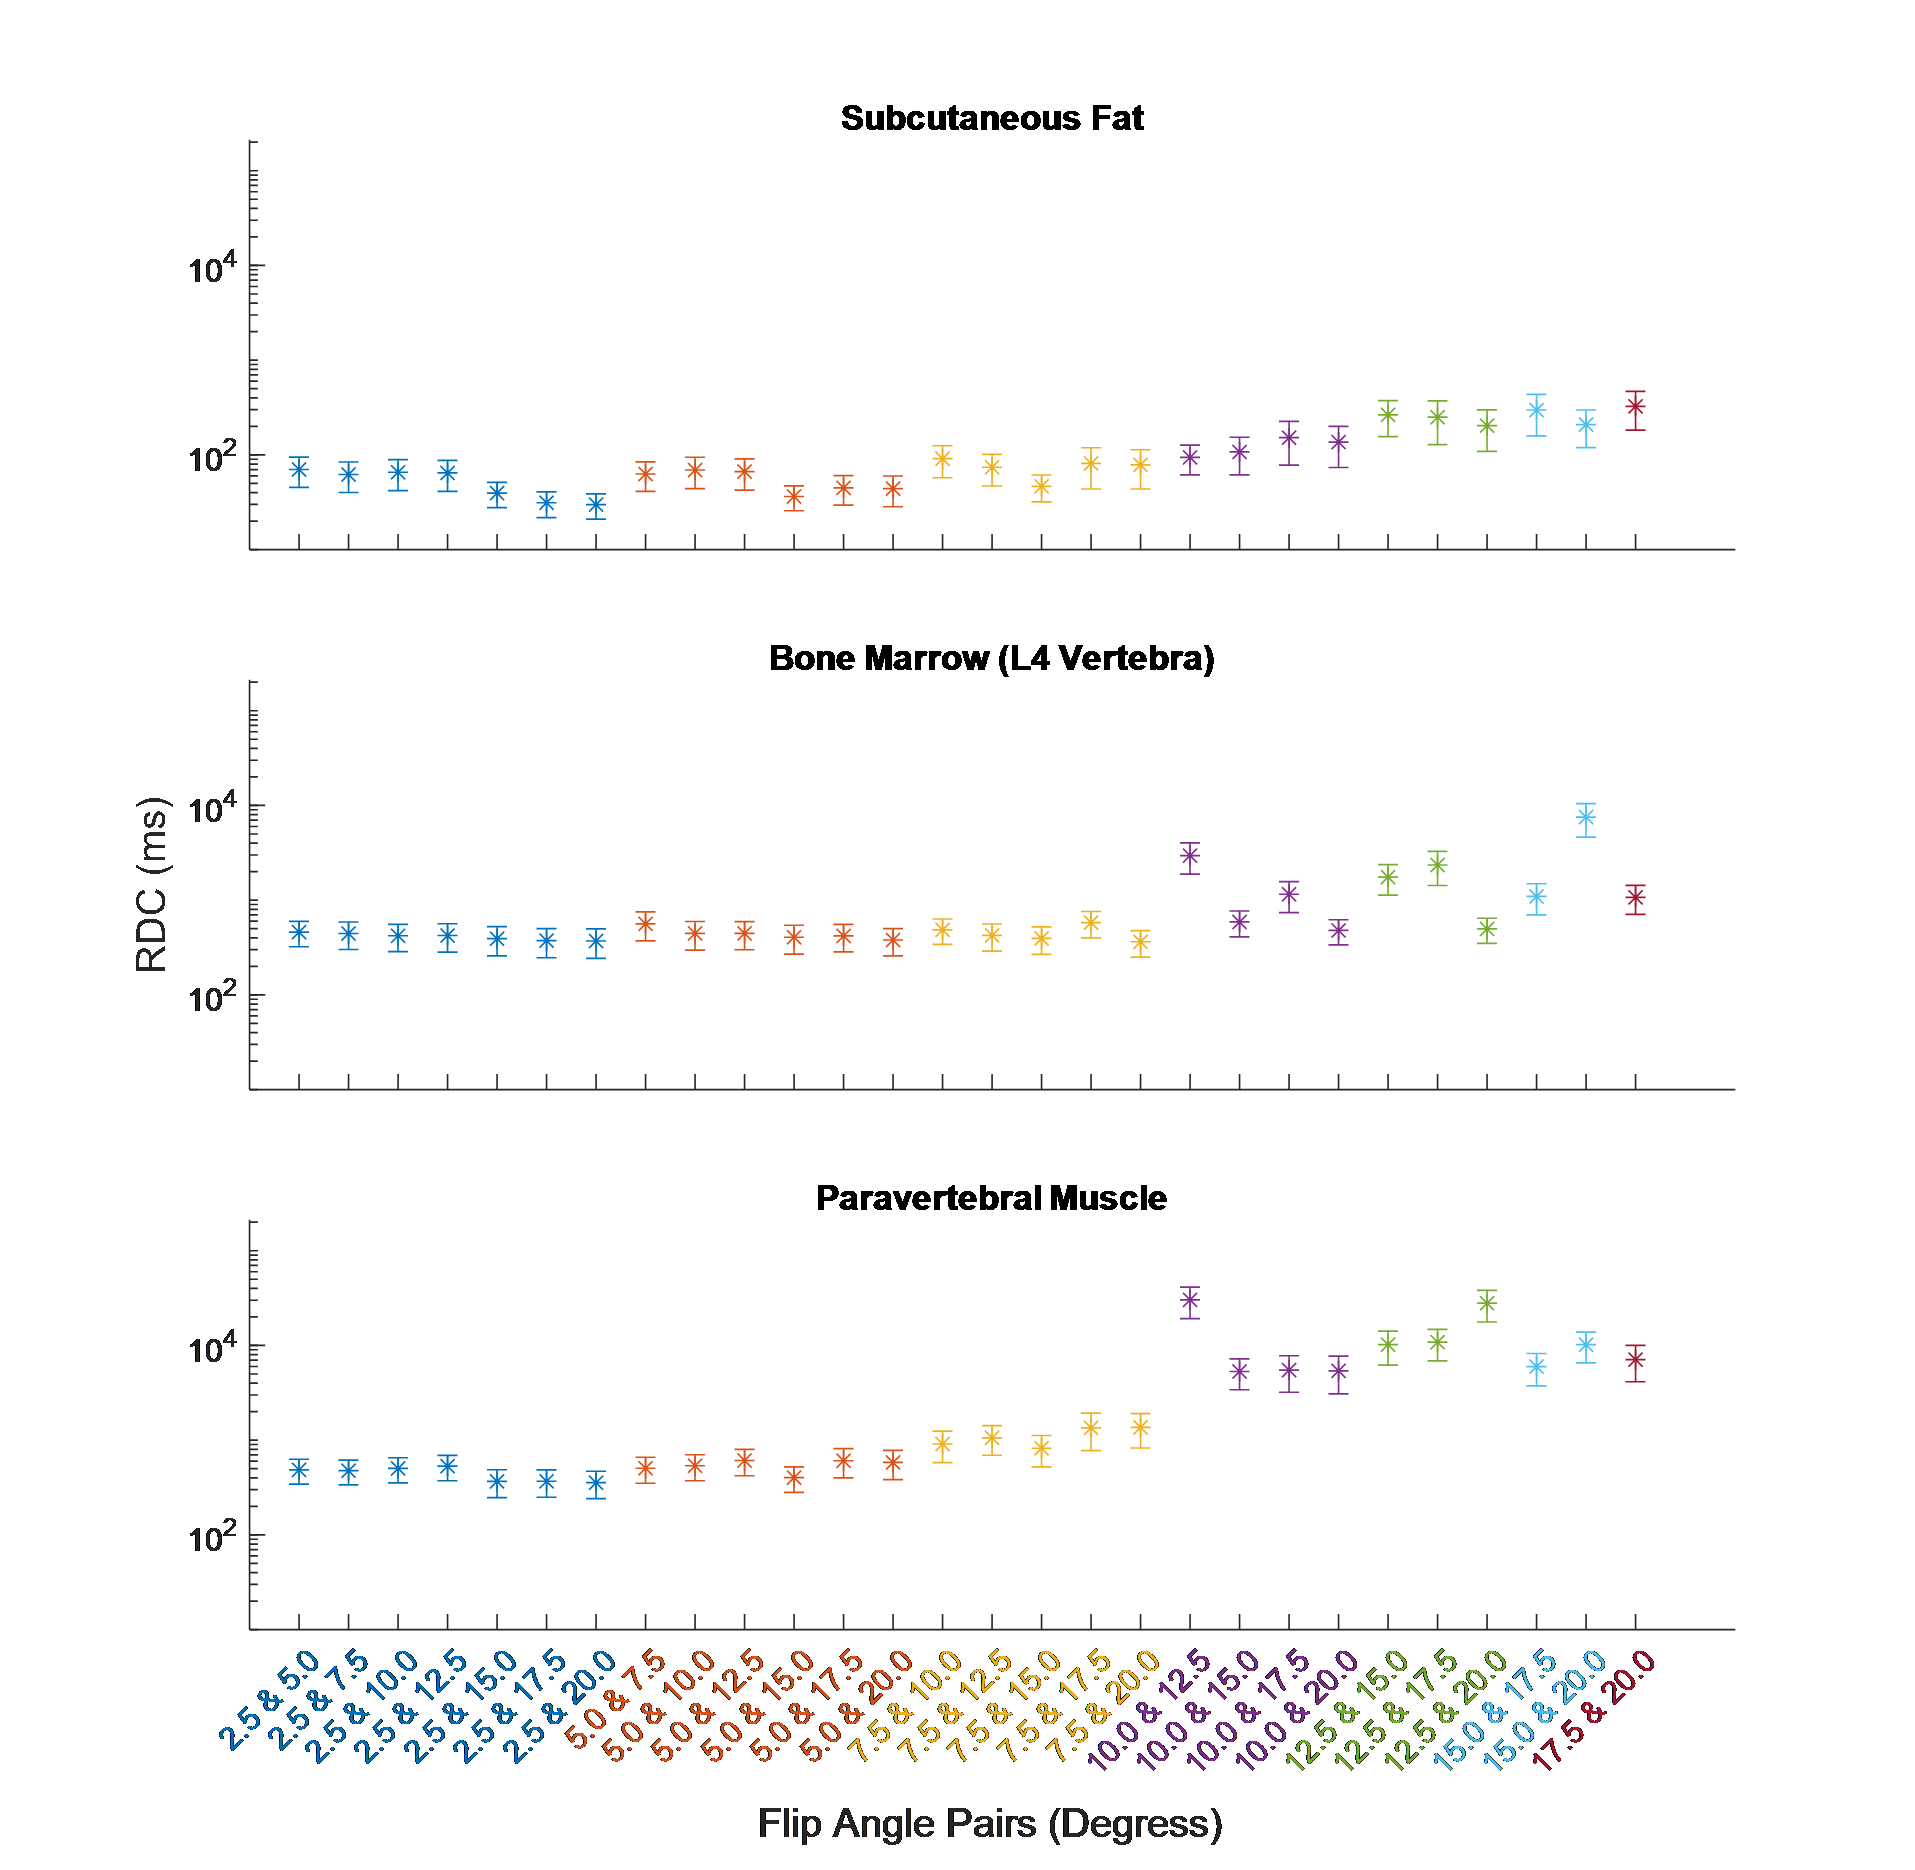
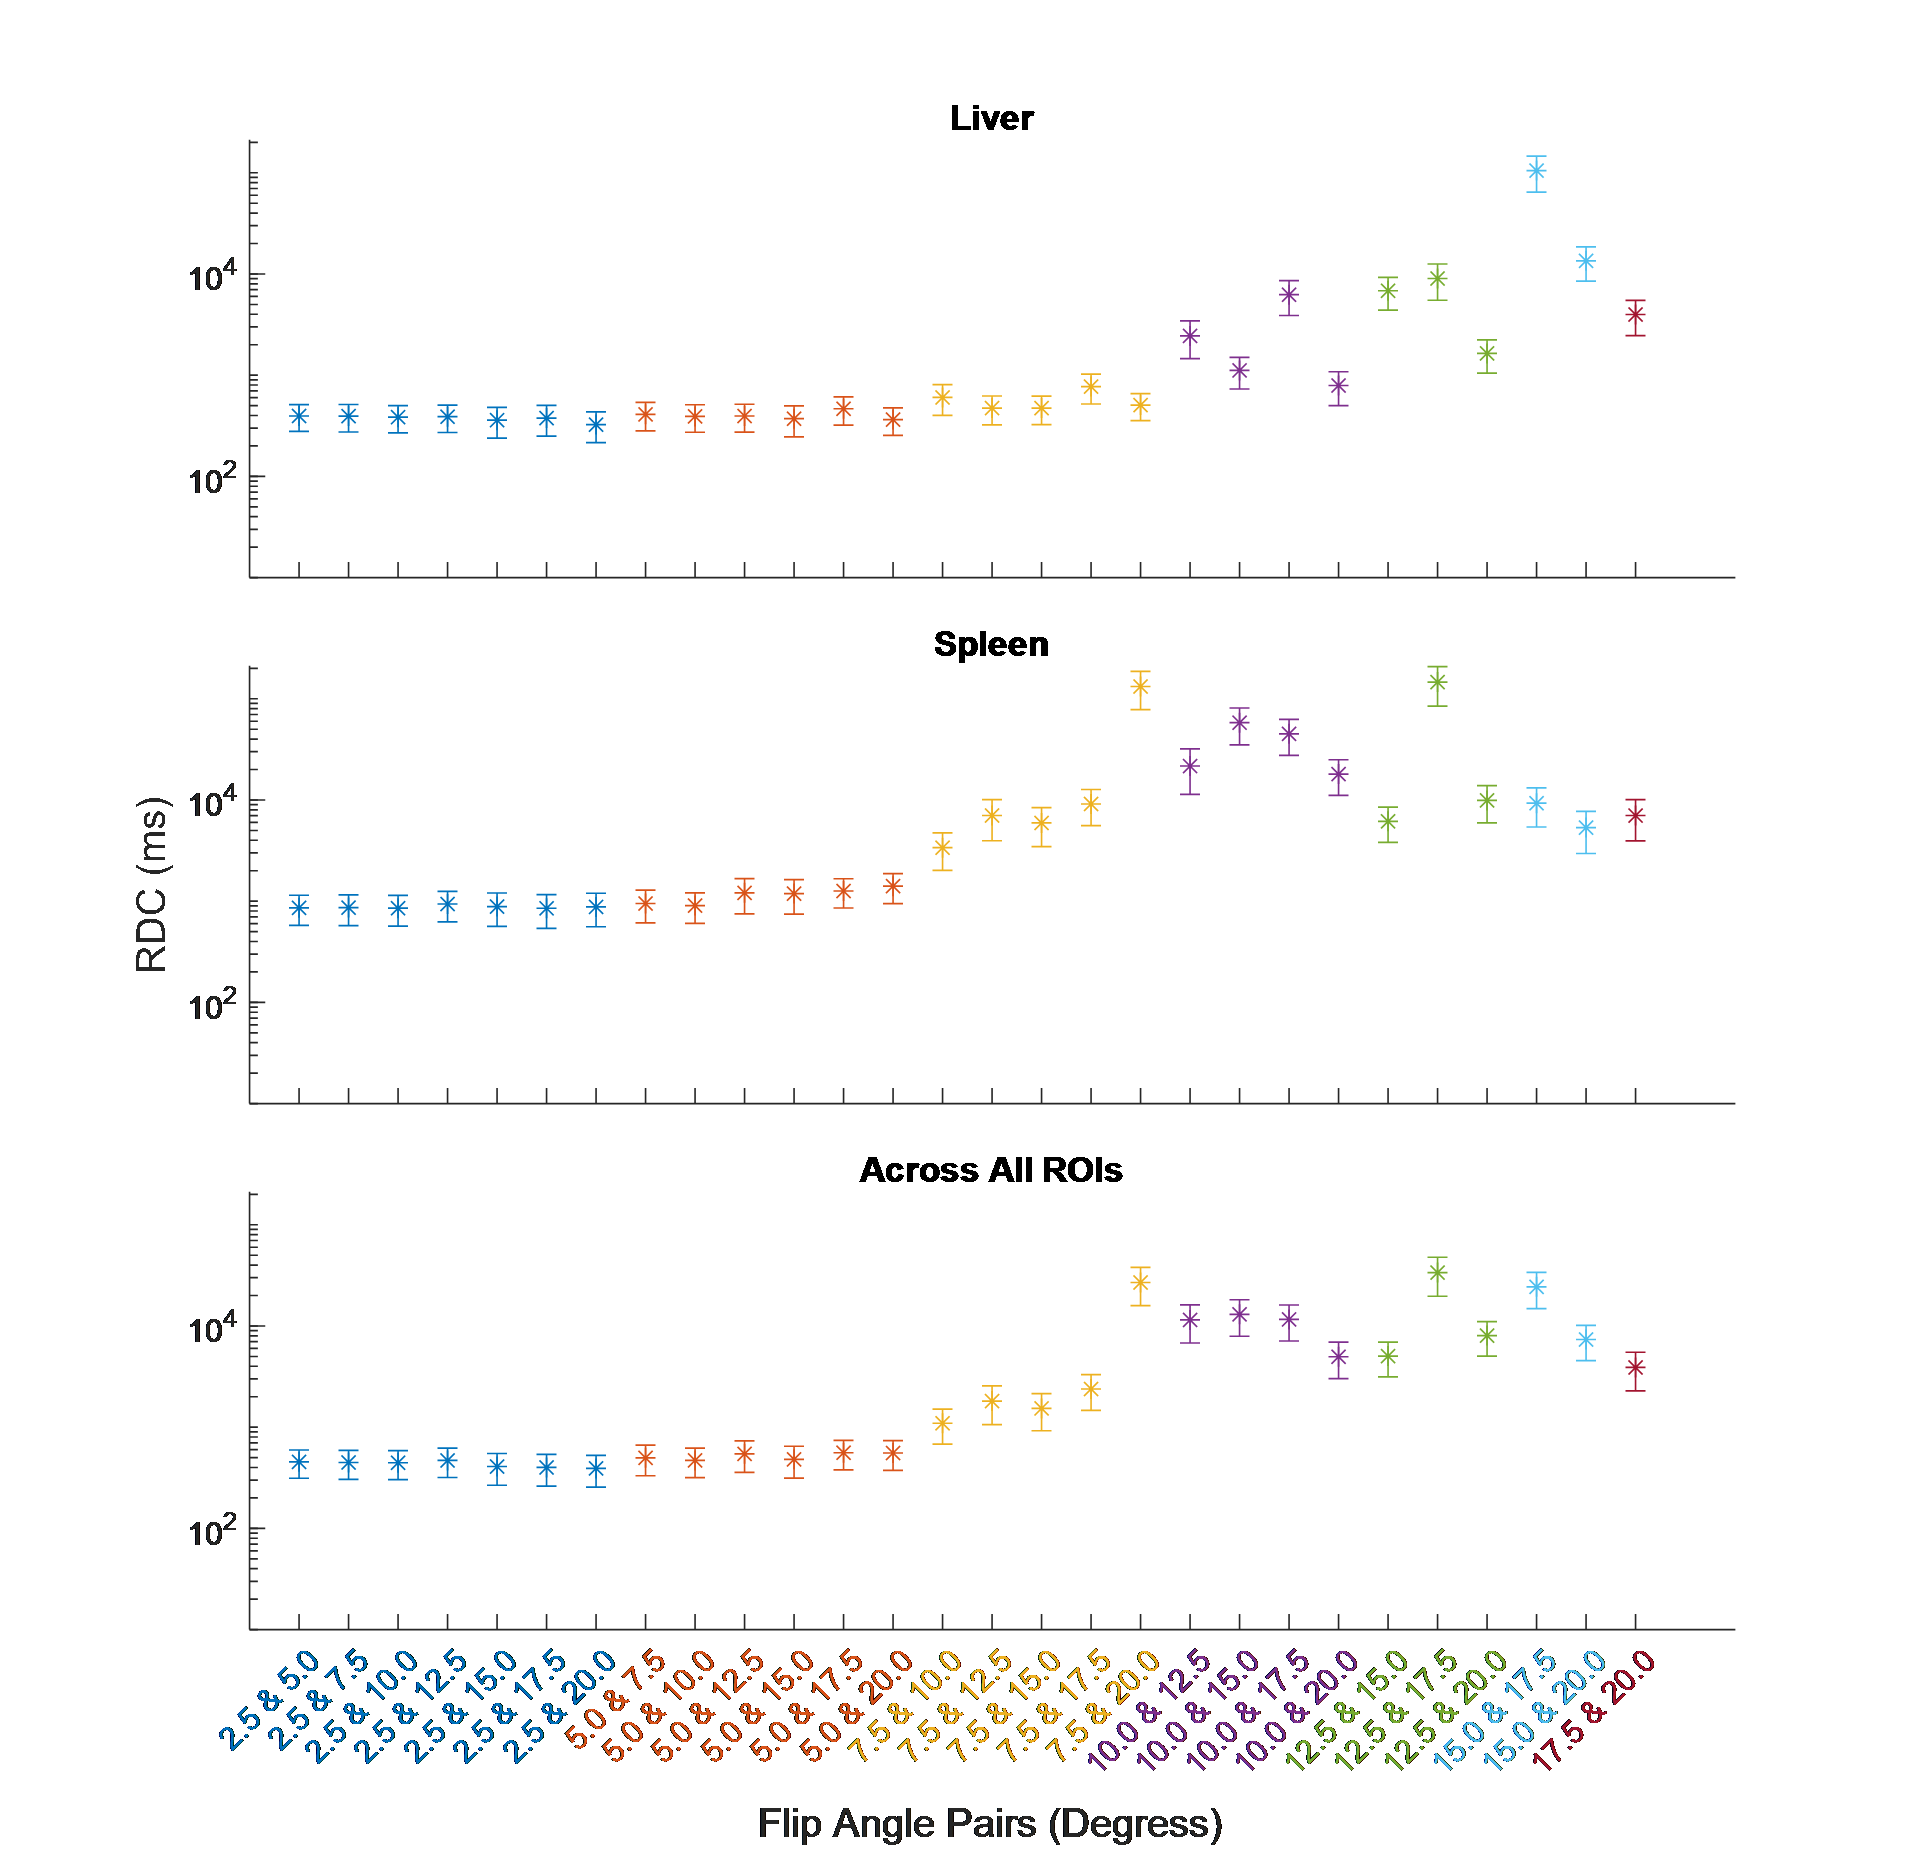
Having three test-retest scans across eight subjects allows for a within-subject measure of both within- and between-fitting agreement, as set out by Bland et. al17. The repeatability coefficient (RC) is the number that, if you make two measurements of the same subject under the same conditions, the difference between those two measurements will be less than the RC in 95% of cases17,18. The reproducibility coefficient (RDC) is the same as the RC, except for measurements made under different conditions17,18 (e.g., using a different fitting method). In both cases, the smaller the coefficient is, the better.
Results and Discussion
The RC was calculated for all fittings. These are shown for each ROI, along with their 95% confidence intervals (CIs), in Figures 1 and 2. Averaged across all ROIs, the lowest RC achieved using two FAs was with 2.5° and 20°, with a value of 535 (358, 1056) ms compared to 553 (370, 1089) ms using all eight FAs. From Figures 1 and 2, it can be observed that for subcutaneous fat, bone marrow, and Liver, fitting with any FA pair with a lower FA of 7.5° or below has a comparable reproducibility to fitting with all eight FAs. The same is true for the paravertebral muscle and spleen using a lower FA of 2.5° or 5.0°. This is indicated by the RC CIs for the fitting with these FA pairs overlapping with that of the fitting with eight FAs.The RDC was calculated for fittings using two FAs compared to fitting using all eight FAs. These are shown for each ROI in Figures 3 and 4. Across all ROIs, the best reproductivity was achieved using the FA pair of 2.5° and 20°, with an RDC of 392 (256, 528) ms. Figures 3 and 4 show that for all ROIs, reproducibility is best when using a lower FA of 2.5° or 5.0°.
Conclusion
WB T1 mapping can be achieved within a clinically viable time with the use of VFA by acquiring only two FAs with minimal loss to precision, providing the lower FA is between 2.5° and 7.5°. This could enable its use as a quantitative imaging biomarker in metastatic cancer. From this empirical study, we recommend an FA pair of 2.5° and 20°.Acknowledgements
No acknowledgement found.References
1. Weidensteiner, C. et al. Tumour T1 changes in vivo are highly predictive of response to chemotherapy and reflect the number of viable tumour cells – a preclinical MR study in mice. BMC Cancer 14, 88 (2014).
2. Ravoori, M. K. et al. Tumor T1 Relaxation Time for Assessing Response to Bevacizumab Anti-Angiogenic Therapy in a Mouse Ovarian Cancer Model. PLoS One 10, (2015).
3. Du, S. et al. Contrast-free MRI quantitative parameters for early prediction of pathological response to neoadjuvant chemotherapy in breast cancer. Eur. Radiol. 32, 5759–5772 (2022).
4. Christensen, K. A., Grant, D. M., Schulman, E. M. & Walling, C. Optimal determination of relaxation times of Fourier transform nuclear magnetic resonance. Determination of spin-lattice relaxation times in chemically polarized species. J. Phys. Chem. 78, 1971–1976 (1974).
5. Gupta, R. K. A new look at the method of variable nutation angle for the measurement of spin-lattice relaxation times using fourier transform NMR. J. Magn. Reson. 25, 231–235 (1977).
6. Fram, E. K. et al. Rapid calculation of T1 using variable flip angle gradient refocused imaging. Magn. Reson. Imaging 5, 201–208 (1987).
7. Deoni, S. C. L., Rutt, B. K. & Peters, T. M. Rapid combined T1 and T2 mapping using gradient recalled acquisition in the steady state. Magn. Reson. Med. 49, 515–526 (2003).
8. Schabel, M. C. & Morrell, G. R. Uncertainty in T(1) mapping using the variable flip angle method with two flip angles. Phys. Med. Biol. 54, (2009).
9. Vrenken, H. et al. Whole-brain T1 mapping in multiple sclerosis: Global changes of normal-appearing gray and white matter. Radiology 240, 811–820 (2006).
10. Tsialios, P., Thrippleton, M., Glatz, A. & Pernet, C. Evaluation of MRI sequences for quantitative T1 brain mapping. J. Phys. Conf. Ser. 931, (2017).
11. Eminian, S., Hajdu, S. D., Meuli, R. A., Maeder, P. & Hagmann, P. Rapid high resolution T1 mapping as a marker of brain development: Normative ranges in key regions of interest. PLoS One 13, (2018).
12. Gräfe, D., Frahm, J., Merkenschlager, A., Voit, D. & Hirsch, F. W. Quantitative T1 mapping of the normal brain from early infancy to adulthood. Pediatr. Radiol. 51, 450 (2021).
13. Messroghli, D. R., Niendorf, T., Schulz-Menger, J., Dietz, R. & Friedrich, M. G. T1 mapping in patients with acute myocardial infarction. J Cardiovasc Magn Reson 5, 353–9 (2003).
14. Messroghli, D. R. et al. Myocardial T1 mapping: application to patients with acute and chronic myocardial infarction. Magn Reson Med 58, 34–40 (2007).
15. Puntmann, V. O. et al. Native T1 mapping in differentiation of normal myocardium from diffuse disease in hypertrophic and dilated cardiomyopathy. JACC Cardiovasc Imaging 6, 475–84 (2013).
16. Kellman, P. & Hansen, M. S. T1-mapping in the heart: Accuracy and precision. J. Cardiovasc. Magn. Reson. 16, 1–20 (2014).
17. Bland, J. M. & Altman, D. G. Measuring agreement in method comparison studies. Stat. Methods Med. Res. 8, 135–160 (1999).
18. Raunig, D. L. et al. Quantitative imaging biomarkers: A review of statistical methods for technical performance assessment. http://dx.doi.org/10.1177/0962280214537344 24, 27–67 (2014).
19. De Bazelaire, C. M. J., Duhamel, G. D., Rofsky, N. M. & Alsop, D. C. MR Imaging Relaxation Times of Abdominal and Pelvic Tissues Measured in Vivo at 3.0 T: Preliminary Results1. https://doi.org/10.1148/radiol.2303021331 230, 652–659 (2004).
Figures