5091
Increasing the repeatability of DESS 3D brain T2 mapping with optimized k-space sampling order
Emile Clements Kadalie1, Aurélien J Trotier1, Nadège Corbin1, Sylvain Miraux1, and Emeline J Ribot1
1Centre de Résonance Magnétique des Systèmes Biologiques, UMR5536, CNRS / Université de Bordeaux, Bordeaux, France
1Centre de Résonance Magnétique des Systèmes Biologiques, UMR5536, CNRS / Université de Bordeaux, Bordeaux, France
Synopsis
Keywords: Quantitative Imaging, Brain, T2 mapping
While recent works have determined that the DESS sequence has the ability to produce 3D T2 mapping of the brain, it remains sensitive to B0-related variation due to respiration. Multiple encoding strategies, using cartesian-spiral trajectories with different lengths combined with a variable density Poisson undersampling mask and Compressed-Sensing reconstruction, were consequently employed and compared in order to suppress respiration artifacts as well as to establish accurate and repeatable 3D T2 maps of the brain at 3T.Introduction
The Dual Echo Steady State (DESS) sequence has recently been extended to 3D brain1 and breast imaging2. However, its sensitivity to motion and B0 variation2,3 notably hinders any potential reproducible and accurate 3D T2 mapping.Previous work4 demonstrated that respiration induced ghosting artifacts on the DESS brain images could be corrected by making use of self-gating and re-ordering of the data combined with an acceleration approach, called SG-CS-DESS thereafter. Nevertheless, repeatability of the method had not been established.
As a result, the objective of this current work is to study this correction alongside different encoding strategies in order to measure their impact on 3D T2 estimation and repeatability.
Methods
MR systemAcquisitions were carried out on a Siemens 3T PRISMA scanner, on two healthy volunteers. Image reconstruction was achieved using Matlab in conjunction with the Berkeley Advanced Reconstruction Toolbox5 (BART).
Sequence
A regular 3D Cartesian DESS sequence was firstly implemented (referred to as Fully DESS). The k-space lines were then acquired following a completely random order (Random DESS). The final scheme was a golden-step Cartesian trajectory with spiral profile ordering6 in the phase encoded directions (SP-DESS) (Fig. 1). This reordering was varied according to the size of the spiral interleaf i.e the number of acquired lines from one end of a spiral to the other. The previously described SG-CS-DESS4 was then implemented and the spiral reordered patterns were applied on it as well (SG-CS-SP-DESS). These versions used a trajectory with a variable density Poisson disk Compressed-Sensing (CS) mask in the ky-kz plane, an undersampling factor of 8, and a fully sampled center of 24x24 voxels. The mask sampling was modified between each repetition of the acquisition in order to maximize the total number of encoded lines obtained at the end of an acquisition.
Reconstruction
For the accelerated versions, the data was grouped into 7 respiratory bins by using the SG signal4,7. Parallel imaging Compressed-Sensing reconstruction was then performed with spatial wavelet regularization and temporal regularization along the respiratory bins. This led to the reconstruction of 7 images that were averaged for SNR maximization through a sum-of-squares.
3D T2 maps were then obtained by fitting the image data to a previously computed dictionary simulated with extended phase graph algorithms8, by using a range of T1 and B1 values.
MR Acquisition
The Fully, Random and SP-DESS sequences were performed in 6min43sec. When CS was used in the SG-CS and SG-CS-SP-DESS, 8 repetitions were set, lasting 7min11sec. The spiral interleaf length was equal to 26640 (all lines), 13320, or 144 for the SP-DESS, and 3560 (all lines), 500 or 144 for the SG-CS-SP-DESS. Each acquisition was performed twice (test-retest) with a 1.2mm isotropic resolution on each volunteer.
A MP2RAGE sequence9 (3min03sec for a 1mm isotropic voxel size) and a PreSat-TFL B1 mapping sequence10 (33sec, 1.7 x 1.7 x 6 mm3) were also acquired to obtain voxel-wise T1 and B1 values and increase T2 estimation accuracy.
Analysis
The brain white matter region was segmented with SPM1211. Violin plots were computed from all voxels in this region for the 9 T2 maps resulting from the 9 different DESS acquisitions. Bland-Altman plots for each DESS test-retest were then established by measuring the T2 difference between both tests with respect to their T2 average.
Results
The Fully DESS sequence produced ghosting artifacts that corrupted the anatomical images, while the artifacts were spread out over the images as noise in the Random and SP-DESS acquisitions (Fig. 2). Nonetheless, the T2 maps remained inadequate for all 5 different fully versions, reflected by the wide distribution of their T2 values in the white matter (Fig. 3) and the large voxel differences between T2 maps (Fig. 4).On the other hand, the CS versions generated artifact-less images with T2 standard deviations approximately halved compared to the fully sequences (Fig. 2). The violin plots then depicted a reduced interquartile range and a much denser distribution of voxels around the median, especially for the SG-CS-SP-DESS with maximum interleaf length (Fig. 3). Lastly, robust repeatability was established with a considerably larger amount of voxels centered around a 0% difference (Fig. 4).
Discussion
By developing different encoding strategies with a goal of reducing respiratory induced artifacts, this work demonstrated a gradual improvement of DESS 3D T2 estimation. At first, the random and spiral trajectories disrupted the coherence of the respiratory artifact which spread it out in the form of noise instead. However, this did not necessarily increase T2 accuracy, and the drastic gradient changes in the random and short spiral interleaf trajectories could possibly produce Eddy currents which could not be accounted for. Consequently, combining a long interleaf spiral Cartesian trajectory with CS acceleration and a respiratory binning method previously validated led to artifact-less reconstructed images and repeatable T2 maps.Conclusion
We have optimized and validated a DESS sequence employing a spiral reordered cartesian encoding trajectory along with acceleration and respiratory artifact correction. The data obtained from this 11min protocol provides repeatable 3D T2 maps of the brain that can be useful for longitudinal monitoring of tissue microstructure.Acknowledgements
This study was achieved within the context of the Laboratory of Excellence TRAIL ANR-10-LABX-57. This work was also supported by the French National Research Agency (ANR-19-CE19-0014).References
1. Gras, V. et al. (2017) ‘Diffusion-weighted DESS protocol optimization for simultaneous mapping of the mean diffusivity, proton density and relaxation times at 3 Tesla’, Magnetic Resonance in Medicine, 78(1), pp. 130–141.2. Moran, C.J. et al. (2015) ‘Respiration Induced B0 Variation in Double Echo Steady State Imaging (DESS) in the Breast’, 23rd annual Meeting and Exhibition of the ISMRM, pp. 498.
3. Barbieri, M. et al. A method for measuring B0 field inhomogeneity using quantitative double-echo in steady-state. Magn Reson Med. 2022;1-17. DOI: 10.1002/mrm.29465
4. Kadalie, E.C. et al. (2022) ‘Respiration artifact-free 3D DESS T2 mapping of the human brain’, 30th annual Meeting and Exhibition of the ISMRM, pp. 760.
5. BART Toolbox for Computational Magnetic Resonance Imaging, DOI: 10.5281/zenodo.592960
6. Prieto, C. et al. (2015) ‘Highly efficient respiratory motion compensated free-breathing coronary mra using golden-step Cartesian acquisition’, Journal of Magnetic Resonance Imaging, 41(3), pp. 738–746.
7. Rosenzweig, S. et al. (2020) ‘Cardiac and Respiratory Self-Gating in Radial MRI using an Adapted Singular Spectrum Analysis (SSA-FARY)’, IEEE Transactions on Medical Imaging, 39(10), pp. 3029–3041.
8. Weigel, M. (2015) ‘Extended phase graphs: Dephasing, RF pulses, and echoes - pure and simple’, Journal of Magnetic Resonance Imaging, 41(2), pp. 266–295.
9. Trotier, A.J. et al. (2019) ‘Compressed-Sensing MP2RAGE sequence: Application to the detection of brain metastases in mice at 7T’, Magnetic Resonance in Medicine, 81(1), pp. 551–559.
10. Chung, S. et al. (2010) ‘Rapid B1+ mapping using a preconditioning RF pulse with TurboFLASH readout’, Magnetic Resonance in Medicine, 64(2), pp. 439–446.
11. https://www.fil.ion.ucl.ac.uk/spm
Figures
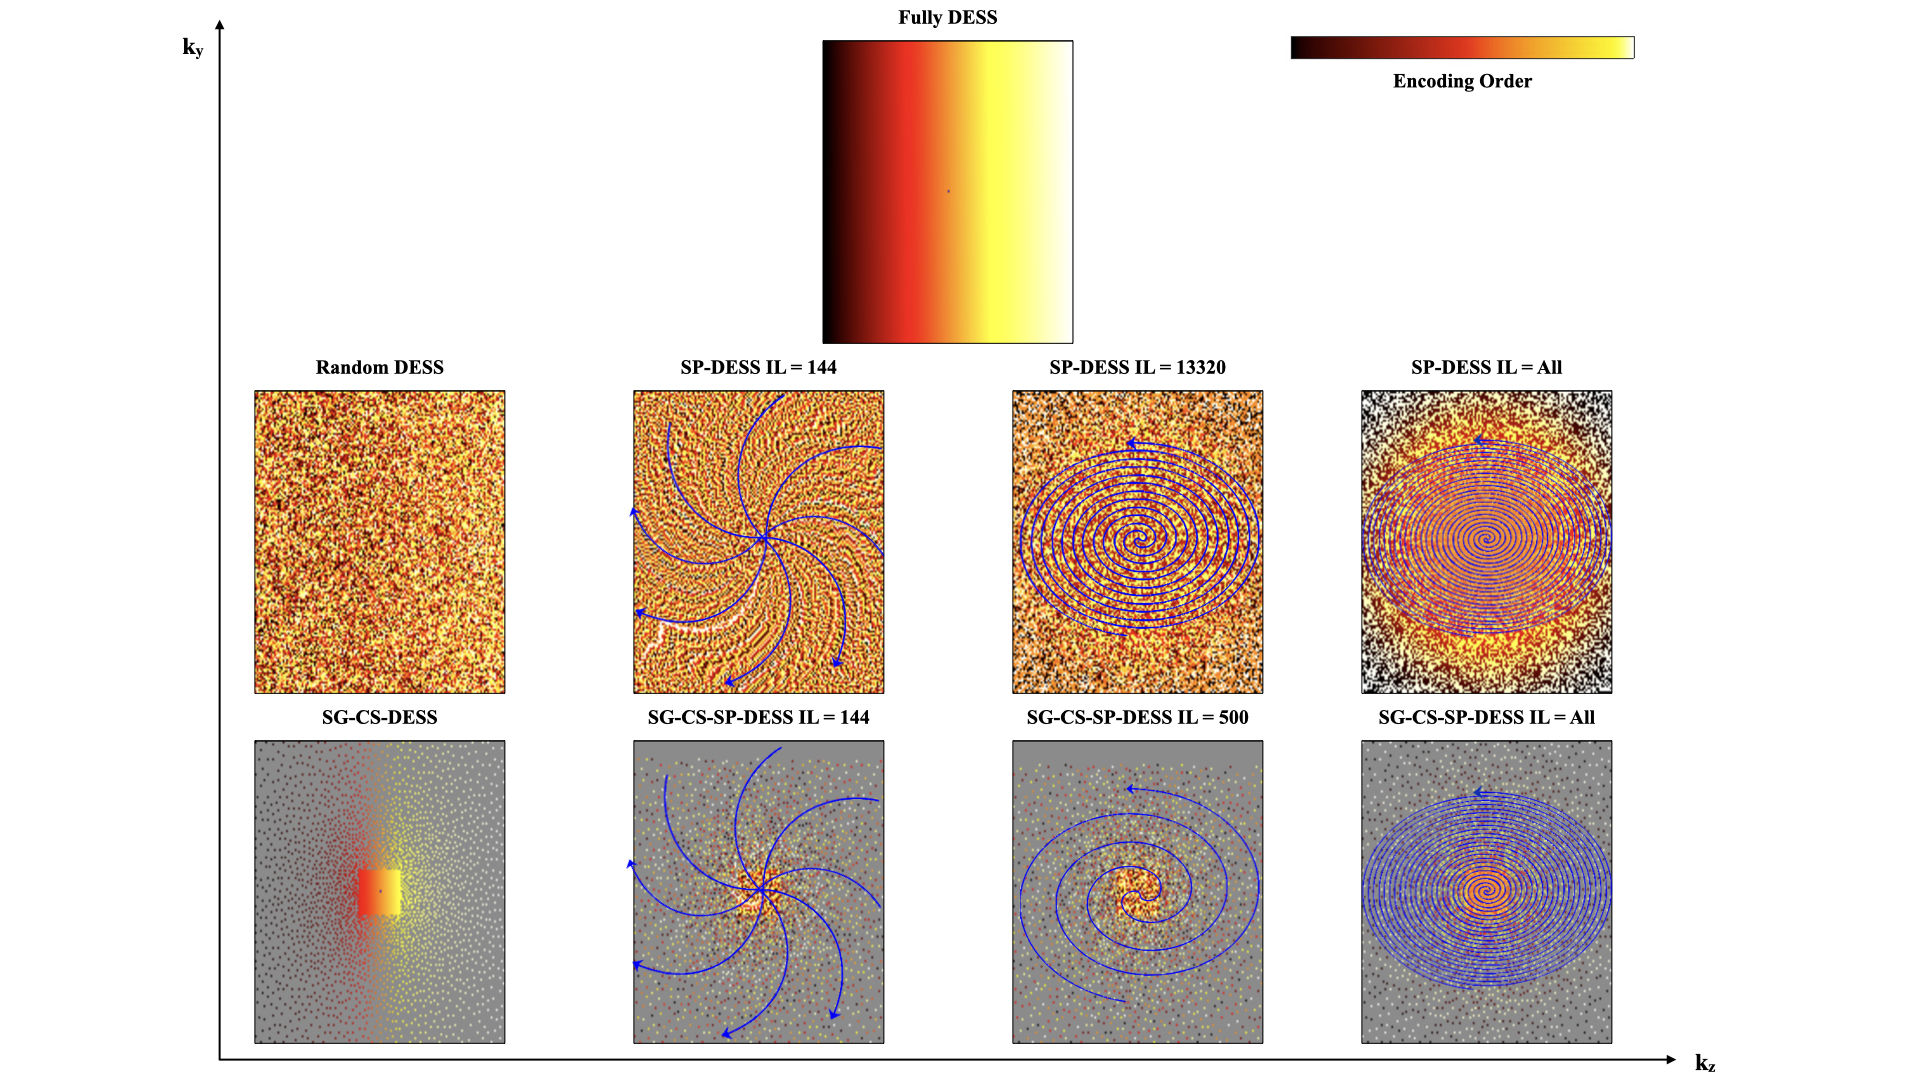
Figure 1 : Different encoding schemes used for DESS acquisition. Top row : the regular fully Cartesian 3D DESS with lines normally acquired along the phase encoding directions. Middle row : reordering of the fully DESS with random and spiral trajectories with different spiral interleaves. The SP-DESS scheme involved cartesian lines that were acquired with a phase encoding plane sampled in a spiral-like fashion across k-space. One blue arrow in the k-space corresponds to 1 spiral interleaf. Bottom row : Compressed-Sensing undersampling applied to the Fully and SP-DESS versions.
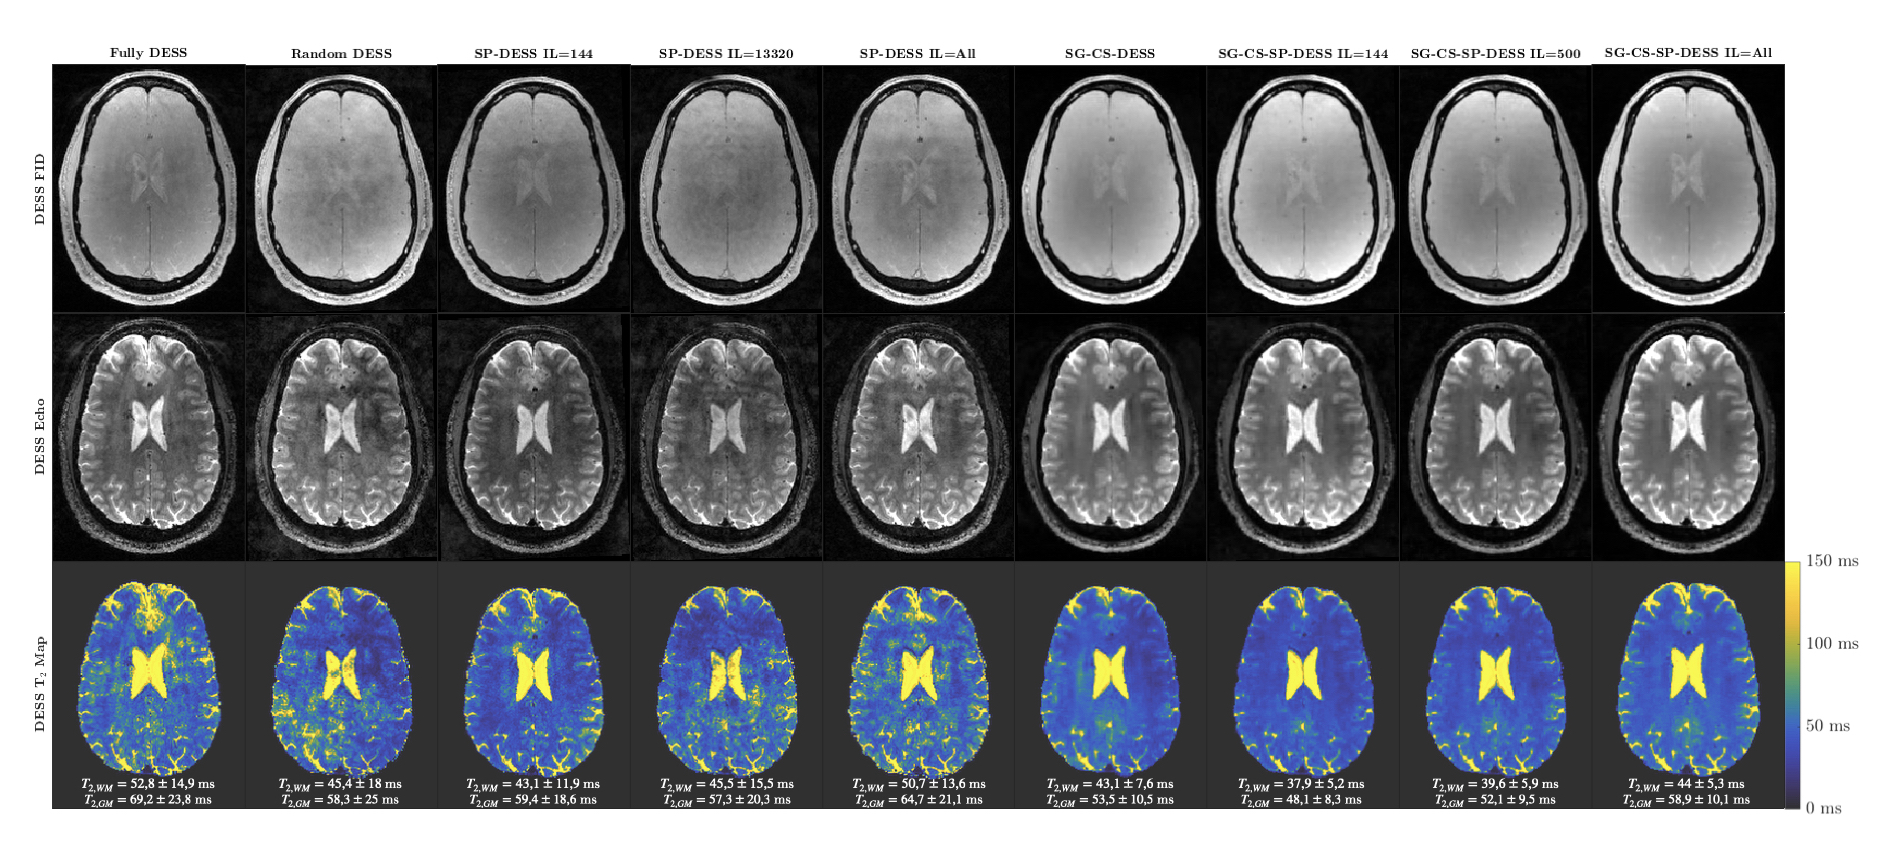
Figure 2 : 3D DESS FID and Echo images, and the corresponding T2 maps for all the different encoding strategies. For each T2 map, the mean T2 value in the white and gray matter regions is specified, with the mean and standard deviation obtained from the respective ROIs.
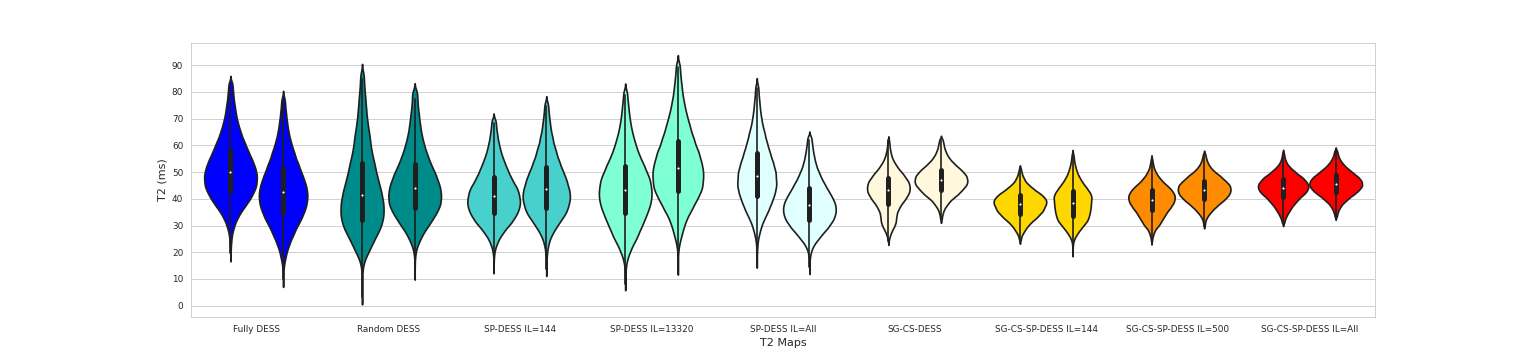
Figure 3 : Violin plots depicting the distribution of T2 values of all voxels within the white matter region for each encoding strategy, for a healthy volunteer. There are two violins per encoding scheme, corresponding to the results from both tests. The distribution is much more condensed around the median in the CS versions. In the same manner, the interquartile range shown by the thin black box reduces in size from left to right (16,4 ms and 17,3 ms for the fully DESS vs 6,7 ms and 6,4 ms for the SG-CS-SP-DESS with maximum interleaf length).
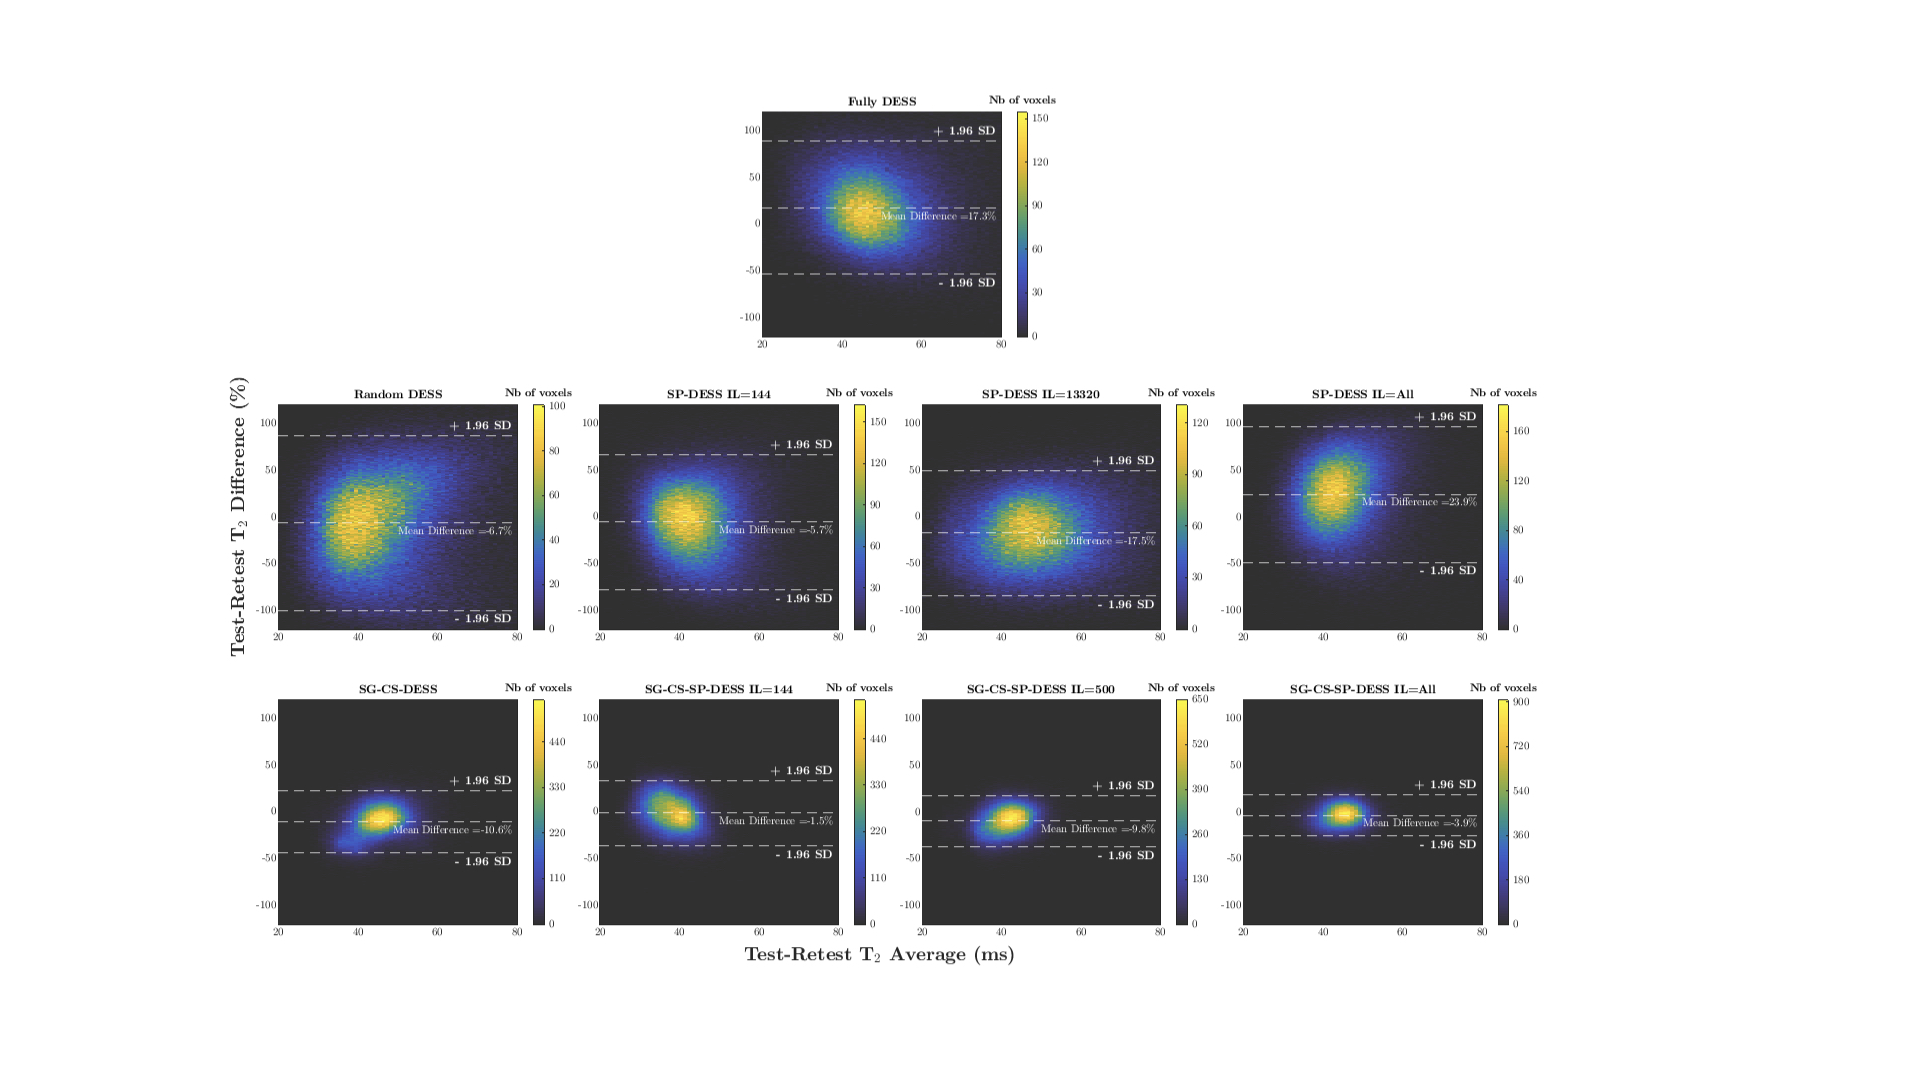
Figure 4 : Bland-Altman plots illustrating the test-retest T2 difference in the white matter region (from two independent scans of a healthy volunteer) for each DESS acquisition with respect to the T2 average. Top row : the fully DESS with limits of agreement (±1.96 SD) above 50% and below -50%. Middle row : the Random and SP DESS tests showing similar limits to the fully DESS. Bottom row : the accelerated versions where the limits are much smaller, especially for the SG-CS-SP-DESS with maximum interleaf length (~±20%).
DOI: https://doi.org/10.58530/2023/5091