5090
Establishing absolute temperature scale and diffusion metrics in PVP phantoms for cross-center standardization1Laboratory of Quantitative Imaging, National Institute of Biomedical Imaging and Bioengineering, Bethesda, MD, United States, 2MR Division, GE Healthcare, Waukesha, WI, United States
Synopsis
Keywords: Quantitative Imaging, Diffusion Tensor Imaging, PVP phantom, spectroscopy, temperature mapping
Clinical acceptance of quantitative diffusion MRI faces difficulties due to lack of standardization. Quality control across platforms and centers is vital for multicenter efforts. Polyvinylpyrrolidone(PVP) phantoms provide excellent properties suitable for cross-center validation. However, diffusion metrics vary with temperature. Measuring phantom temperature along with diffusion metrics is necessary. Spectroscopic temperature mapping of the PVP phantom and ADC values were investigated on two different vendor platforms. It is shown that the water peak moves relative to easily identifiable stable peaks in PVP allowing intrinsic temperature measurement. Excellent agreement for temperature and ADC mapping across both platforms should make cross-site standardization possible.Introduction
Although diffusion MRI is prevalent as a research tool, its widespread acceptance in the clinical realm still faces difficulties related to lack of standardization across platforms. Therefore, the need for quality control across platforms and centers becomes vital in any multi-center effort, and for clinical acceptance. Towards this end, PVP phantoms have been developed for diffusion MRI1 which show favorable properties, including having a large range of diffusivities, being temporally stable, cheap, and non-toxic with T1/T2 values like that of biological tissue, and with high viscosity to reduce effects of vibration and convective motion2. Although diffusion values of PVP at various concentrations have been mapped against temperature,3,4, ascertaining temperature of the phantom on an independent scale has not been undertaken. It is well-known that H2O peak moves with temperature due to chemical shielding, while some peaks (eg. NAA) remain stable5. The work here sought to establish the PVP spectrum and to determine if any detected peaks show invariance with temperature. This would then offer an absolute scale by which to determine phantom temperature at any site. The temperature along with the diffusion values can then be used to compare and standardize metrics across sites.Methods
Imaging of the PVP phantom was done with a 32-channel receive head coil on two scanners from two vendors. The PVP (40% solution) phantom was heated in a microwave and allowed to cool inside the bore while PRESS and DTI sequences were executed at regular intervals. Two fiber optic probes (OpSense Solutions, Canada) were inserted into the phantom through the center filling hole and the temperature monitored remotely. To establish spectroscopic peaks for the PVP phantom, a PRESS sequence with a voxel placed at isocenter was used along with VAPOR water suppression (WS) on scanner 1, while CHESS WS was performed on scanner 2 (scan time ~1 min). Spectroscopic fitting was done to identify peaks. Distance between the H2O peak and 6 peaks (selected for being well defined and prominent across the two platforms) was determined and plotted against mean temperature. DTI on a single transverse slice positioned at isocenter and with six encoding directions was performed on both scanners (b-value = 1000 s/mm2, scan time: ~1:30). ADC (mean Trace) from DTI was determined from an ROI of 130 cm2 placed at the center of the slice.Results
Two groups of peaks corresponding to CH2 adjacent to C=O (1.8-2.5ppm) and CH2 adjacent to N (~3.1-3.3 ppm)6 were clearly identified (see Figure 1). Figure 2 shows the plot of Δppm (H2O - PVP peaks) against mean temperature for each of the 6 peaks for both scanners. R2 ranged from 0.9 to 0.94 for all cases and for both probes. Mean slope was 0.00998±0.000096 ppm/°C across all peaks on scanner 1 and was 0.00957±0.000012 ppm/°C on scanner 2 (0.92<R2<0.95).Vendor 1: Δppm1 (H2O - peak 1) = 0.00997.T + 1.5939
Vendor 2: Δppm1 = 0.00974.T + 1.5971
DTI showed a linear relationship with temperature on both scanners (Figure 3):
Vendor 1: ADC = 0.0228.T + 0.0659, (R2 = 0.995)
Vendor 2: ADC = 0.0229.T + 0.0809, (R2 = 0.979)
where T is mean temperature in °C.
Discussion
H2O peak has been measured to shift at the rate of 0.009 to 0.0103 ppm/°C7,8. Our slope agreed with values determined for water against a stable peak like NAA. Peaks 1, 2 and 6 showed good agreement between the two scanners (Figure 4) with peak 1 showing the best correspondence. There was mean bias of 0.003 ppm for peak 1 (corresponding to ≈ 0.3°C) and a bias of 0.0177×10⁻³ mm2/s in ADC values (Figure 5) over a temperature range of 16-38°C between the two scanners (scanner 1<scanner2). Systematic bias in measurements could be a result of multiple sessions required to collect data due to time related constraints on the scanner which were different for the two scanners. It was also noted that thermal variation due to low convection in viscous fluid required substantial time to stabilize; discontinuities in readings were more prominent in the initial phase after heating, possibly due to temperature inhomogeneity across the phantom. An exogenous metabolite like NAA could be included in a PVP phantom. However, PVP solution is a viscous liquid and immiscibility of NAA in PVP solutions is unknown at this point. DTI showed a linear relationship with temperature, which is in line with another work3.Limitations: The observations here are from two 3T scanners from two different vendors and was done with only one PVP phantom with a concentration of 40%. However, spectroscopy peaks remain invariant with concentrations and field strengths, and results in line with our work are expected with phantoms of similar concentrations.
Conclusion
This work establishes an intrinsic temperature scale for the PVP phantom using spectroscopy and ties it with corresponding diffusion values. Combined with correction for gradient non-linearity on scanners8, this work can address the issue of achieving standardization for diffusion values across vendors and sites.Acknowledgements
The authors would like to acknowledge help provided by Dr. Jacco De Zwart from NINDS and Dr. John A. Derbyshire from NIMH.References
[1] M. Fukuzaki, A. L. Alexander, C. Goodrich, K. Hasan, H. R. Buswell, G. T. Gullberg, D. L. Parker. The ability of line scan diffusion imaging method— comparison with echo planar diffusion imaging, Proc ISMSM, pp. 1833, 1999.
[2] C. Pierpaoli, J. Sarlls, U. Nevo, P. J. Basser, and F. Horkay. Polyvinylpyrrolidone (PVP) water solutions as isotropic phantoms for diffusion MRI studies. Proc ISMRM, pp 1414, 2009.
[3] J. Sarlls, M. Komlosh, F. Horkay, U. Nevo, P.J. Basser, C. Pierpaoli. MR characterization and temperature dependence of aqueous polyvinylpyrrolidone (PVP0 solutions for use as MR phantoms. Proc ISMRM, pp. 3227, 2018.
[4] F. Wagner, F.Laun, T.A. Kuder, et al. Temperature and concentration calibration of aqueous polyvinylpyrrolidone (PVP) solutions for isotropic diffusion MRI phantoms. 12(6):e0179276, PLoS One. 2017.
[5] E.B. Cady, P. C. D'Souza, J. Penrice, A. Lorek. The estimation of local brain temperature by in vivo 1H magnetic resonance spectroscopy. MRM, 33:862-867, 1995.
[6] L.K. Mireles, M-R. Wu, N. Saadeh, L. Yahia, E. Sacher Physicochemical characterization of polyvinyl pyrrolidone: a tale of two polyvinyl pyrrolidones. ACS Omega 2020 5(47), 30461-30467.
[7] N. McDannold. Quantitative MRI-based temperature mapping based on the proton resonant frequency shift: Review of validation studies, International Journal of Hyperthermia, 21:6, 533-546, 2005.
[8] Y. Ishihara, A. Calderon, H. Watanabe, et al. A precise and fast temperature mapping using water proton chemical shift. MRM 34:814-923, 1995.
[9] A.S. Barnett, M.O. Irfanoglu, B. Landman, B. Rogers, C. Pierpaoli. Mapping gradient nonlinearity and miscalibration using diffusion-weighted MR images of a uniform isotropic phantom. MRM 86:3259-3273, 2021.
Figures
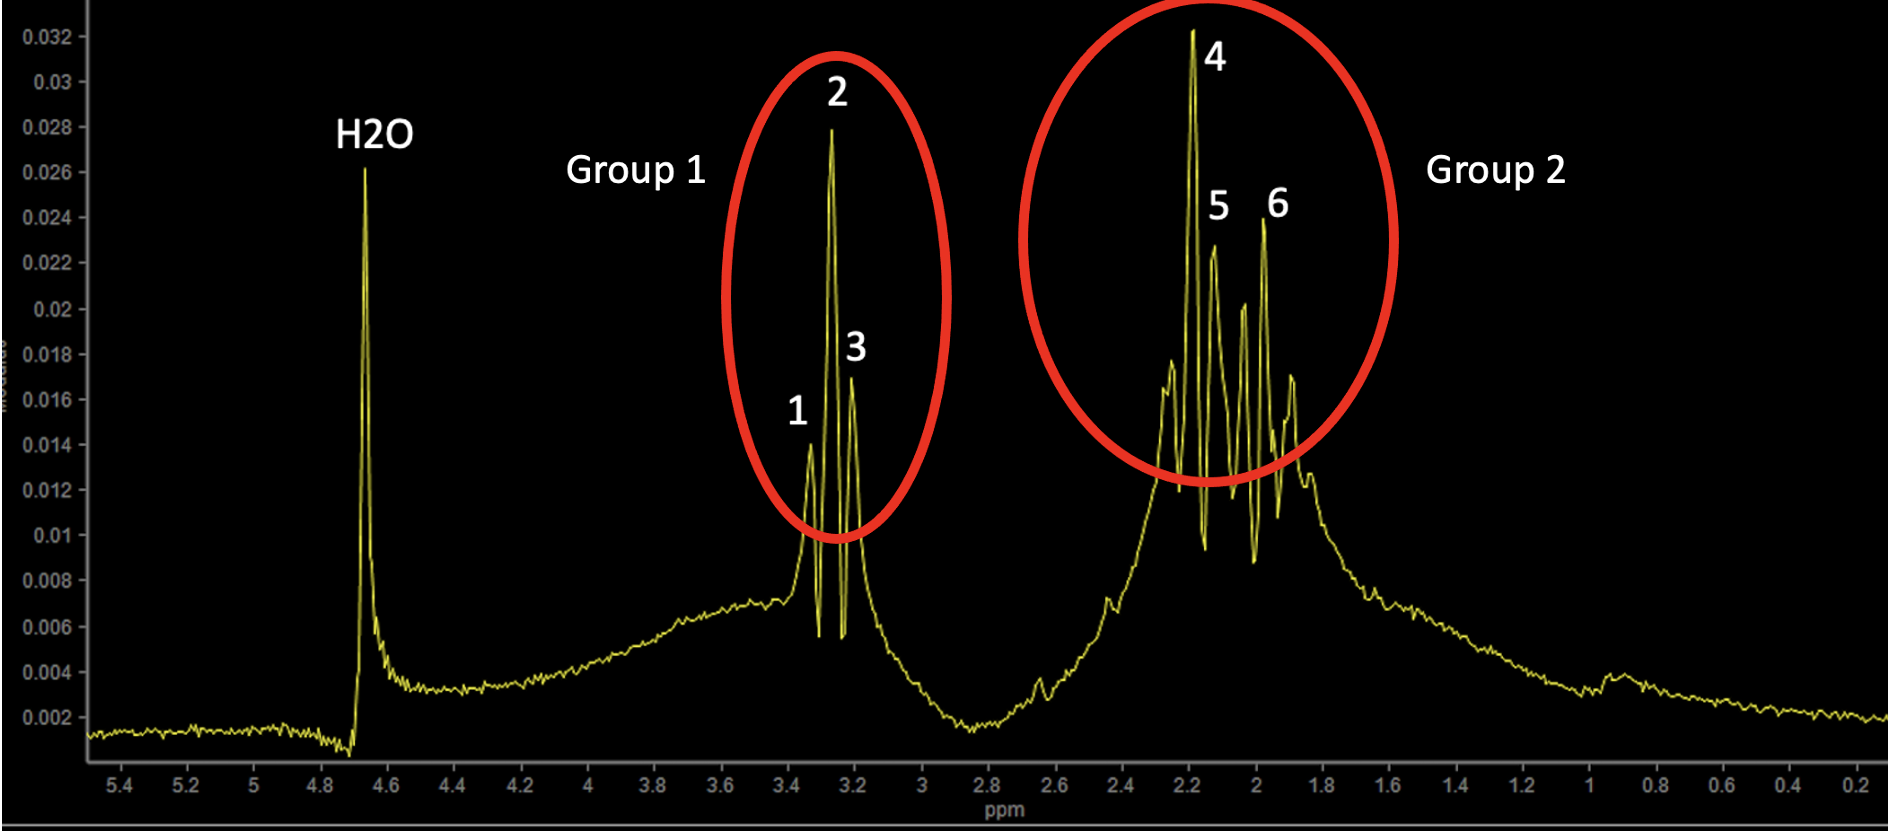
Figure 1: Spectrum with CH2 adjacent to C=O (Group 1) and CH2 adjacent to N (Group 2) were identified. Peaks 1 through 6 were used for temperature mapping.

Figure 2: Plot of Δppm (between water peak and each of the 6 PVP peaks) against temperature on scanner 1 (left) and scanner 2 (right). Slopes across all 6 peaks were 0.00998±0.0000096 ppm/°C and 0.00957±0.000012 ppm/°C respectively, showing excellent agreement across peaks and scanners.
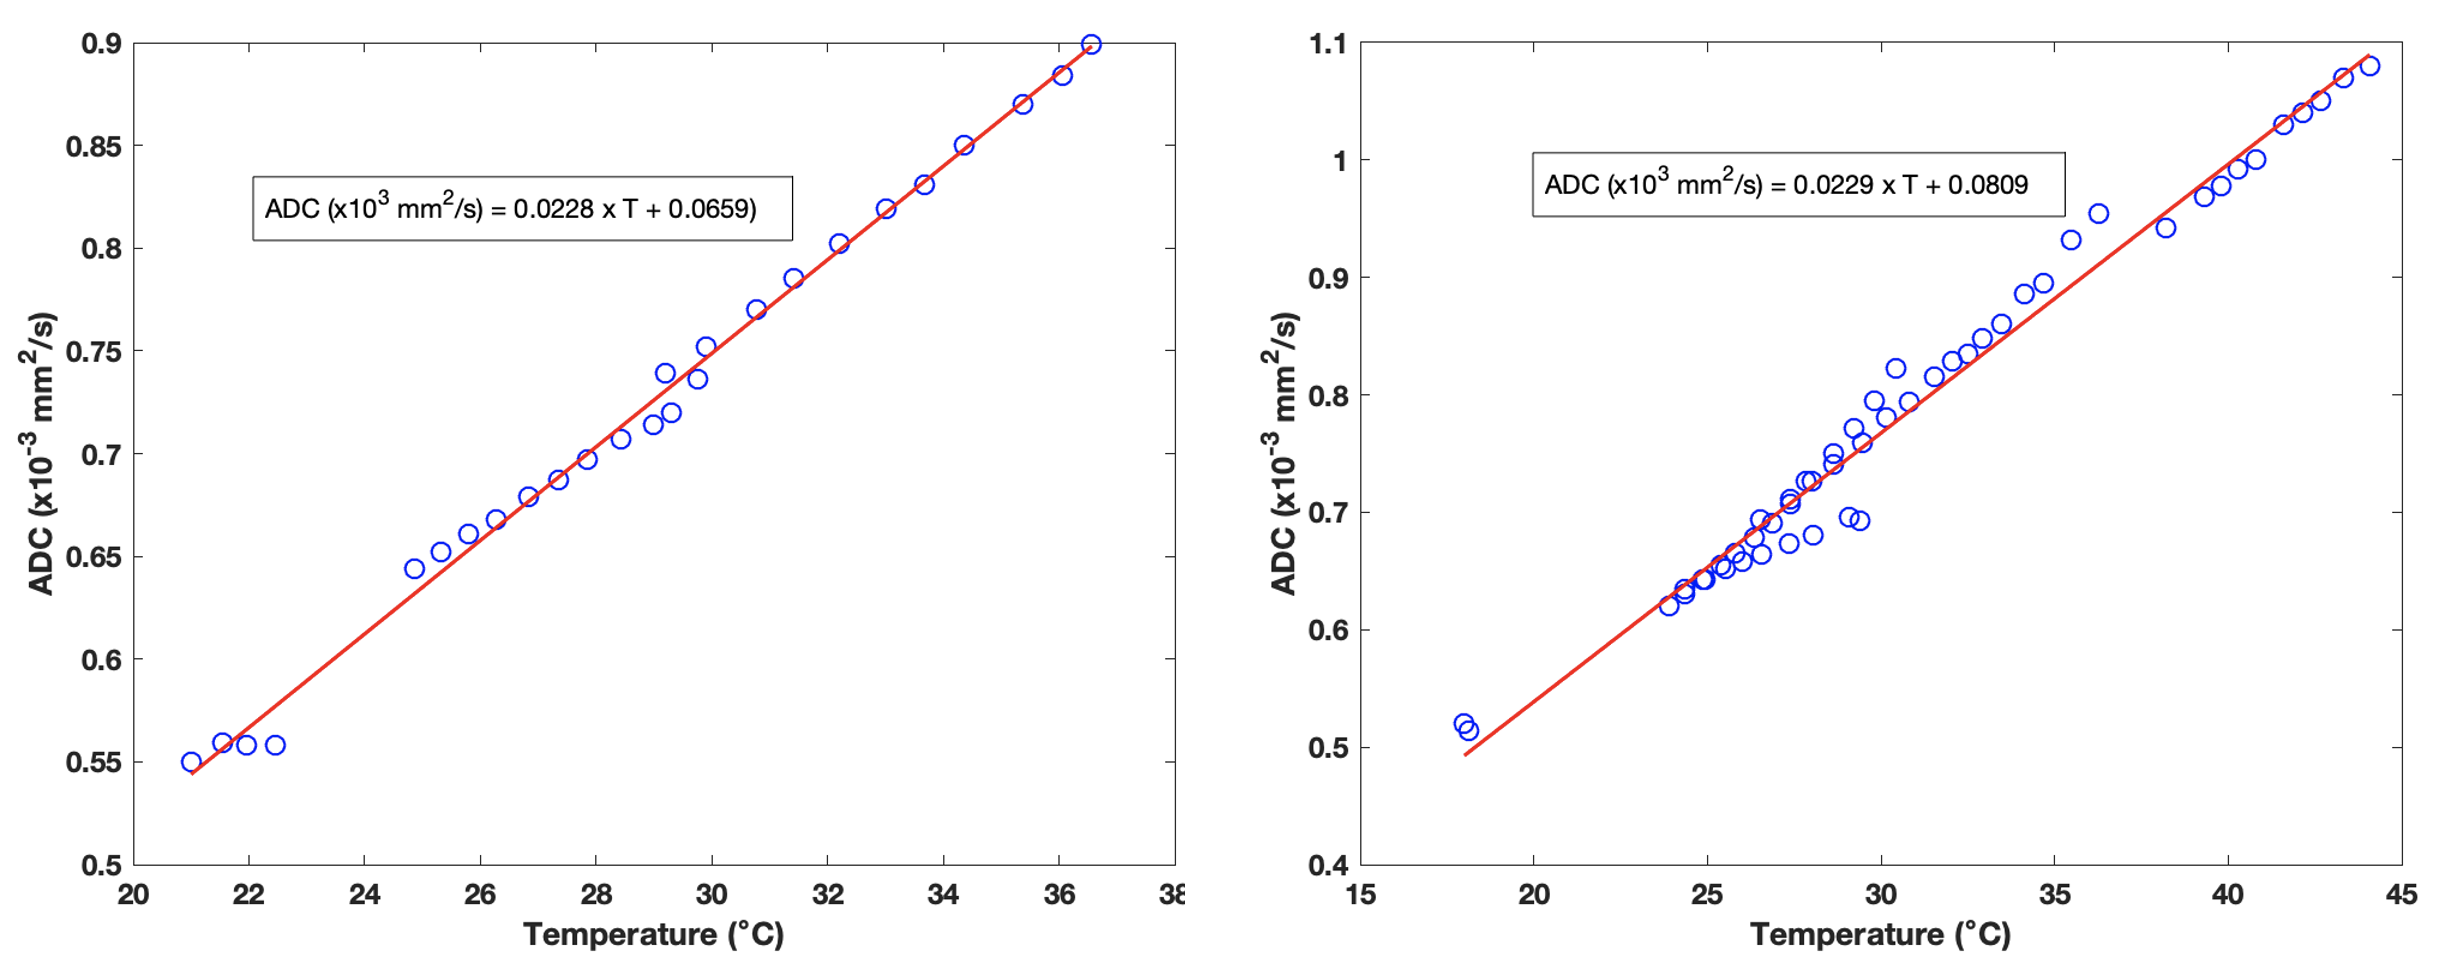
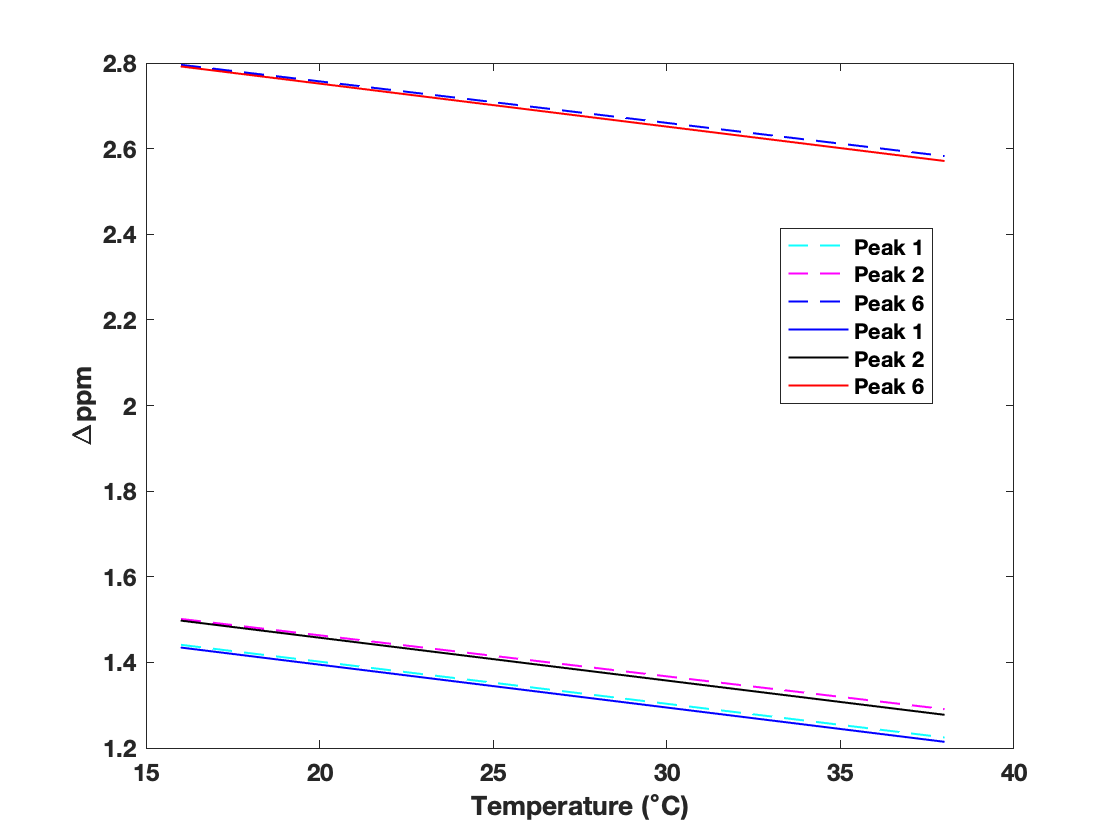
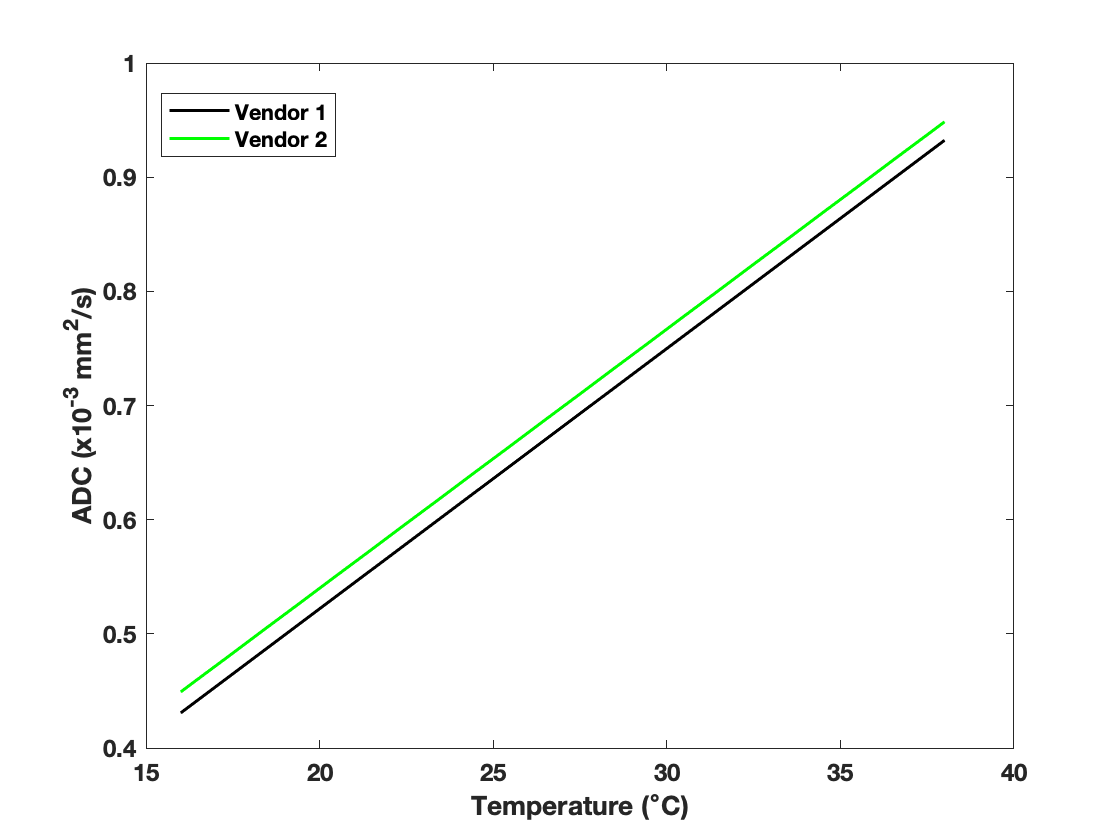
Figure 5: Linear fit for ADC values obtained from two scanners (vendor 1 and vendor 2) showed a mean bias of 0.0177x10⁻³ mm2/s over 16-38°C temperature range.