5088
Modeling and selection of T1 and T2 tissue mimics for 0.0065T, 0.064T, 0.55T MRI using agarose with manganese, gadolinium, copper, or nickel1NIST: National Institute of Standards and Technology, Boulder, CO, United States, 2Ming Hsieh Department of Electrical and Computer Engineering, University of Southern California, Los Angeles, CA, United States, 3Athinoula A. Martinos Center for Biomedical Imaging, Massachusetts General Hospital and Harvard Medical School, Boston, MA, United States, 4Hyperfine, Inc., Guilford, CT, United States, 5Department of Physics, Harvard University, Cambridge, MA, United States
Synopsis
Keywords: Quantitative Imaging, Relaxometry
There is re-emerging interest in MRI fields ≤0.55T as well as quantitative MRI (qMRI) methods. Physiologically relevant reference objects are needed to adapt qMRI techniques to lower fields.
We investigate materials as tissue mimics for brain imaging at 0.0065T, 0.064T, 0.55T, for white matter, gray matter, fat, cerebrospinal fluid, and blood. We create samples composed of agarose and paramagnetic salts and measure relaxation across field strengths. Samples suitable to mimic each tissue are presented for each field strength. This work will facilitate qMRI development for fields ≤0.55T by providing accessible mimic compositions to the community.
Introduction
There is re-emerging interest in MRI fields ≤0.55T as alternatives to conventional MRI (1.5-7T) due to lower cost and greater accessibility1. Quantitative MRI (qMRI) methods are increasingly used to differentiate tissue2 and have promising clinical utility3,4. Tissue properties may vary with field strength, necessitating physiologically relevant reference objects to adapt qMRI techniques to diverse fields1,5.We investigate materials as tissue mimics for brain imaging at 0.0065T, 0.064T, 0.55T, using literature reviews to extrapolate target tissue T1 and T2 for white matter (WM), gray matter (GM), fat, cerebrospinal fluid (CSF), and blood. We create samples composed of agarose and paramagnetic salts and measure relaxation across field strengths. From these results we suggest mimic compositions for each tissue and field. This work will facilitate qMRI development for fields ≤0.55T by providing accessible mimic compositions to the community.
Methods
Data AcquisitionTarget T1 and T2 values for each tissue (WM, GM, CSF, fat, blood) were extrapolated from literature measurements from a variety of similar field strengths (data not shown)6-26.
Chemical samples were prepared by dissolving stock solutions of metal compounds (CuSO4·5H2027, GdCl3·6H2028-EDTA29, MnCl2·4H2030, NiCl2·6H2031) into distilled water. GdCl3-EDTA was made by stirring a GdCl3 and EDTA solution on a 98C hotplate for 30 minutes. Dry agarose32 was weighed and added to the paramagnetic salt solution, followed by heat cycles: (1) 30s interval microwave cycle until boiling; (2) 10-minute hotplate cycle to ensure well-hydrated agarose. Distilled water was added to the mixture to account for evaporation. The mixture was poured into 50ml, 30ml, or 2ml tubes, pre-washed with isopropyl alcohol.
The primary systems used to measure T1 and T2 for each field strength were: 0.0065T33,34; 0.064T (Hyperfine Swoop, hardware 1.8, software rc8.5.0); 0.55T (Siemens, prototype MAGNETOM Aera XQ). Supplemental measurements were acquired at 0.0065T and 0.55T using variable field NMR systems (Tecmag Redstone, TNMR software).
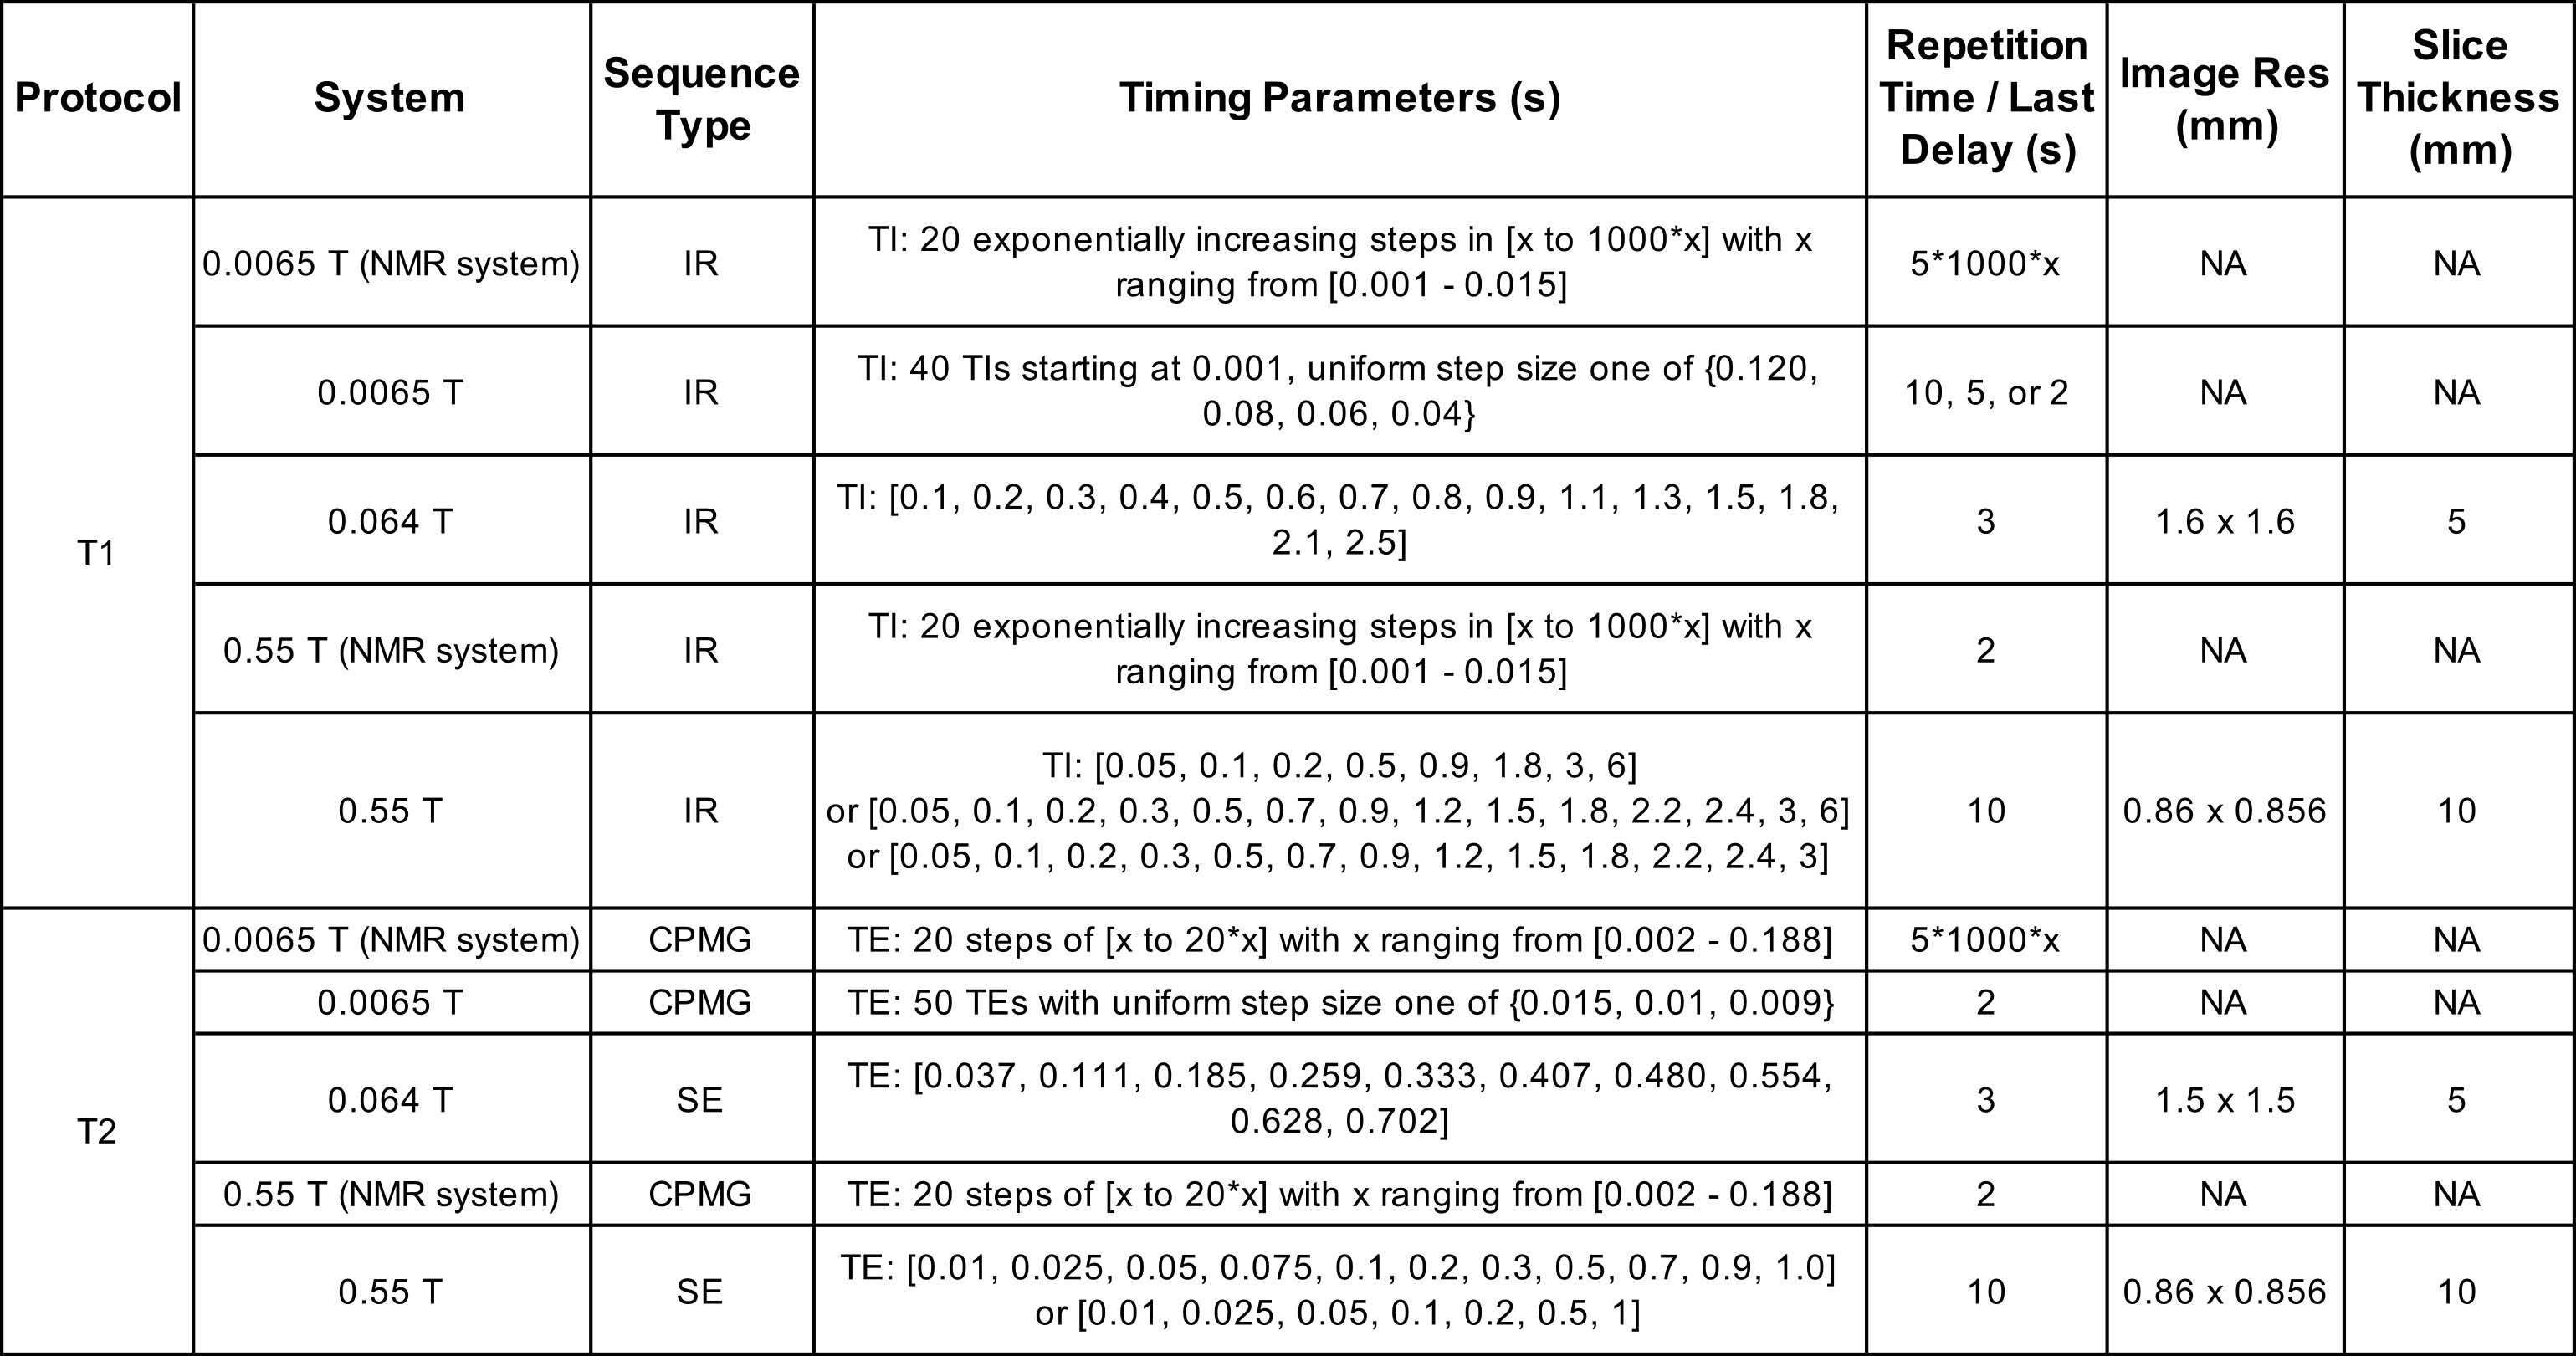
T1 was measured using inversion recovery protocols; T2 was measured using spin echo or Carr-Purcell-Meiboom-Gill (CPMG) sequences (see details in Figure 1). T1 was calculated using:
$$S_i=S_0(1-(1+d)e^{-TI/T1}+e^{-TR/T1})) \qquad (1)$$
with T1 the target value to fit, inversion time TI, repetition time TR, scale factor for imperfect inversion d, nominal signal intensity $$$S_0$$$, and measured signal intensity $$$S_i$$$. Similarly, T2 was calculated using:
$$S_i=S_0e^{-TE/T2} \qquad (2)$$
with T2 the target value to fit, and echo time TE.
Tissue Mimic Sample Selection
For each paramagnetic salt and field, a model was fit35,36 relating T1 and T2 to paramagnetic salt (N) and agarose (A) concentrations:
$$\frac{1}{T_1}=a_1+a_2A+a_3A^2+a_4N+a_5N^2+a_6AN+a_7A^2N+a_8AN^2+a_9A^2N^2 \qquad (3)$$
$$\frac{1}{T_2}=b_1+b_2A+b_3A^2+b_4N+b_5N^2+b_6AN+b_7A^2N+b_8AN^2+b_9A^2N^2 \qquad (4)$$
An agarose-only model limited to the first three terms of Eq 3-4 was fit to establish values for coefficients {a,b}1-3. A metal-only model was fit to establish {a,b}1,4-5. The average from the two fits for {a,b}1 is used. These coefficients {a,b}1-5 were fixed when modeling Eq 3-4 with all terms. Each fitting used Python’s lmfit package. Coefficients were constrained as ≥0, and small coefficients of magnitude ≤1e-4 were zeroed (no appreciable effect was observed in the fit).
To calculate sample concentrations for each target tissue mimic, Python sympy was used to solve the inverse of Eq 3-4 for each target value and field. For targets lying entirely outside the sample space, mimics for T1 and T2 were calculated individually.
Results
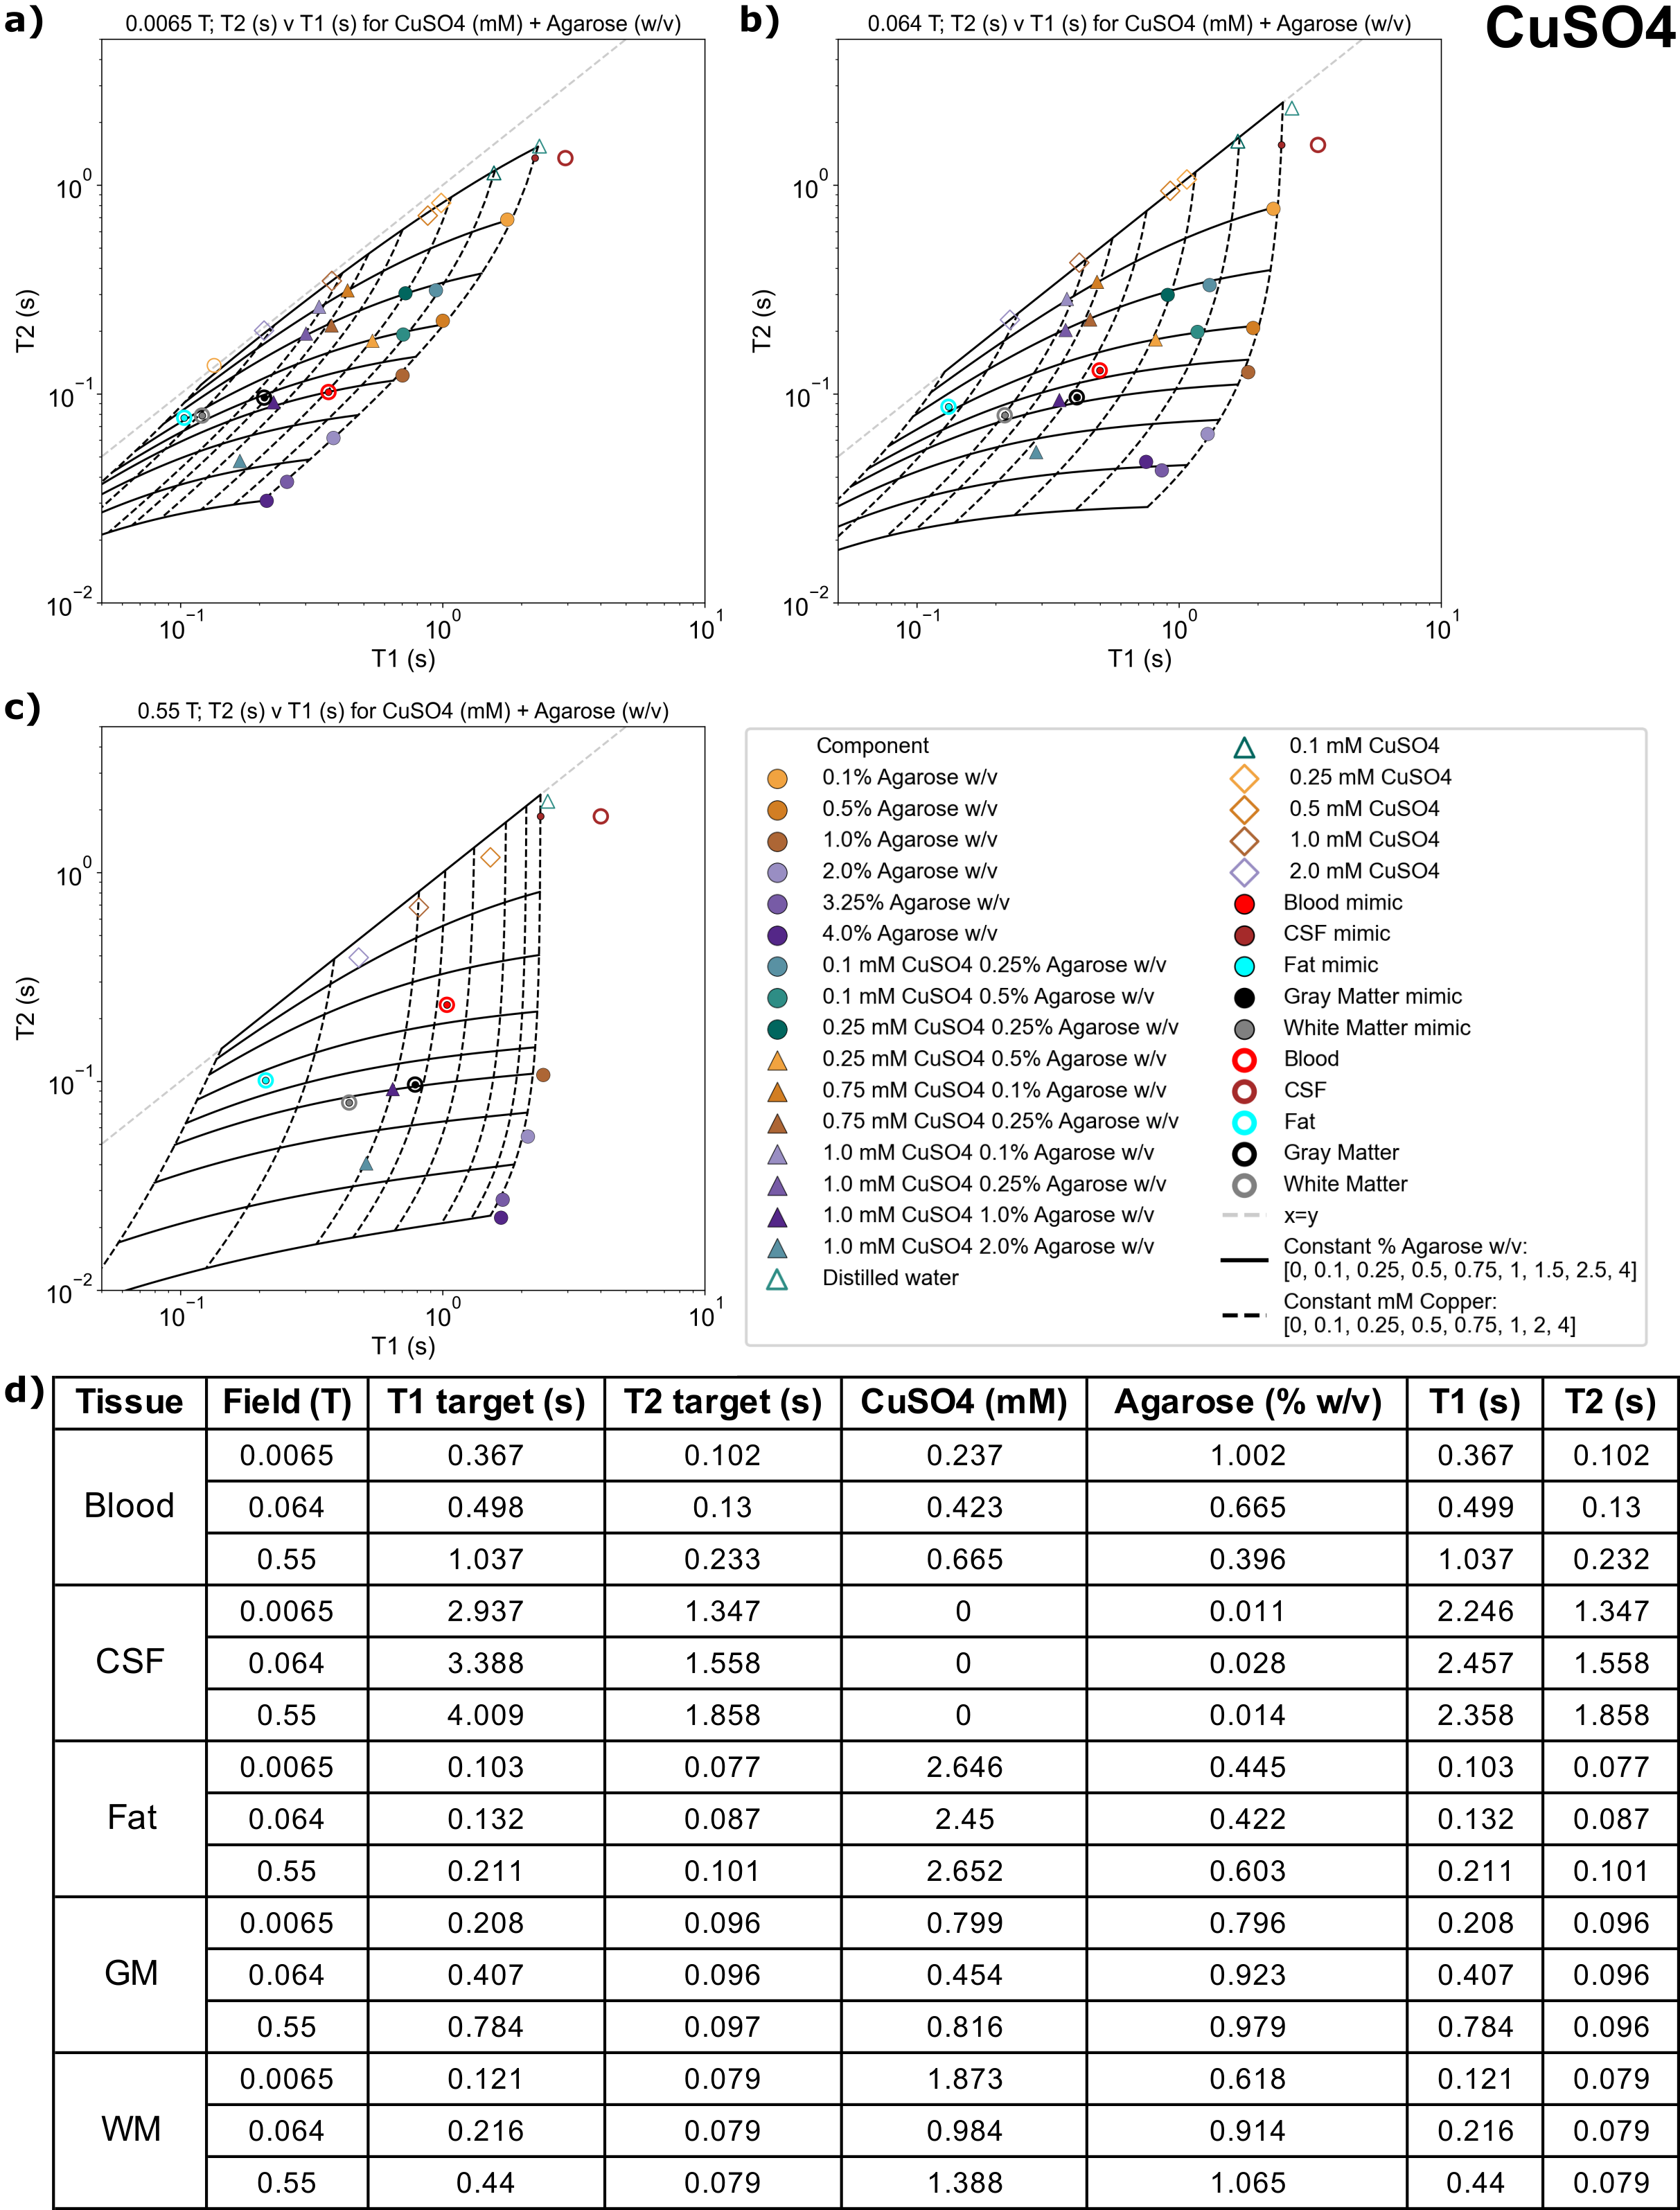
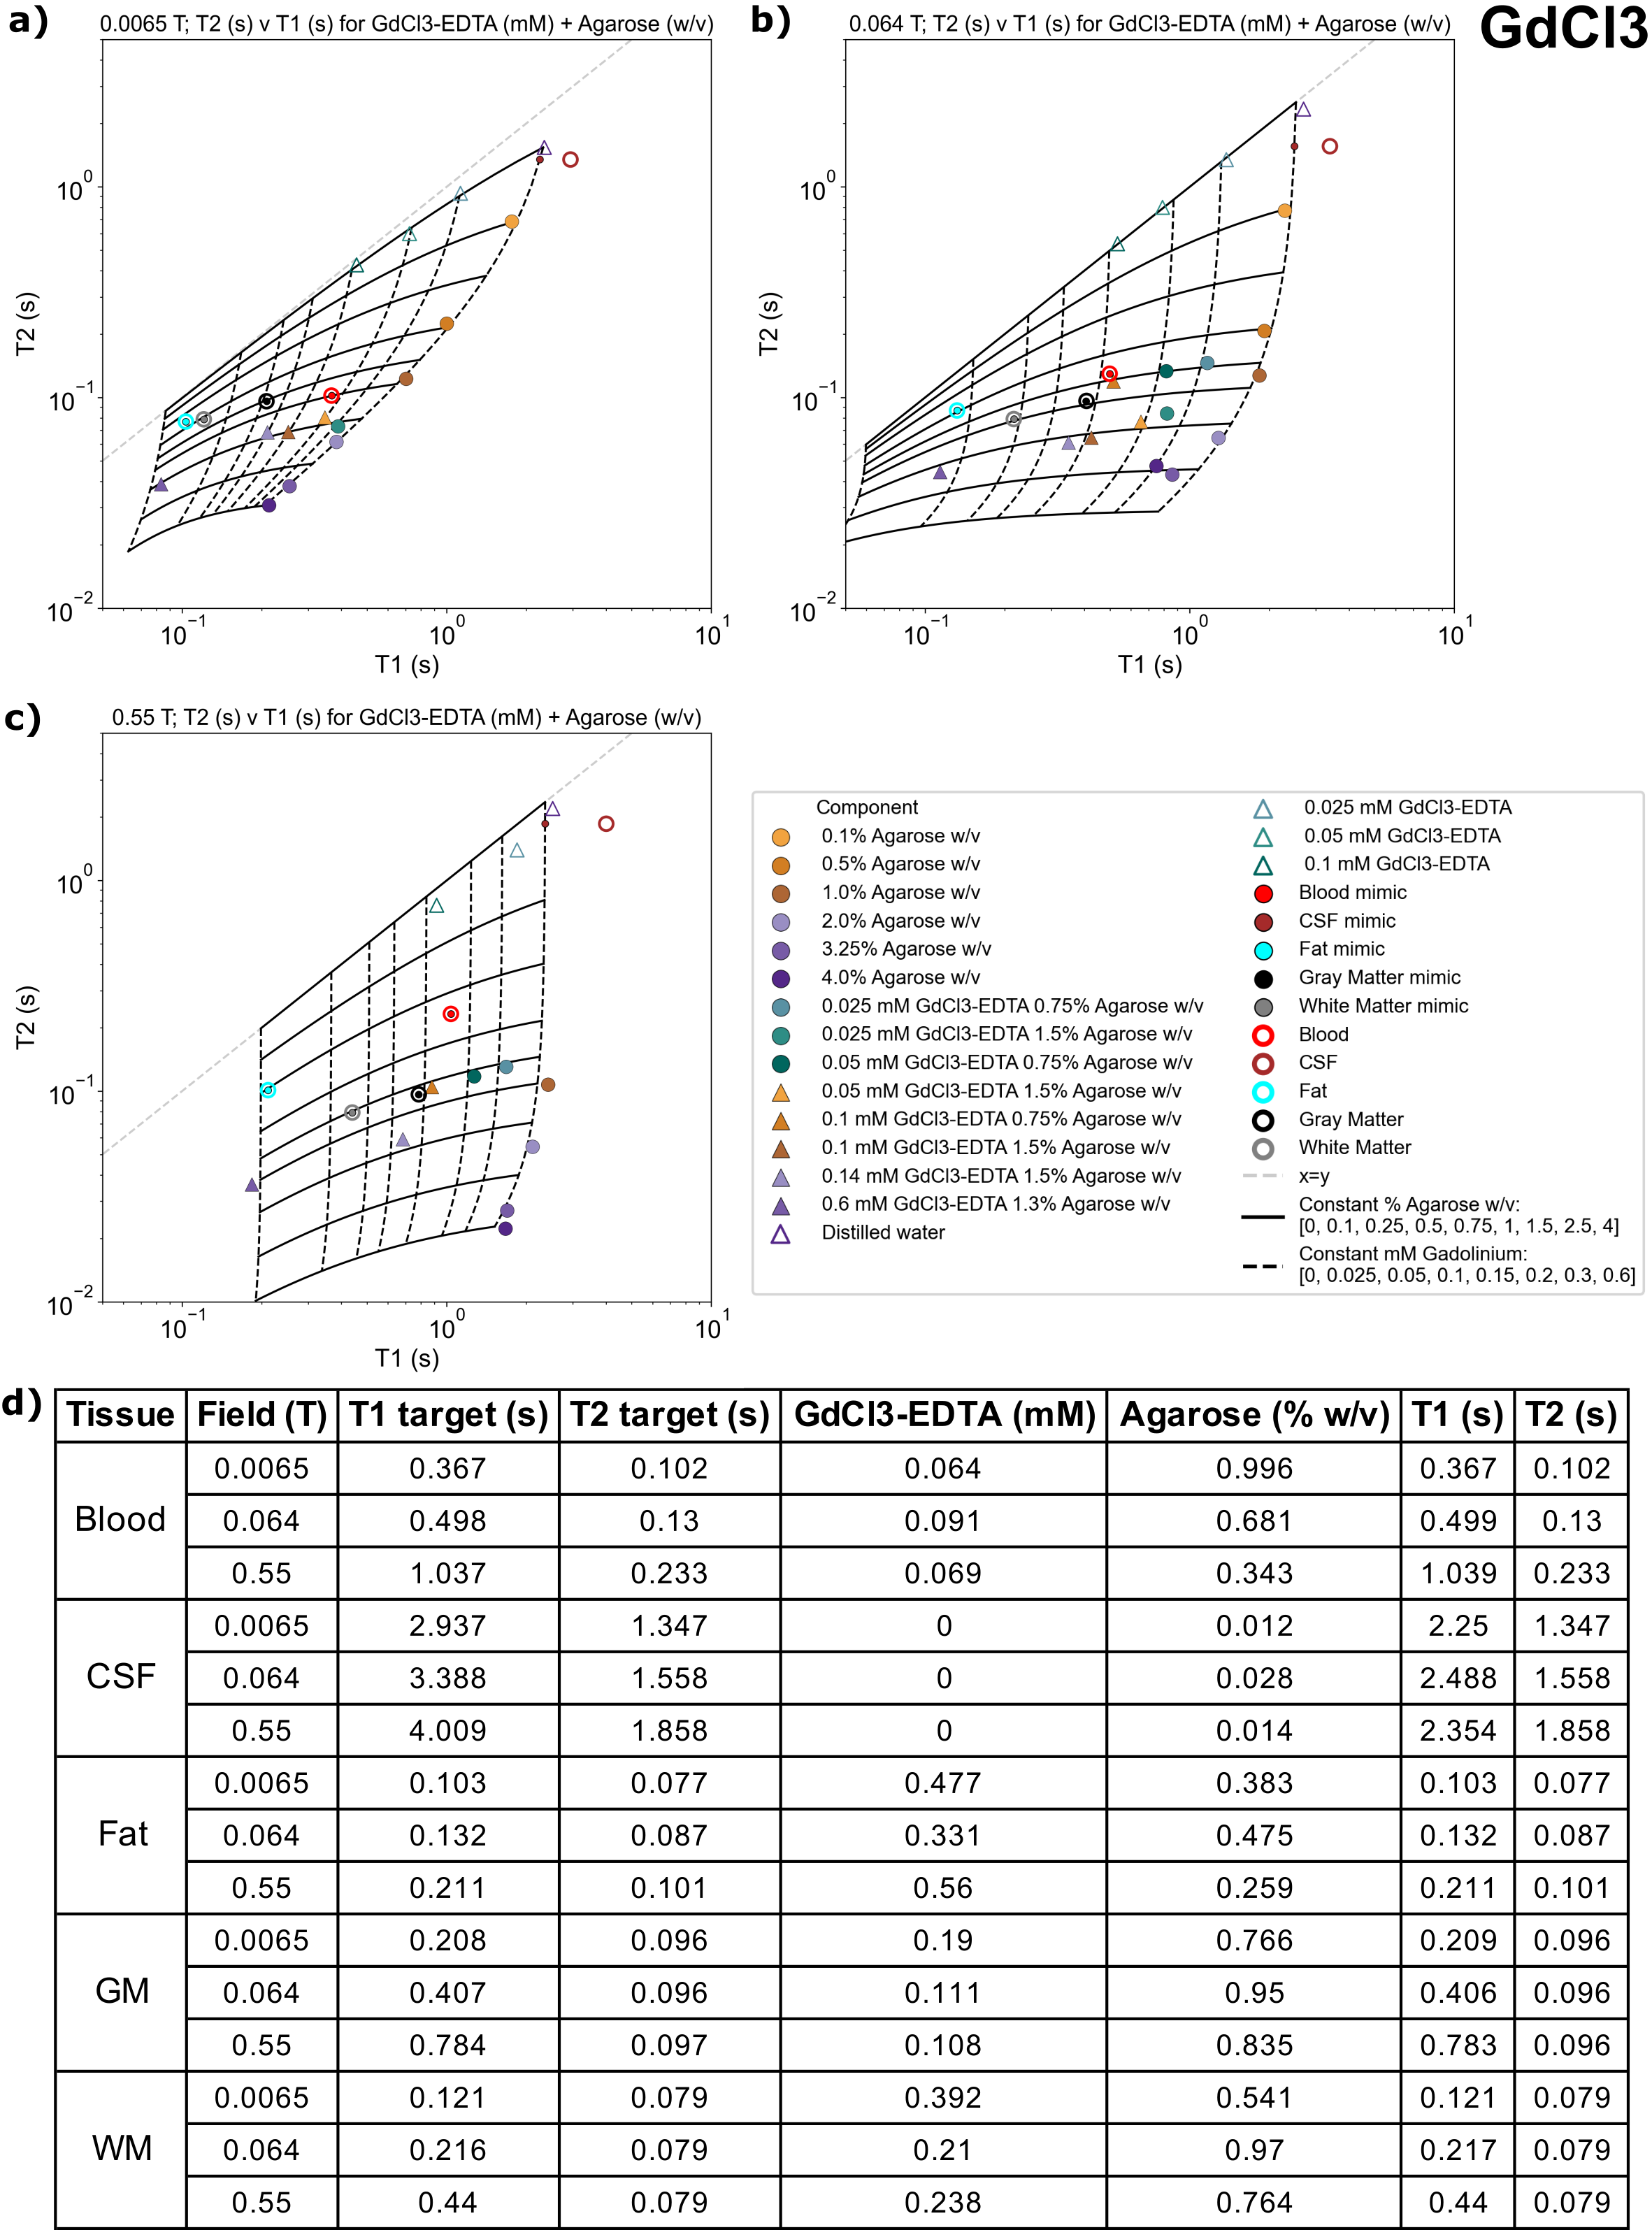
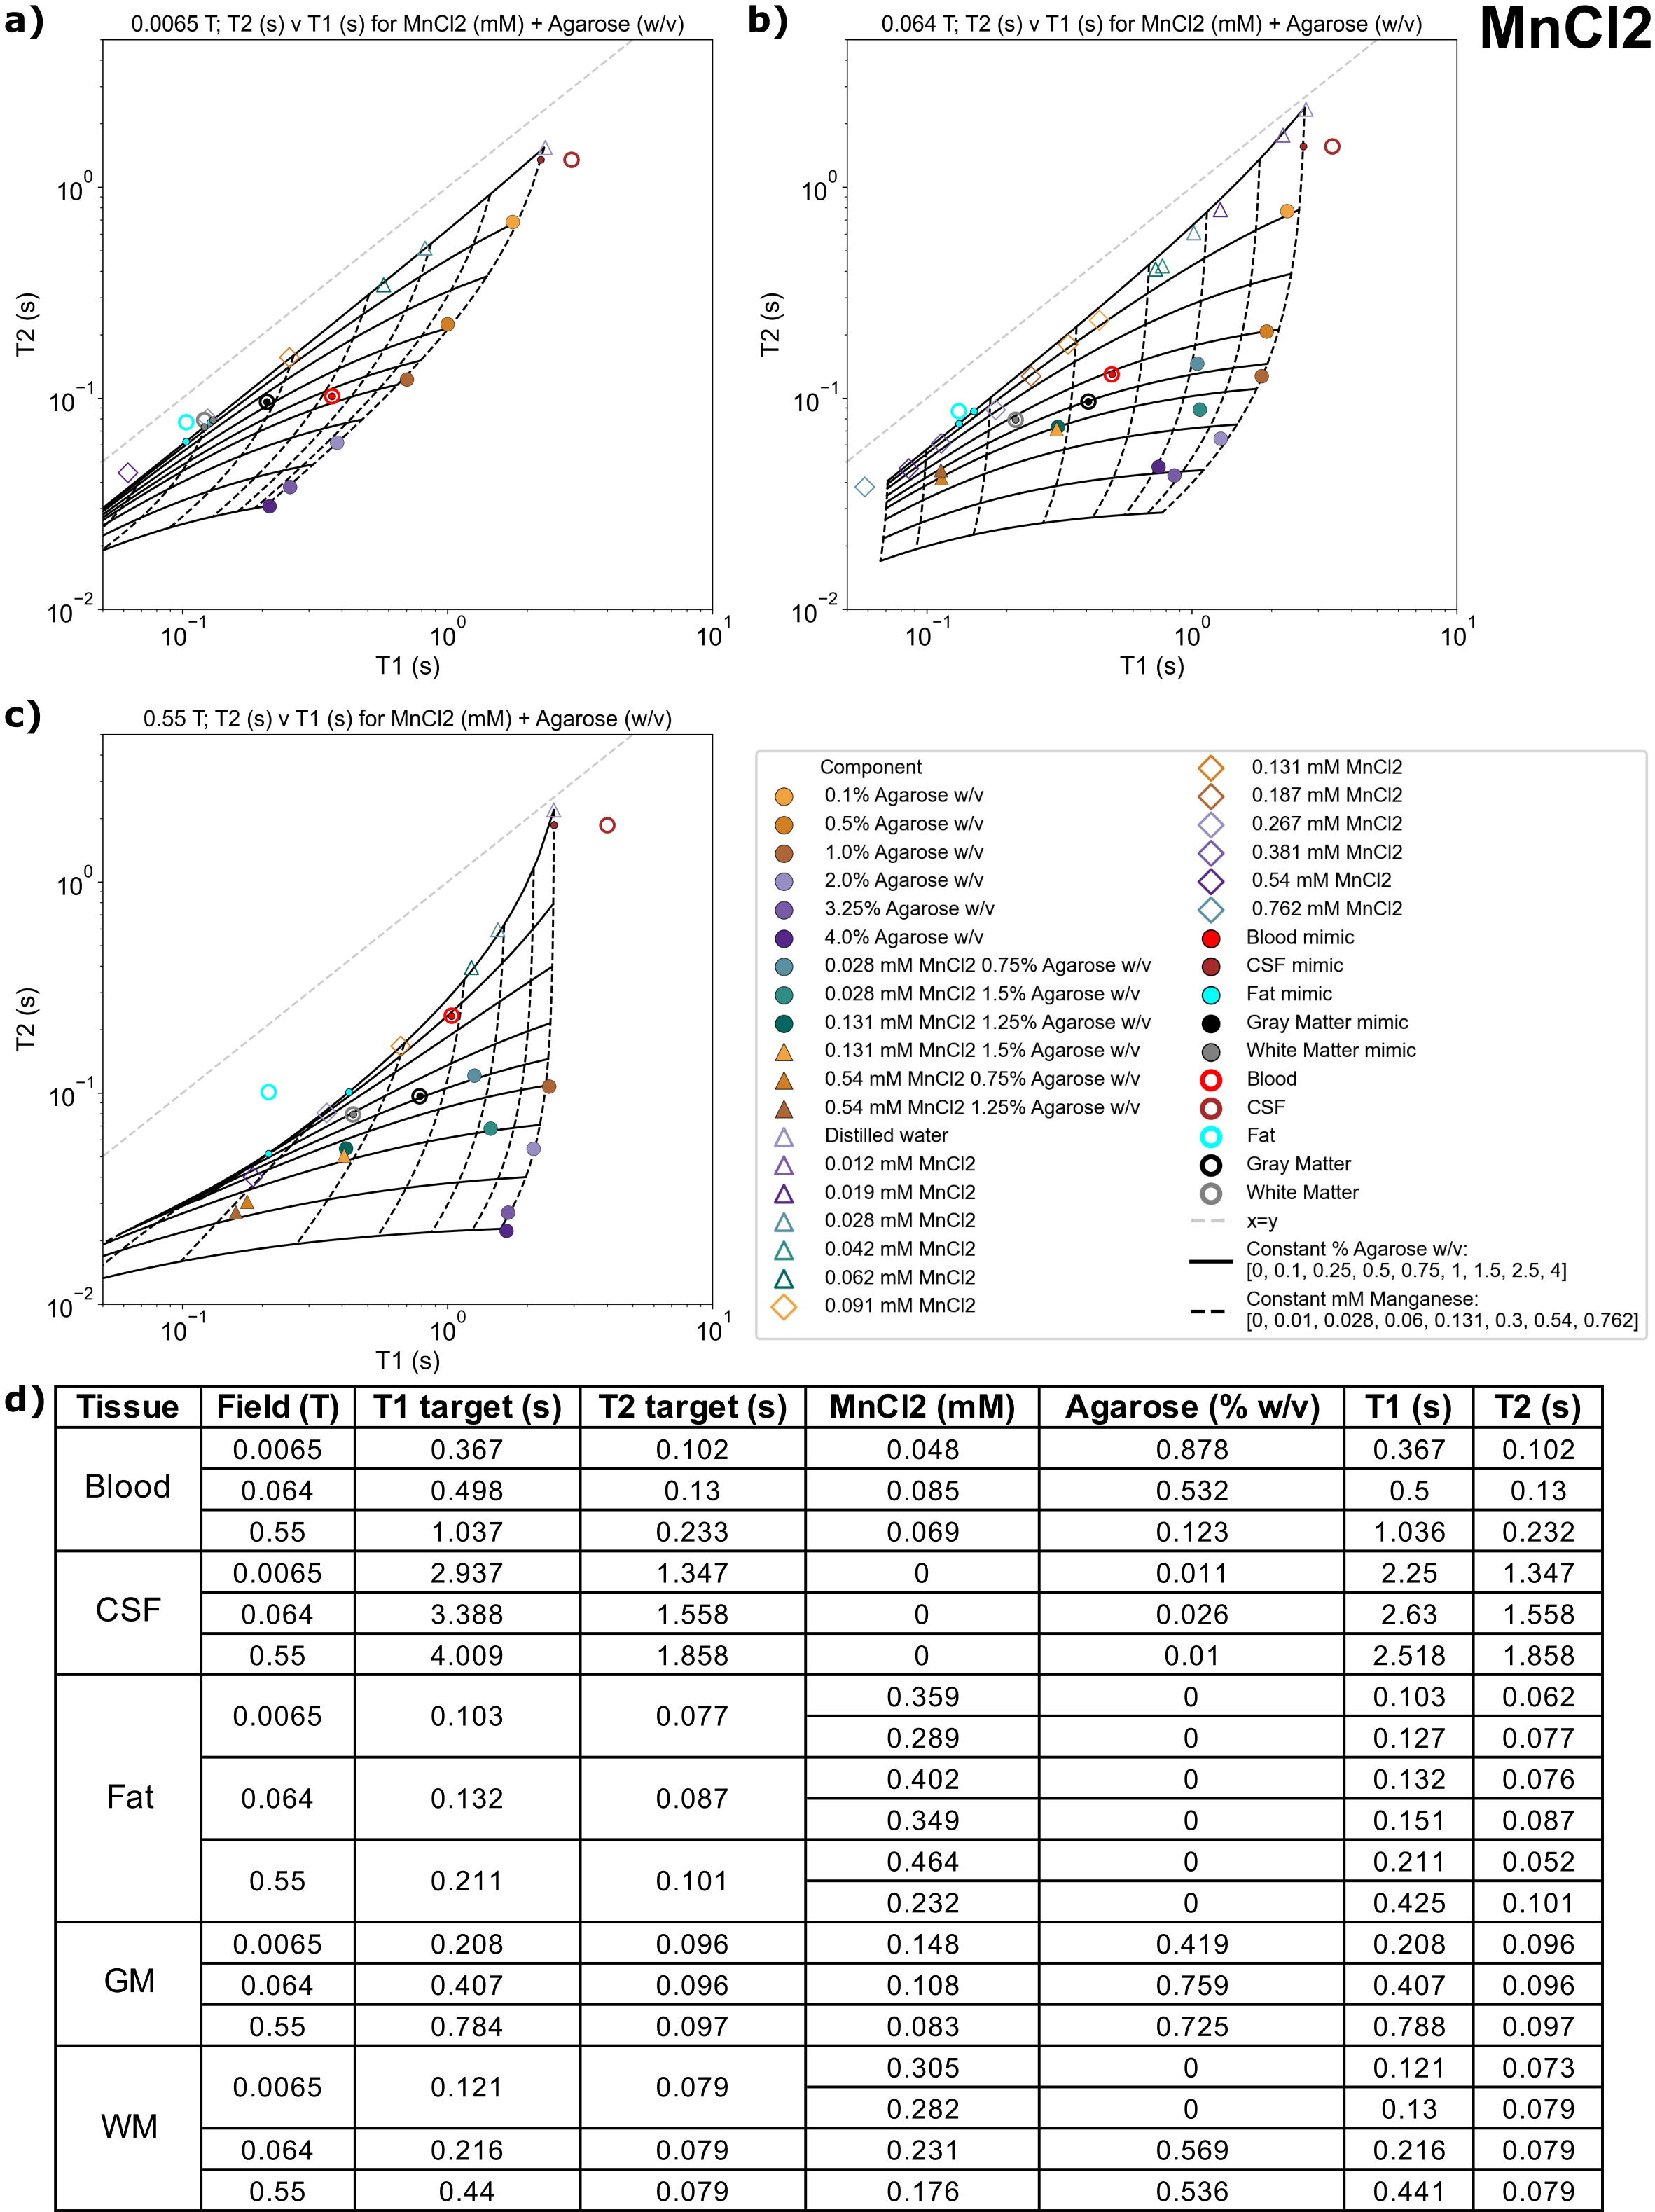
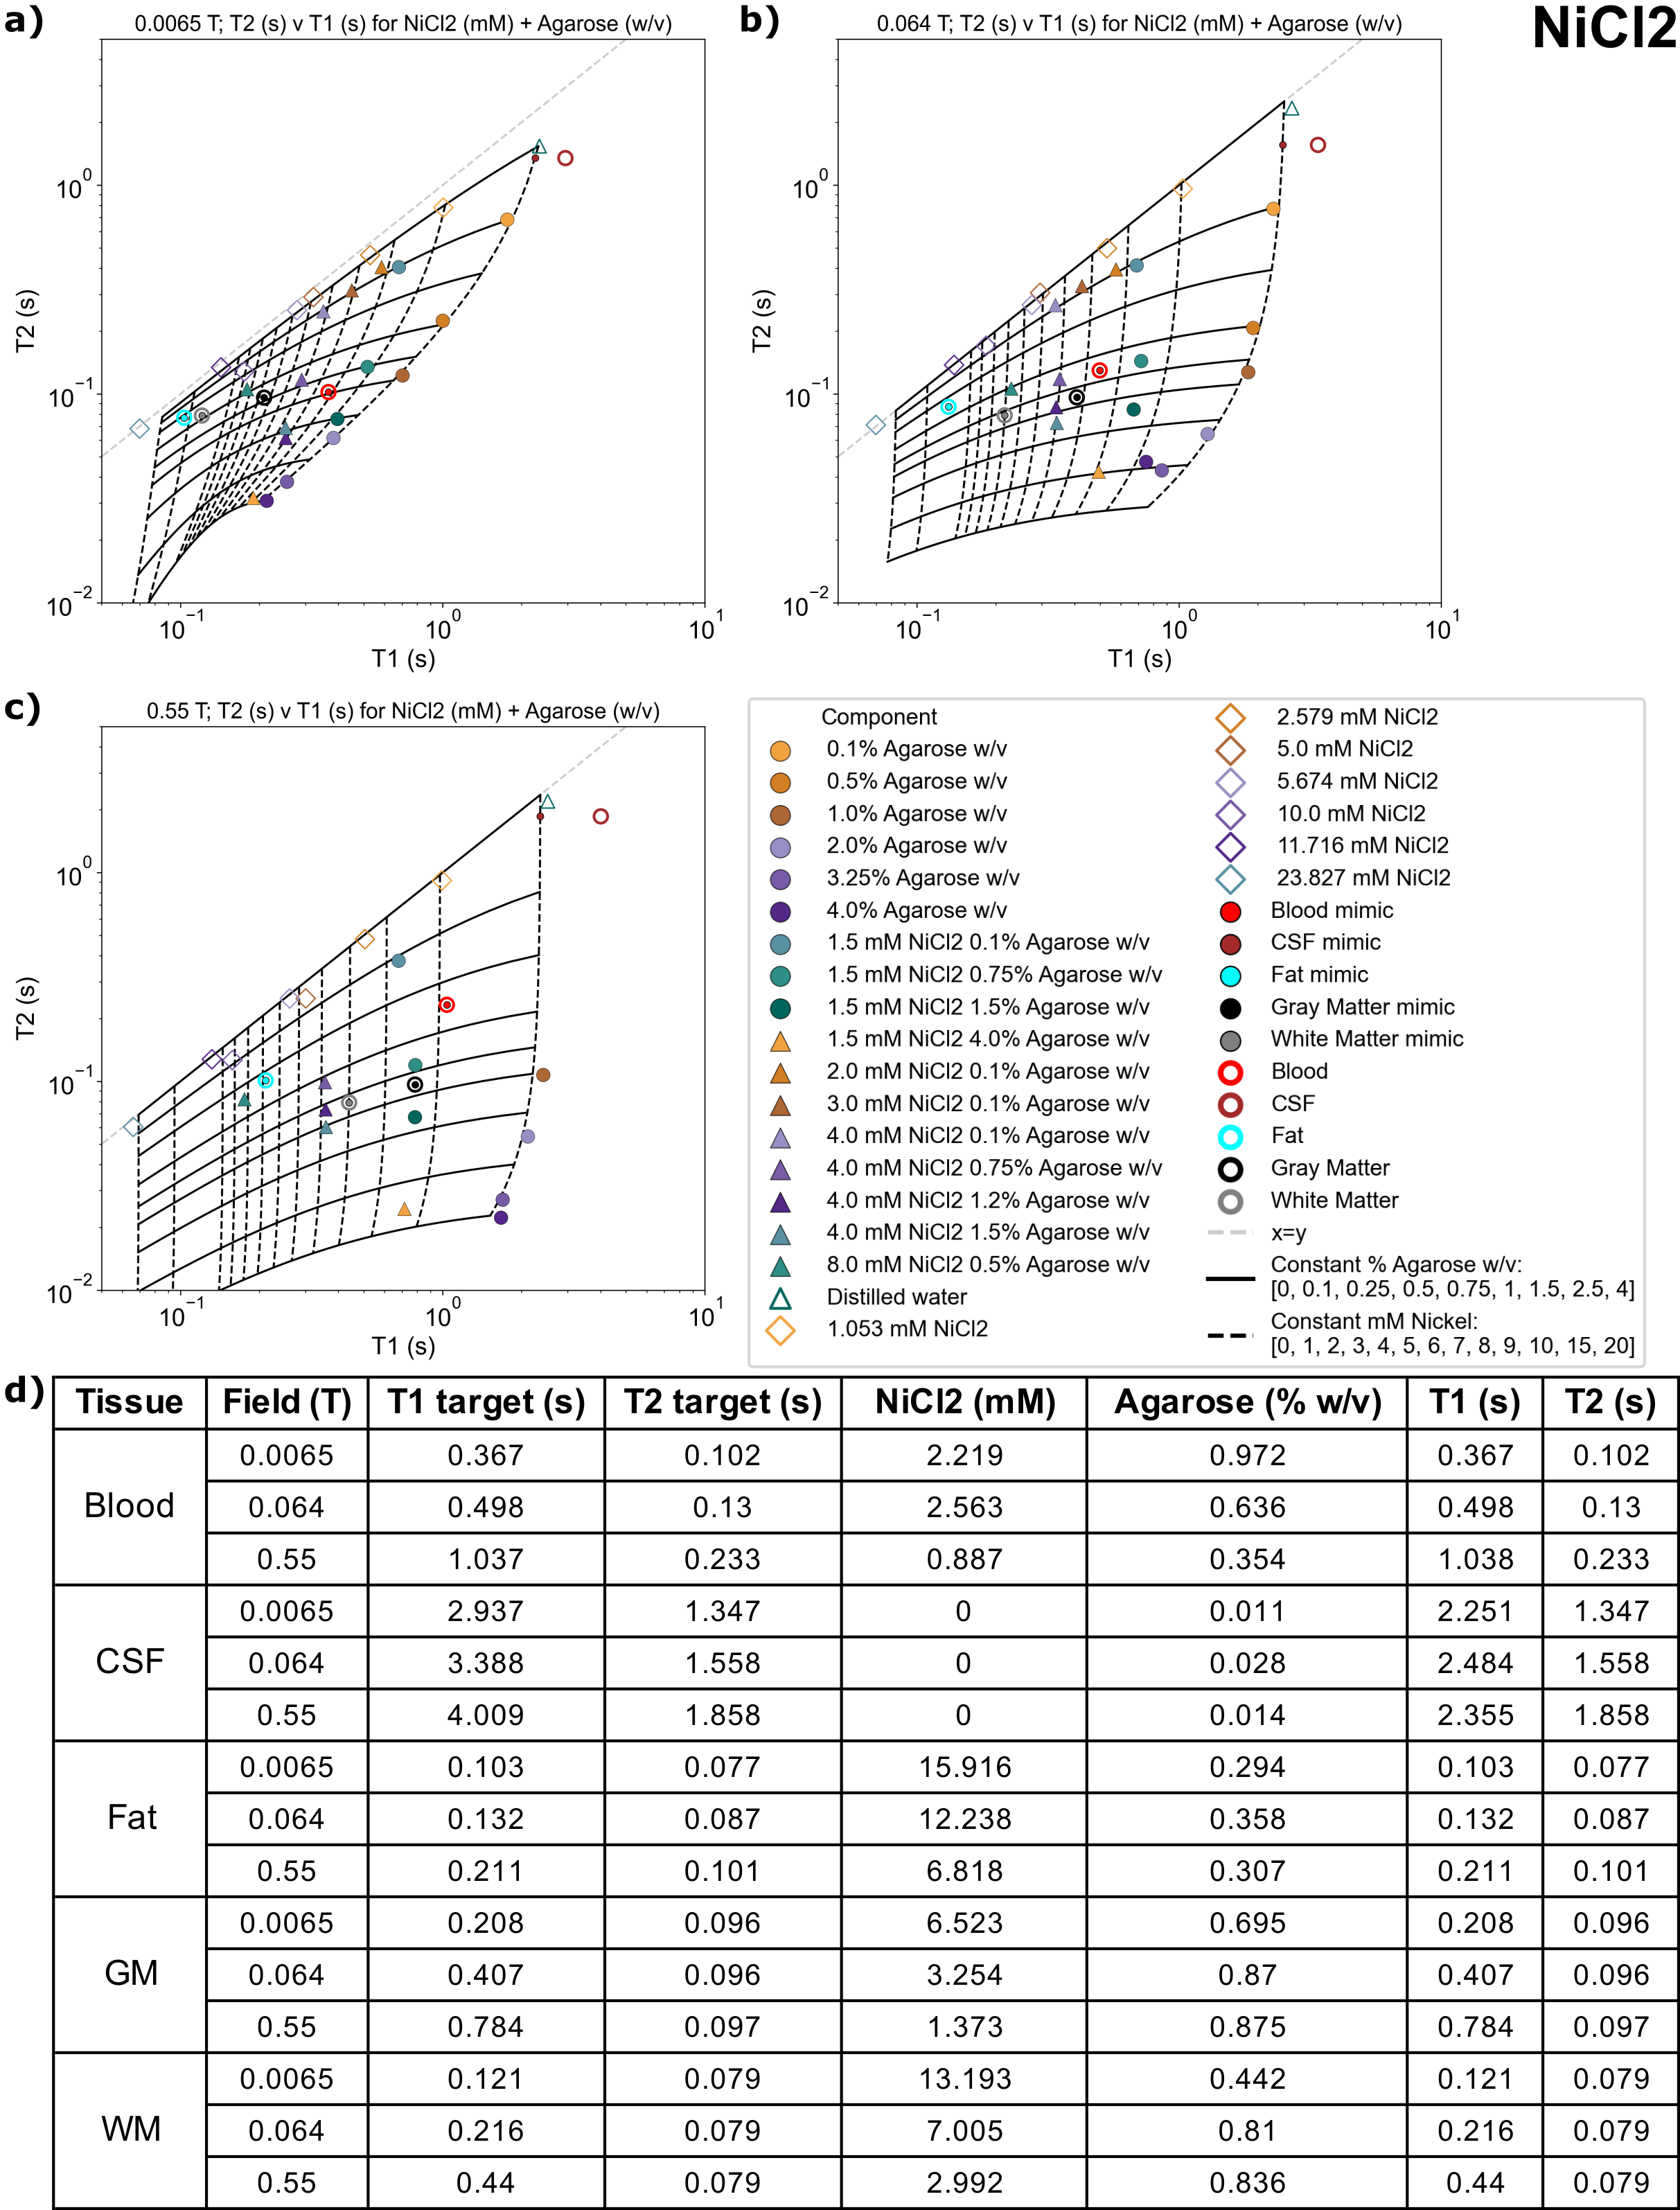
Figures 2-5(a-c) show sample T1 and T2 measurements for each field, for each paramagnetic salt and agarose combination. Additionally, the fits to Eq 3-4 are plotted as lines indicating constant agarose or constant salt. Target tissue T1 and T2 are plotted for each field (open circles), and sample mimics selected for each tissue are shown (small closed circles).Tables in Figures 2-5(d) indicate each tissue mimic’s salt and agarose concentrations for each field.
Discussion and Conclusion
Suitable tissue mimics were selected for 0.0065T, 0.064T, and 0.55T, for blood, fat, CSF, WM, and GM (Figures 2-5(d)). Most tissues have a suitable mimic for each chemical composition and field.Some tissues lie outside of the T1-T2 sample space; CSF always falls into this category. This is expected, as the body temperature of 37C leads to elevated T1, which can be difficult or even impossible to mimic at the typically much-lower laboratory temperature of phantom samples. Although lab temperature distilled water has a lower T1 than CSF, it may be the best mimic for all field strengths, since most of the modeled mimics use very small amounts of agarose that may be difficult to manufacture. Additionally, fat is difficult to mimic using the MnCl2 mixtures due to reduced T2 of the samples; therefore, samples mimicking either T1 or T2 of fat using MnCl2 were provided.
T1 and T2 models as a function of paramagnetic salt and agarose concentrations were created using Eq 3-4. These are purely empirical models, and improvements can be made by including relaxation physics.
By providing multiple mimics for the same target tissue at each field strength, we aim to increase accessibility to accurate phantom materials, encouraging more studies and ultimately clinical utility for qMRI.
Acknowledgements
MSR acknowledges the gracious support of the Kiyomi and Ed Baird MGH Research Scholar Award. This work was supported in part by 1R21CA267315-01A1 (PIs Rosen and Keenan).
NIST acknowledges research funding from the National Research Council Postdoctoral Fellowship.
The USC authors acknowledge grant support from the National Science Foundation and National Institutes of Health, and research support from Siemens Healthineers.
References
- Marques JP, Simonis FFJ, Webb AG. Low‐field MRI: An MR physics perspective. J Magn Reson Imaging. 2019;49(6):1528-1542. doi:10.1002/jmri.26637
- Rosenkrantz AB, Mendiratta-Lala M, Bartholmai BJ, et al. Clinical utility of quantitative imaging. Acad Radiol. 2015;22(1):33-49. doi:10.1016/j.acra.2014.08.011
- Tofts PS, du Boulay EP. Towards quantitative measurements of relaxation times and other parameters in the brain. Neuroradiology. 1990;32(5):407-415. doi:10.1007/BF00588474
- Bojorquez JZ, Bricq S, Acquitter C, Brunotte F, Walker PM, Lalande A. What are normal relaxation times of tissues at 3 T? Magnetic Resonance Imaging. 2017;35:69-80. doi:10.1016/j.mri.2016.08.021
- Keenan KE, Delfino JG, Jordanova KV, et al. Challenges in ensuring the generalizability of image quantitation methods for MRI. Med Phys. Published online September 29, 2021:mp.15195. doi:10.1002/mp.15195
- Lacomis D, Osbakken M, Gross G. Spin-lattice relaxation (T1) times of cerebral white matter in multiple sclerosis. Magn Reson Med. 1986;3(2):194-202. doi:10.1002/mrm.1910030203
- Hopkins AL, Yeung HN, Bratton CB. Multiple field strength in vivo T1 and T2 for cerebrospinal fluid protons. Magn Reson Med. 1986;3(2):303-311. doi:10.1002/mrm.1910030214
- Breger RK, Wehrli FW, Charles HC, MacFall JR, Haughton VM. Reproducibility of relaxation and spin-density parameters in phantoms and the human brain measured by MR imaging at 1.5 T. Magn Reson Med. 1986;3(5):649-662. doi:10.1002/mrm.1910030502
- Santyr GE, Henkelman RM, Bronskill MJ. Spin locking for magnetic resonance imaging with application to human breast. Magn Reson Med. 1989;12(1):25-37. doi:10.1002/mrm.1910120104
- Koenig SH, Brown RD, Spiller M, Lundbom N. Relaxometry of brain: Why white matter appears bright in MRI. Magn Reson Med. 1990;14(3):482-495. doi:10.1002/mrm.1910140306
- Fischer HW, Rinck PA, Van Haverbeke Y, Muller RN. Nuclear relaxation of human brain gray and white matter: analysis of field dependence and implications for MRI. Magn Reson Med. 1990;16(2):317-334. doi:10.1002/mrm.1910160212
- Stanisz GJ, Odrobina EE, Pun J, et al. T1, T2 relaxation and magnetization transfer in tissue at 3T. Magnetic Resonance in Medicine. 2005;54(3):507-512. doi:10.1002/mrm.20605
- Rooney WD, Johnson G, Li X, et al. Magnetic field and tissue dependencies of human brain longitudinal1H2O relaxation in vivo. Magn Reson Med. 2007;57(2):308-318. doi:10.1002/mrm.21122
- Zhang X, Petersen ET, Ghariq E, et al. In vivo blood T1 measurements at 1.5 T, 3 T, and 7 T. Magnetic Resonance in Medicine. 2013;70(4):1082-1086. doi:10.1002/mrm.24550
- Pohmann R, Speck O, Scheffler K. Signal‐to‐noise ratio and MR tissue parameters in human brain imaging at 3, 7, and 9.4 tesla using current receive coil arrays. Magn Reson Med. 2016;75(2):801-809. doi:10.1002/mrm.25677
- O’Reilly T, Teeuwisse WM, Gans D, Koolstra K, Webb AG. In vivo 3D brain and extremity MRI at 50 mT using a permanent magnet Halbach array. Magn Reson Med. 2021;85(1):495-505. doi:10.1002/mrm.28396
- Bödenler M, Maier O, Stollberger R, et al. Joint multi-field T1 quantification for fast field-cycling MRI. Magnetic Resonance in Medicine. 2021;86(4):2049-2063. doi:10.1002/mrm.28857
- Broche LM, Ross PJ, Davies GR, MacLeod MJ, Lurie DJ. A whole-body Fast Field-Cycling scanner for clinical molecular imaging studies. Sci Rep. 2019;9(1):10402. doi:10.1038/s41598-019-46648-0
- Masiewicz E, Ashcroft GP, Boddie D, Dundas SR, Kruk D, Broche LM. Towards applying NMR relaxometry as a diagnostic tool for bone and soft tissue sarcomas: a pilot study. Sci Rep. 2020;10(1):14207. doi:10.1038/s41598-020-71067-x
- Zotev VS, Matlashov AN, Savukov IM, et al. SQUID-Based Microtesla MRI for In Vivo Relaxometry of the Human Brain. IEEE Transactions on Applied Superconductivity. 2009;19(3):823-826. doi:10.1109/TASC.2009.2018764
- Bottomley PA, Foster TH, Argersinger RE, Pfeifer LM. A review of normal tissue hydrogen NMR relaxation times and relaxation mechanisms from 1-100 MHz: dependence on tissue type, NMR frequency, temperature, species, excision, and age. Med Phys. 1984;11(4):425-448. doi:10.1118/1.595535
- Campbell-Washburn AE, Ramasawmy R, Restivo MC, et al. Opportunities in Interventional and Diagnostic Imaging by Using High-Performance Low-Field-Strength MRI. Radiology. 2019;293(2):384-393. doi:10.1148/radiol.2019190452
- Just M, Thelen M. Tissue characterization with T1, T2, and proton density values: results in 160 patients with brain tumors. Radiology. 1988;169(3):779-785. doi:10.1148/radiology.169.3.3187000
- van Leeuwen FHP, Lena B, Zwanenburg JJM, et al. Detecting low blood concentrations in joints using T1 and T2 mapping at 1.5, 3, and 7 T: an in vitro study. European Radiology Experimental. 2021;5(1):51. doi:10.1186/s41747-021-00251-z
- Bydder GM, Steiner RE, Young IR, et al. Clinical NMR imaging of the brain: 140 cases. AJR Am J Roentgenol. 1982;139(2):215-236. doi:10.2214/ajr.139.2.215
- Komiyama M, Yagura H, Baba M, et al. MR imaging: possibility of tissue characterization of brain tumors using T1 and T2 values. AJNR Am J Neuroradiol. 1987;8(1):65-70.
- Millipore-Sigma, St. Louis, MO, USA; Part number: 209198.
- Millipore-Sigma, St. Louis, MO, USA; Part number: 203289.
- Millipore-Sigma, St. Louis, MO, USA; Part number: 324503.
- Millipore-Sigma, St. Louis, MO, USA; Part number: 221279.
- Millipore-Sigma, St. Louis, MO, USA; Part number: N6136.
- Millipore-Sigma, St. Louis, MO, USA; Part number: A6013.
- DeVience SJ, Rosen MS. Homonuclear J-coupling spectroscopy using J-synchronized echo detection. Journal of Magnetic Resonance. 2022;341:107244. doi:10.1016/j.jmr.2022.107244
- Sarracanie M, LaPierre CD, Salameh N, Waddington DEJ, Witzel T, Rosen MS. Low-Cost High-Performance MRI. Sci Rep. 2015;5(1):15177. doi:10.1038/srep15177
- Hattori K, Ikemoto Y, Takao W, et al. Development of MRI phantom equivalent to human tissues for 3.0-T MRI. Medical Physics. 2013;40(3):032303. doi:10.1118/1.4790023
- Gopalan K, Tamir JI, Arias AC, Lustig M. Quantitative anatomy mimicking slice phantoms. Magnetic Resonance in Medicine. 2021;86(2):1159-1166. doi:10.1002/mrm.28740
Figures