5087
Inter-site variability observed in R1 maps of the brain generated from two-point inversion-recovery MRI1Department of Psychology, Neuroscience & Behaviour, McMaster University, Hamilton, ON, Canada, 2McConnell Brain Imaging Centre, Montreal Neurological Institute and Hospital, McGill University, Montreal, QC, Canada
Synopsis
Keywords: Quantitative Imaging, Challenges, Reproducibility
The longitudinal relaxation rate (R1) is deemed to be a suitable quantitative imaging metric for multi-site investigations as it describes a quantitative property of the tissue that can be measured, reproduced, and compared across sites when differences in hardware and acquisition settings are accounted for. Here, we present inter- and intra-vendor variability observed in whole-brain R1 maps generated from two-point inversion-recovery MRI data after accounting for variations in pulse sequences and B1+ field maps. We posit that this inter-site variability may be due to differential intensity scaling applied at acquisition and suggest a potential correction method using site-specific scaling factors.
Introduction
Multi-site investigations have the potential to increase statistical power in clinical studies by recruiting larger samples than is possible at a single site1. Techniques that estimate quantitative MRI parameters, such as the longitudinal relaxation rate (R1), are advisable for such studies because they theoretically only depend on physical tissue characteristics and field strength2. However, inter-scanner variation in sequence implementations and hardware configurations can introduce systemic differences to qMRI estimates3.Here, we present inter-site variability in whole-brain R1 maps created from two-point inversion-recovery MRI data collected using MRI scanners from GE and Siemens. We implement a ‘traveling heads’ protocol4 that reconciles these site differences.
Methods
Participants: MRI scans were collected at three sites, where two sites used 3T GE scanners (software v22.0) and one used a 3T Siemens scanner (TrioTim). Participants aged 16-45 years without any neuropsychiatric diagnoses were imaged at baseline and again at one and/or two years follow-up for a maximum of three scans per participant. A total of 63 baseline (34 females; mean age=30.0±8.0), 47 timepoint 2 (28 females), and 29 timepoint 3 (19 females) scans were included in analyses. For the traveling heads protocol, two additional female participants (mean age=24) completed a scan at each site.Image Acquisition: Images with isotropic resolution of 1 mm were acquired using a 32-channel receive-only RF head coil and a transmit body coil.
At GE sites, a 3D whole-brain T1-weighted (T1w) image was acquired using a 3D inversion-recovery gradient echo sequence (GE 3D BRAVO) to serve as an anatomical reference for image registration and segmentation (TI=450 ms, TE=3.06 ms, TR=7.916 ms, flip angle=12°). For R1 calculations. An image with high T1 contrast (T1wHC) image was collected with GE 3D BRAVO (TI=1100 ms, TE=3.06 ms, TR=7.16 ms, inversion pulse interval=2100 ms, flip angle=12°) and another image with low T1 contrast (T1wLC) was acquired using a 3D gradient-echo sequence (GE 3D SPGR), TE=3.06 ms, TR=7.908 ms, flip angle=4°. Lastly, a B1+ transit map was acquired using the Bloch-Siegert approach, TI=450 ms, TE=12.3 ms, TR=16 ms, flip angle=15°.
At the Siemens site, a whole-brain T1w anatomical image was collected with MPRAGE (TI=900 ms, TE=2.96 ms, TR=2300 ms, flip angle=9°), as well as the T1wHC image for R1 calculations (TI=1100 ms, TE=2.01 ms, TR=8.1 ms, inversion pulse interval=3650 ms, flip angle=12°). The T1wLC image was acquired using a turbo FLASH acquisition (TE=2.01 ms, TR=7.2 ms, flip angle=4°). A B1+ map was acquired using the double angle spin echo EPI approach (TE=46 ms, TR=5000 ms, flip angle=60°/120°).
Processing & Analyses: All images were non-linearly registered to the MNI152 standard space T1w average image using FSL and FreeSurfer5,6. The ratio between the T1wHC and T1wLC images was calculated for each scan7 and used to derive T1 estimates via lookup tables created from Bloch simulations8 with and without incorporating the B1+ maps to correct for residual B1+ field inhomogeneities. Resulting T1 values were used to calculate R1 = 1/T1.
To examine whether inter-site variability arose from B1+ field inhomogeneities, R1 maps with and without B1+ correction were averaged for each site, and histograms of R1 values across the whole brain were plotted using MATLAB. For the traveling heads scans collected at GE sites, the T1wHC/T1wLC ratio image was scaled with a range of values to determine site-specific scaling factors that resulted in minimal inter-site variation in R1 distributions. These scaling factors were then applied to the main dataset for a final set of R1 maps that were then averaged and plotted as detailed above.
Results
Inter-site variability in R1 estimates was present even after the B1+ maps were used in computations (Figure 1A & 1B); R1 estimates from the Siemens site resembled values reported in past literature most closely7,9–11, while the GE sites showed higher R1 values. Scaling factors of 0.92 and 0.86 for GE sites 1 and 2 respectively minimized differences between the R1 histograms for those sites and the Siemens site for the traveling heads data (Figure 2), and when applied to the main dataset, inter- and intra-vendor differences in R1 estimates decreased considerably (Figure 1C).Discussion
Despite accounting for different pulse sequences used and the B1+ transmit field in computation, inter- and intra-vendor variability in R1 persisted. We postulated that this variability may have arose from various factors including gain factors that were not fully accounted for, incomplete spoiling, and/or incomplete correction for B1+ field inhomogeneities12–14. Because scans from each site were acquired from different sets of participants, traveling heads protocol was administered to further examine this variability. Reconciliation of inter-site variability after applying site-specific scaling factors determined from the traveling heads scans supported the possibility that there may have been different intensity scaling applied to the images at sites.Conclusion
These preliminary results underscore the need for rigorous comparisons of sequence implementation and hardware configurations when conducting multi-site investigations using qMRI. As well, we demonstrated that a traveling heads protocol may be beneficial in ensuring the comparability of multi-site R1 data.Acknowledgements
Research was supported by Natural Sciences and Engineering Research Council of Canada (NSERC Discovery Grant RGPIN-2020-06633).References
1. Van Horn JD, Toga AW. Multisite neuroimaging trials. Curr Opin Neurol. 2009;22(4):370-378.
2. Weiskopf N, Suckling J, Williams G, et al. Quantitative multi-parameter mapping of R1, PD*, MT, and R2* at 3T: a multi-center validation. Front Neurosci. 2013;7.
3. Karakuzu A, Biswas L, Cohen-Adad J, Stikov N. Vendor-neutral sequences and fully transparent workflows improve inter-vendor reproducibility of quantitative MRI. Magn Reson Med. 2022;88(3):1212-1228.
4. Voelker MN, Kraff O, Brenner D, et al. The traveling heads: multicenter brain imaging at 7 Tesla. Magma N Y N. 2016;29(3):399-415.
5. Fischl B, Salat DH, Busa E, et al. Whole brain segmentation: automated labeling of neuroanatomical structures in the human brain. Neuron. 2002;33(3):341-355.
6. Jenkinson M, Beckmann CF, Behrens TEJ, Woolrich MW, Smith SM. FSL. NeuroImage. 2012;62(2):782-790.
7. Bock NA, Hashim E, Janik R, et al. Optimizing T1-weighted imaging of cortical myelin content at 3.0T. NeuroImage. 2013;65:1-12.
8. Yarnykh VL. Optimal radiofrequency and gradient spoiling for improved accuracy of T1 and B1 measurements using fast steady-state techniques. Magn Reson Med. 2010;63(6):1610-1626.
9. Marques JP, Kober T, Krueger G, van der Zwaag W, Van de Moortele PF, Gruetter R. MP2RAGE, a self bias-field corrected sequence for improved segmentation and T1-mapping at high field. NeuroImage. 2010;49(2):1271-1281.
10. McPhee KC, Wilman AH. T1 and T2 quantification from standard turbo spin echo images. Magn Reson Med. 2019;81(3):2052-2063.
11. Wright CI, Feczko E, Dickerson B, Williams D. Neuroanatomical correlates of personality in the elderly. NeuroImage. 2007;35(1):263-272.
12. Glasser MF, Coalson TS, Harms MP, et al. Empirical transmit field bias correction of T1w/T2w myelin maps. NeuroImage. 2022;258:119360.
13. Keenan KE, Ainslie M, Barker AJ, et al. Quantitative magnetic resonance imaging phantoms: A review and the need for a system phantom. Magn Reson Med. 2018;79(1):48-61.
14. Preibisch C, Deichmann R. Influence of RF spoiling on the stability and accuracy of T1 mapping based on spoiled FLASH with varying flip angles. Magn Reson Med. 2009;61(1):125-135.
Figures
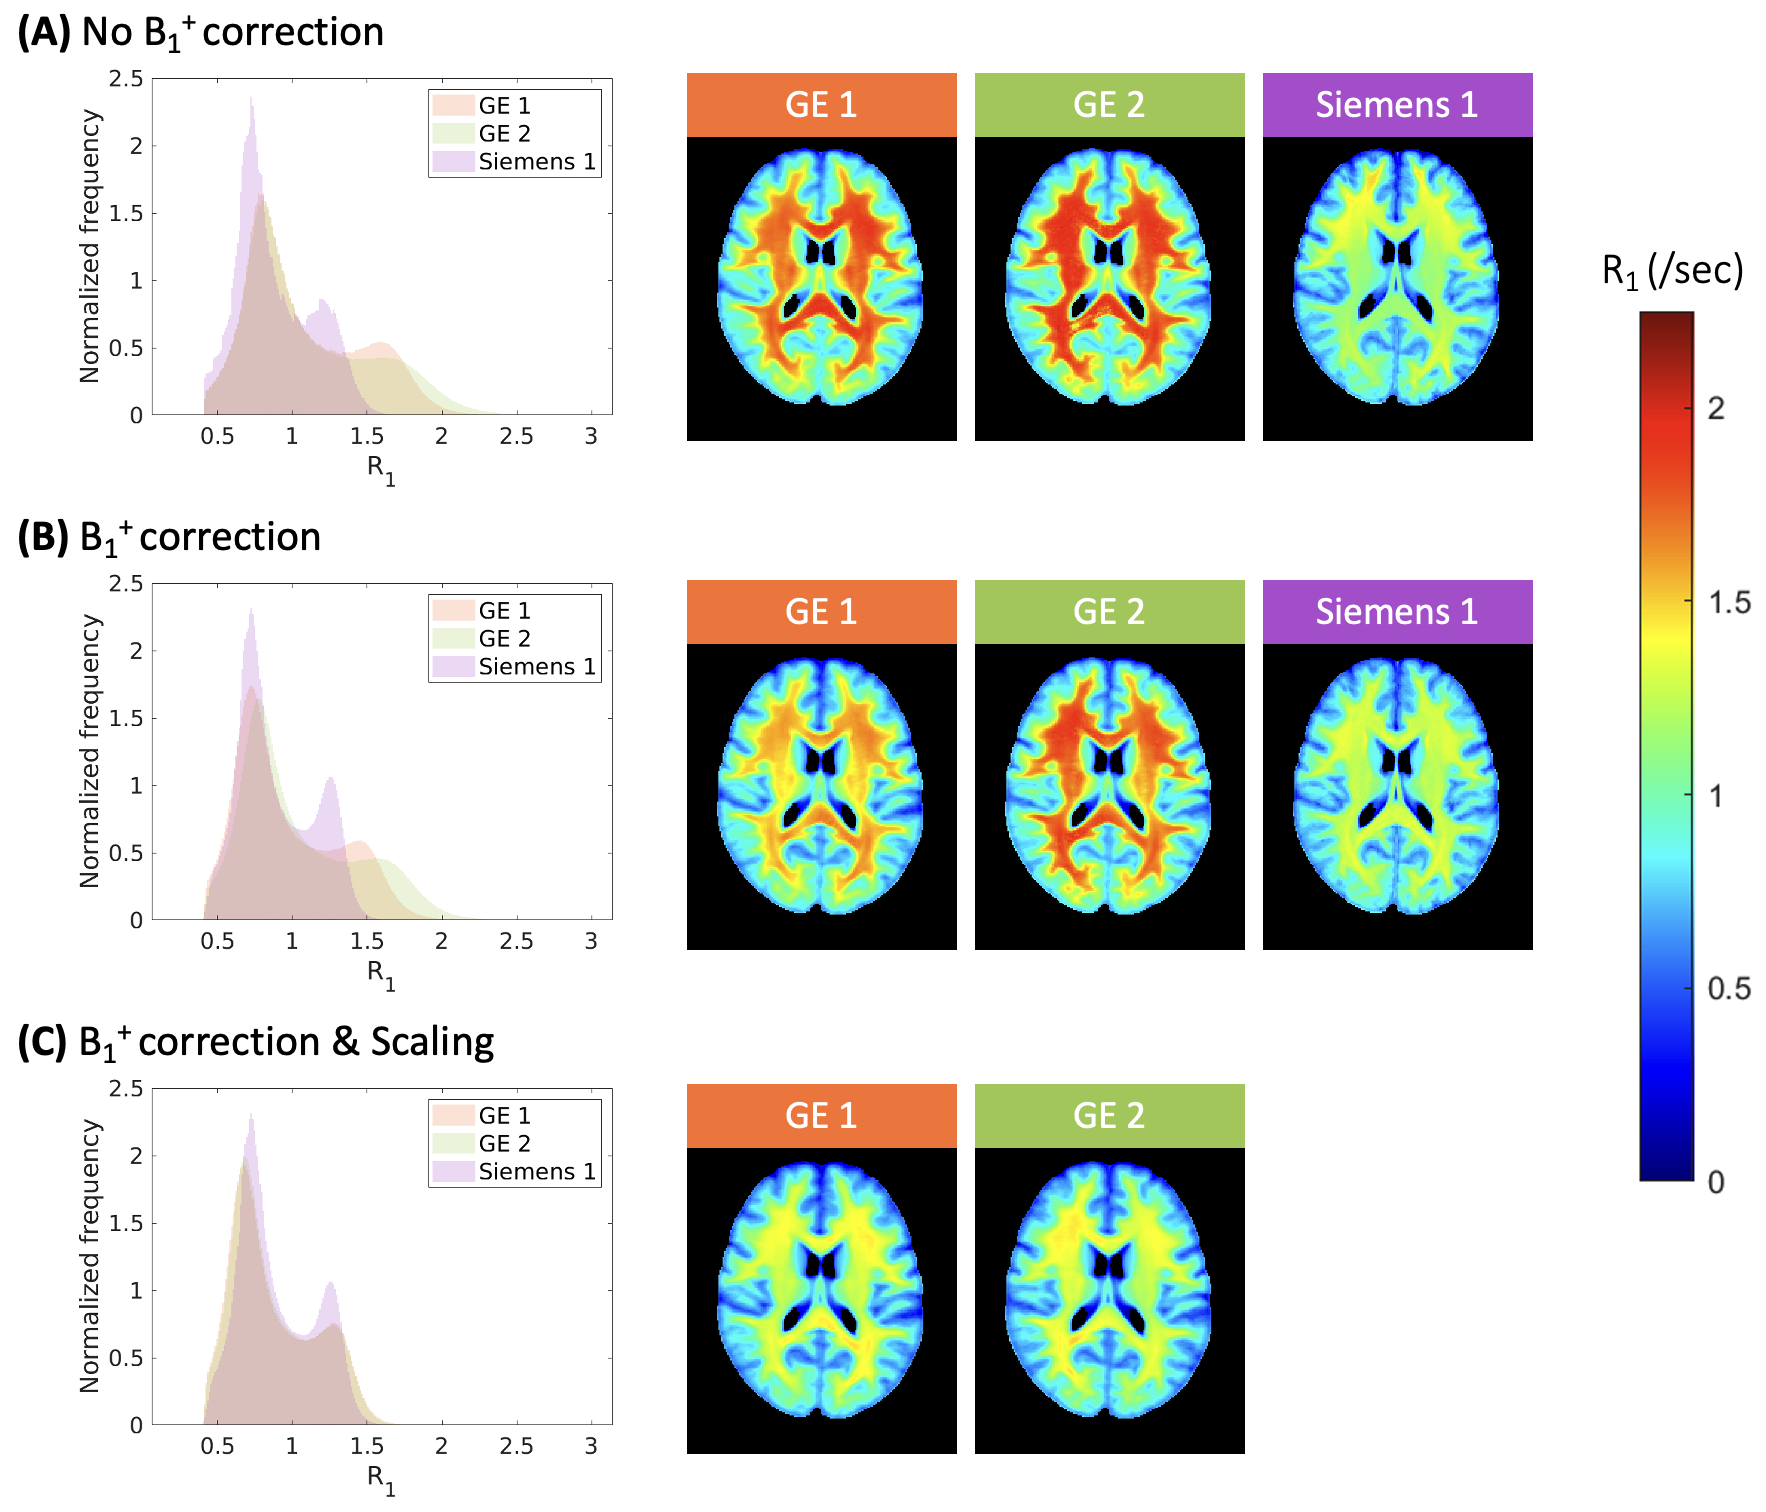
Figure 1: Histograms of whole-brain R1 values for each site (left) and site average R1 maps (right) for the main dataset created using estimates computed without (A) and with B1+ transmit field in calculation (B). Histogram and site average R1 maps after scaling the ratio values for the GE sites are also shown (C). Data from GE 1, GE 2, and Siemens 1 sites are labelled in orange, green, and purple, respectively, and the color scale for the average R1 maps are shown on the side.
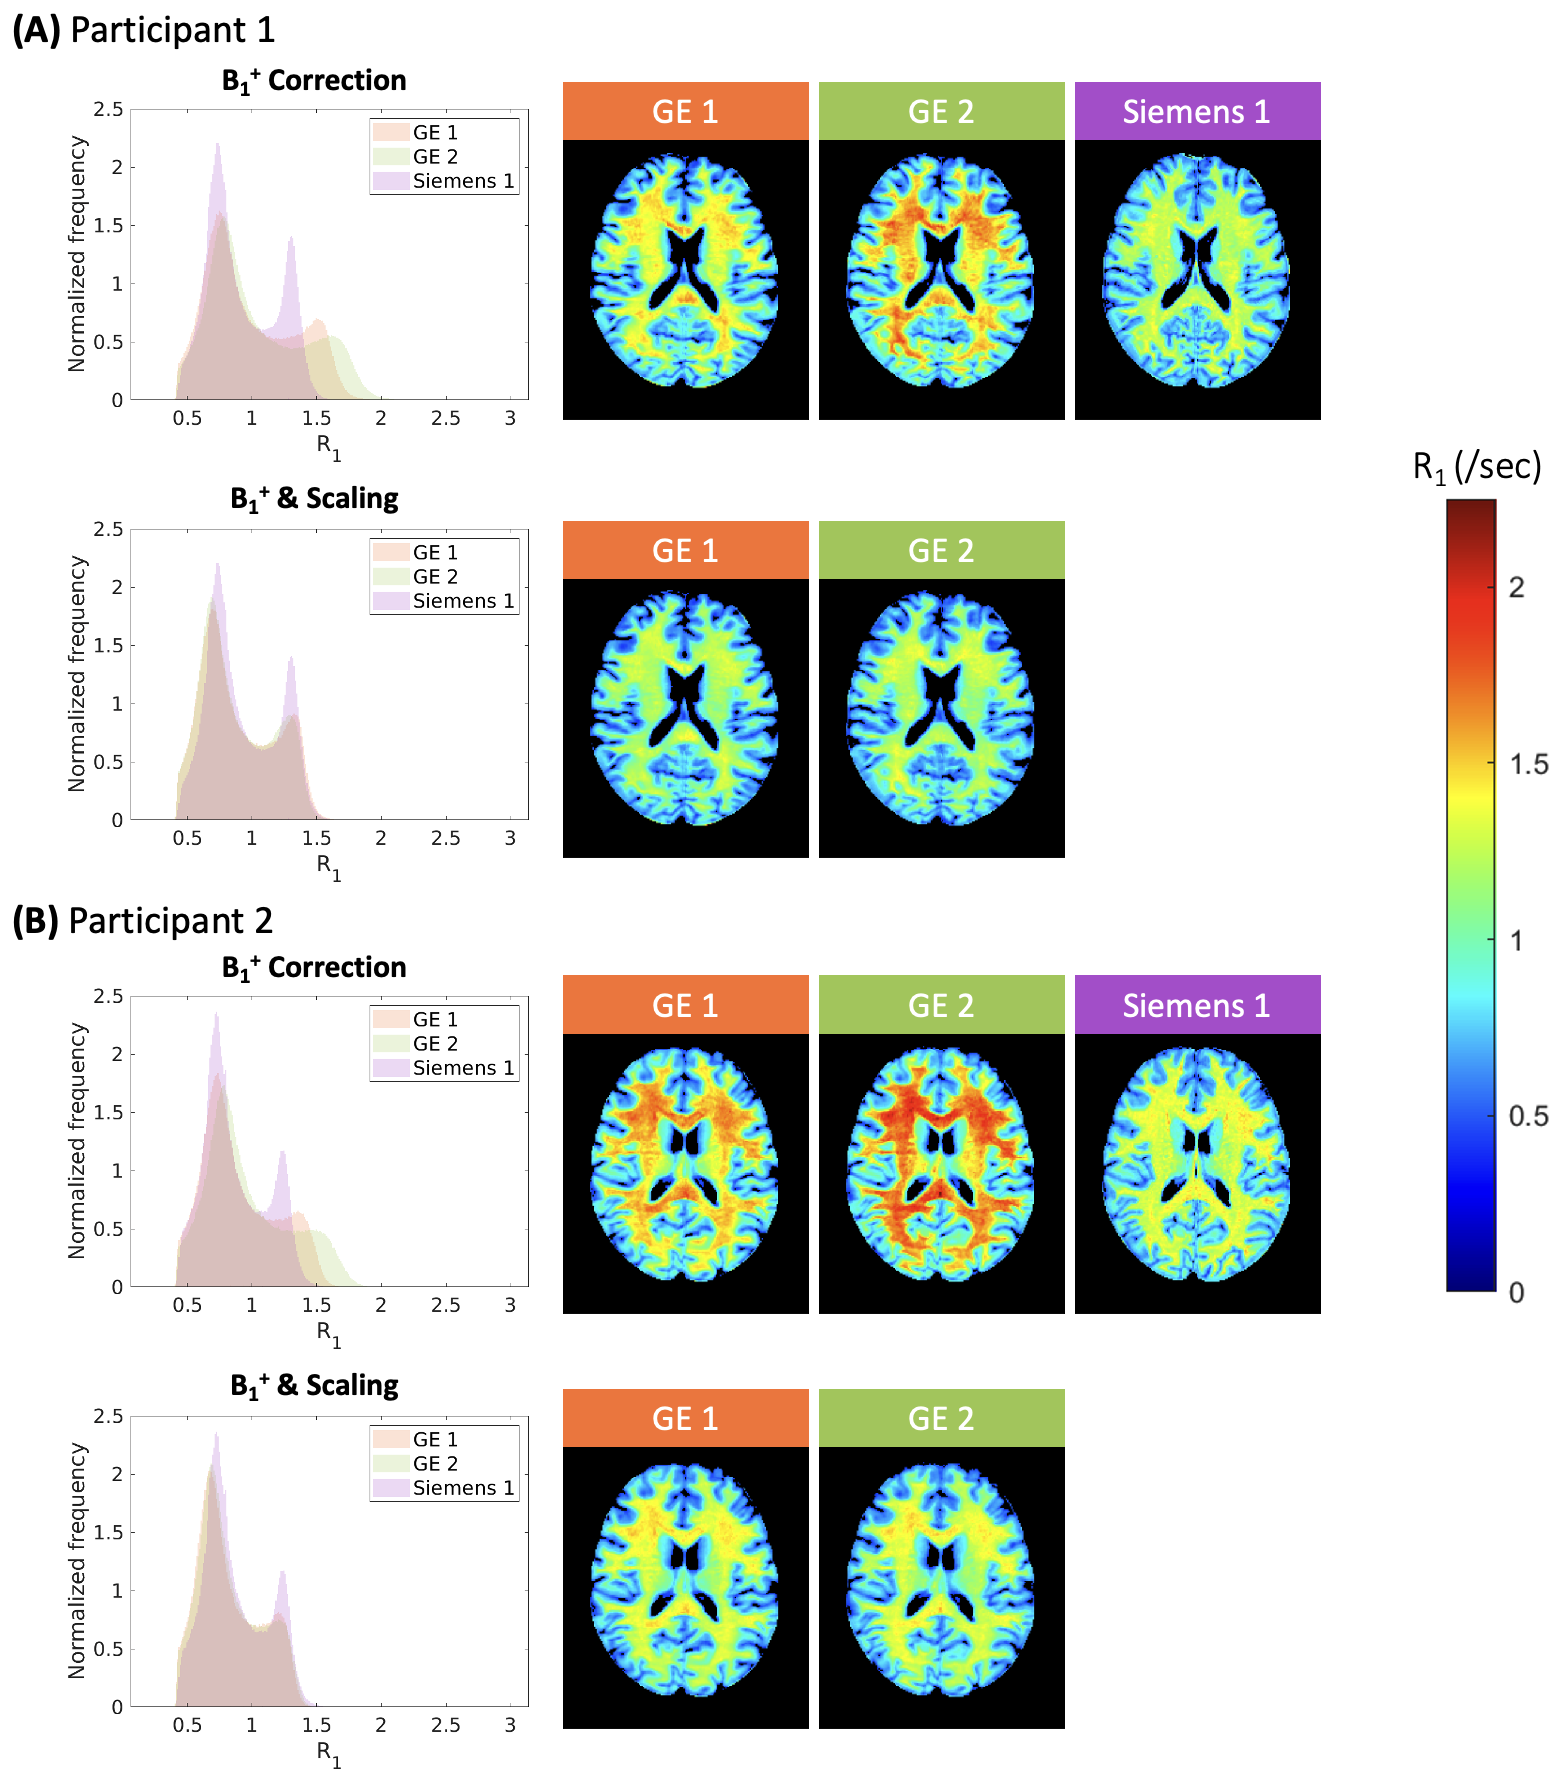
Figure 2: Histograms of whole-brain R1 values (left) and R1 maps (right) collected at each site for the traveling heads participant 1 (A) and 2 (B). Histogram and R1 maps with B1+ field correction are shown in the first row, while the second row depicts the results after scaling the ratio values with the site-specific factors. Data from GE 1, GE 2, and Siemens 1 sites are labelled in orange, green, and purple, respectively, and the color scale for the R1 maps are shown on the side.