5084
Reproducibility of diffusion kurtosis parameters for a quantitative phantom in a multi-system study1Radiology, University of Michigan Health System, Ann Arbor, MI, United States, 2Medical Physics, Memorial Sloan Kettering Cancer Center, New York, NY, United States, 3Radiology, MRI Research Institute, Weill Cornell Medical College, New York, NY, United States, 4Radiology, Center for Biomedical Imaging, NYU Langone Health, New York, NY, United States, 5National Institute of Standards and Technology, Boulder, CO, United States, 6Radiology, Memorial Sloan Kettering Cancer Center, New York, NY, United States
Synopsis
Keywords: Quantitative Imaging, Diffusion/other diffusion imaging techniques, diffusion kurtosis, multi-system reproducibility, quantitative phantom
This work studied reproducibility of apparent diffusion (Da) and kurtosis (Ka) coefficients for three families of lamellar-vesicle materials in a quantitative phantom scanned at ambient temperature in a multi-site setting. Inter-system reproducibility of Ka was improved by maximum b-value fit-constraints for phantom materials with higher solid concentration, while temperature calibration improved Da parameter consistency predominantly for materials with low solid concentration and containing longer-chain alcohols. After correction for temperature-dependence, these materials exhibited apparent diffusion reproducibility comparable to that of standard Gaussian diffusion controls.Introduction
Quantitative phantoms with multi-exponential, biomimetic diffusion behavior provide ground-truth for non-Gaussian parametric diffusion models for calibration of advanced quantitative diffusion protocols1-3. Previous studies revealed temperature and diffusion time dependence of diffusion kurtosis (DK) model parameters for the phantom materials3,4. Objectives of this study were: (1) assessment of multi-site reproducibility for phantom DK parameters at ambient scan conditions and (2) demonstration of improvements by maximum b-value fit-constraint and temperature-dependence correction.Methods
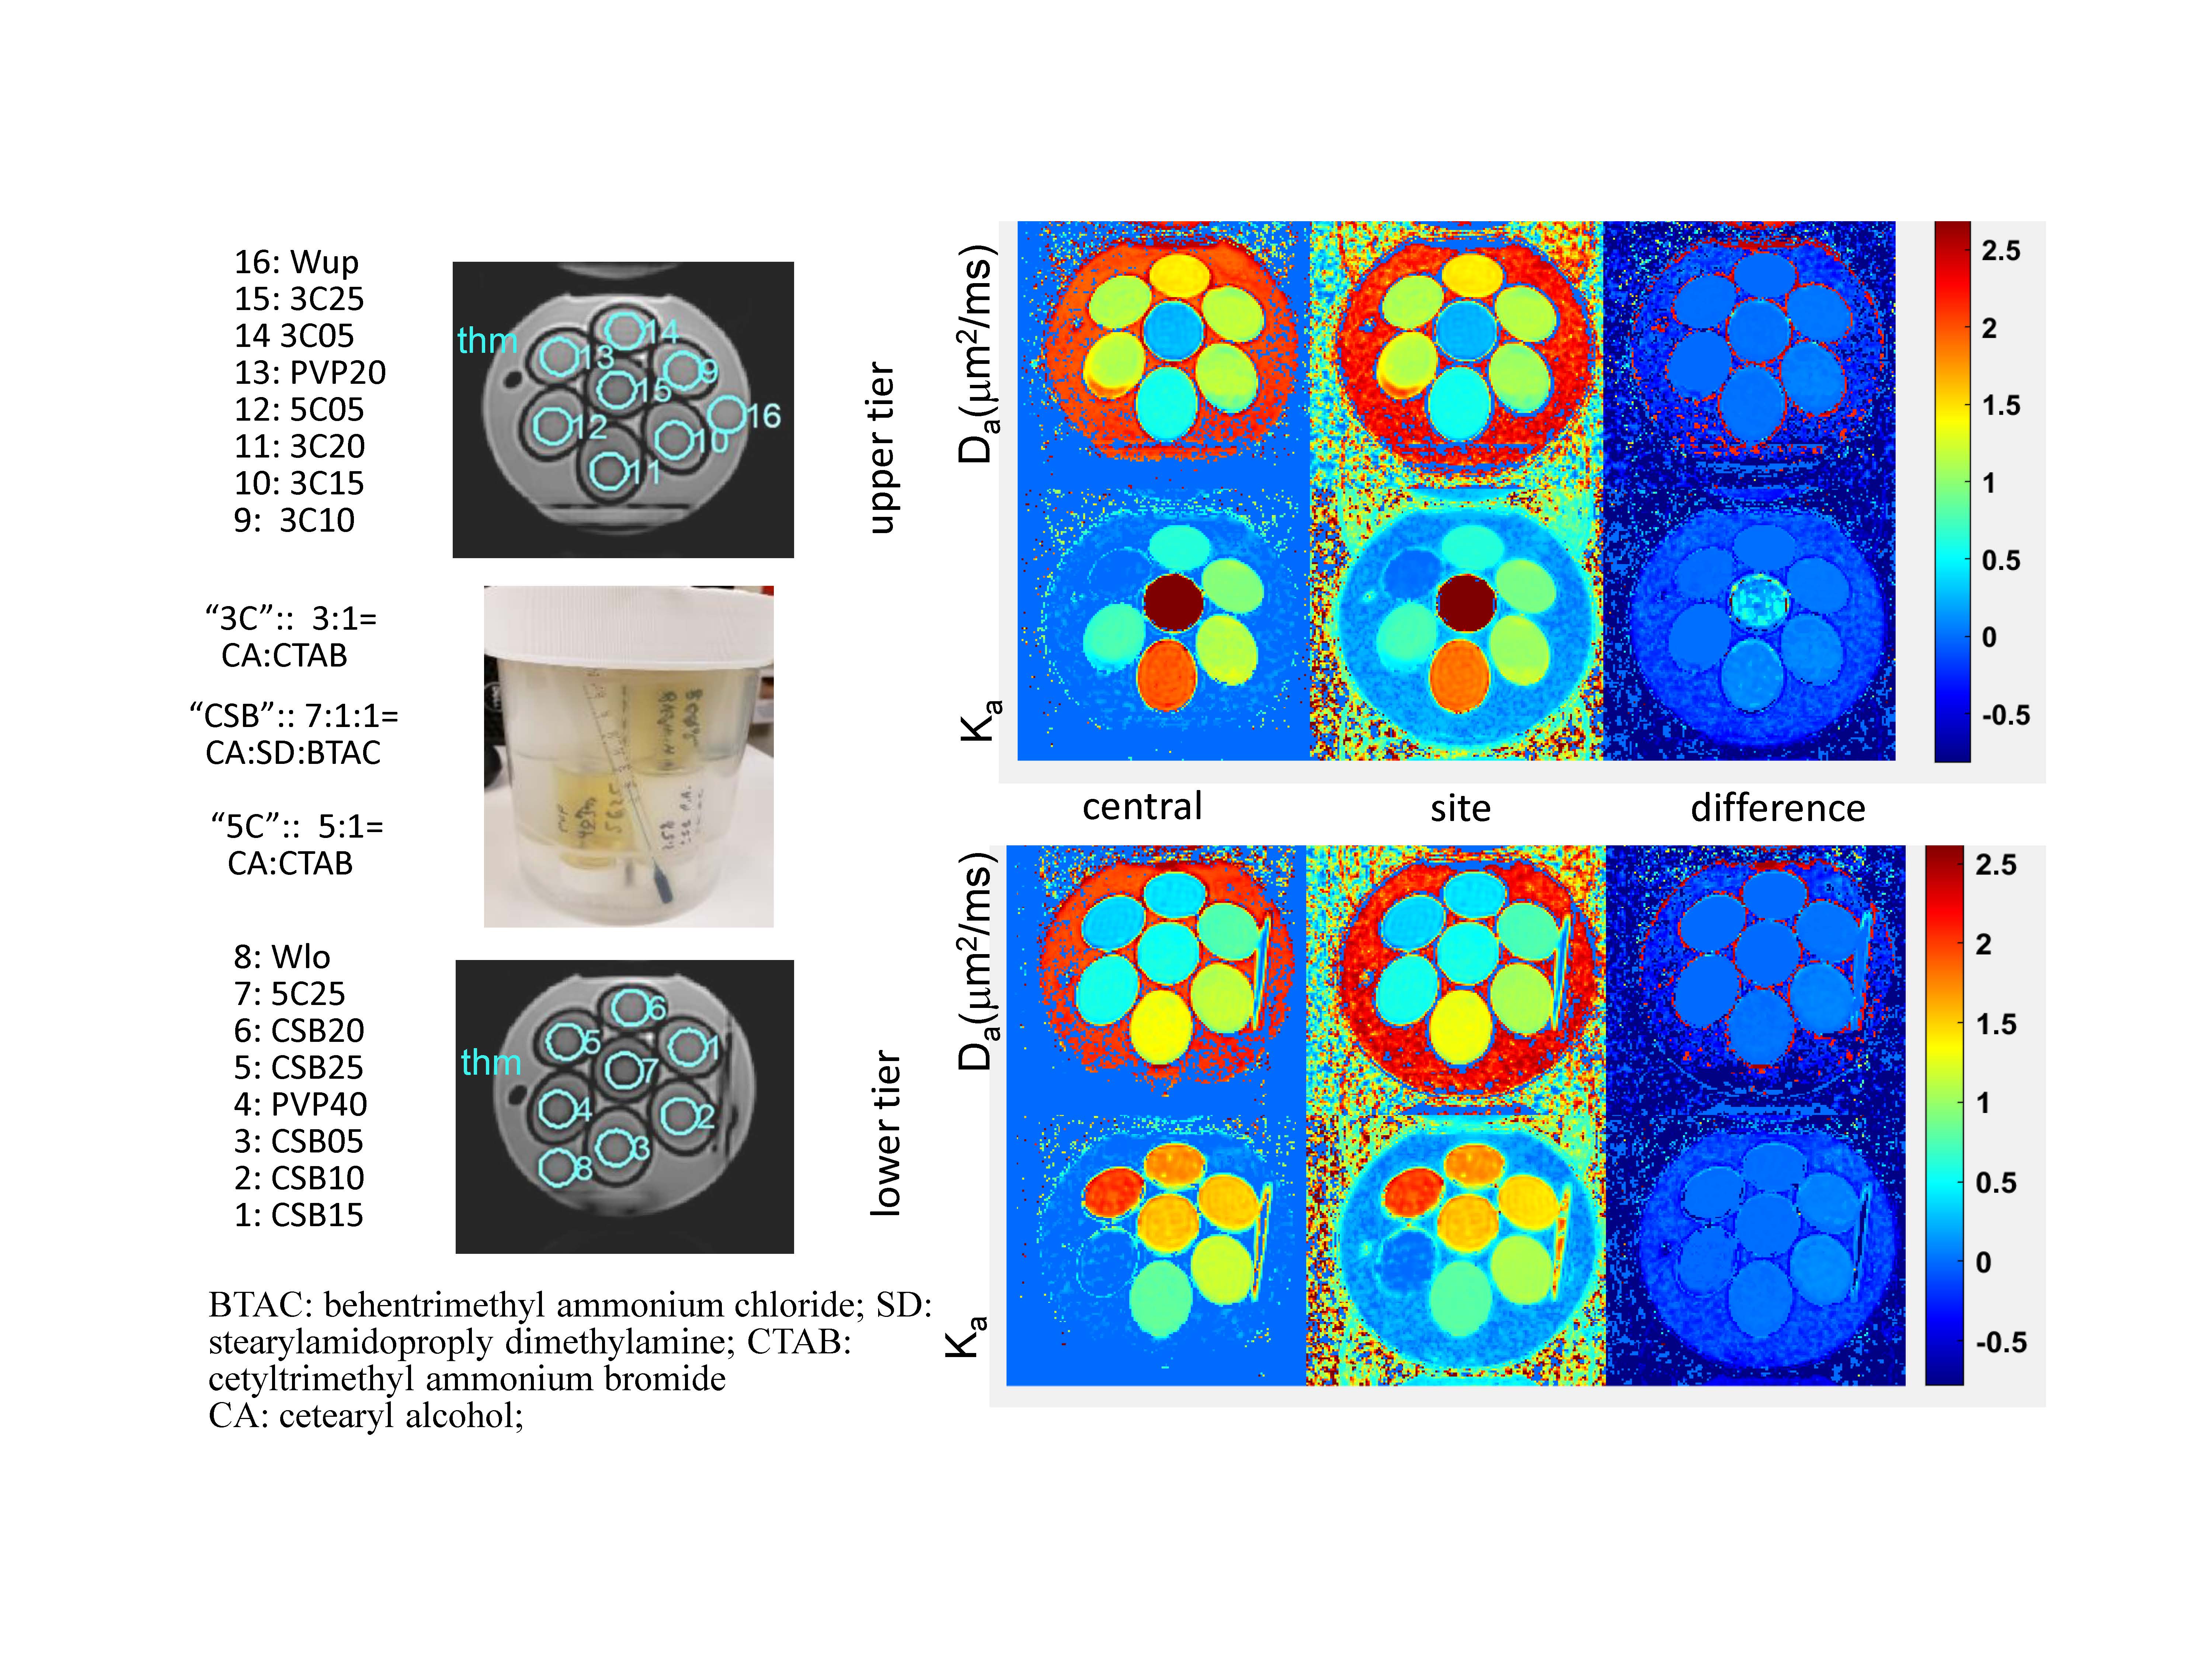
Multi-exponential diffusion phantom: The phantom has two tiers of seven 20ml-glass scintillation vials containing water-suspensions of lamellar vesicles (LVs)3,4 placed in a 1L jar filled with deionized water-bath (Figure 1). The LV materials are made from fatty alcohols, surfactants, and water (solid-in-water %(w/w)=0.5%-2.5%)3,4. Two polyvinylpyrrolidone (PVP) mixtures at 20% and 40% were added as Gaussian-diffusion (Ka=0) “controls”. The phantom contained an alcohol thermometer for temperature (T) reading to ±0.5°C. Three copies of the phantom were prepared using materials from the same batch and scanned by four sites on five systems.Phantom DWI and T-measurements: The phantom DWI were acquired on five 3T-MRI scanners at ambient temperatures using 11 b-values between 0 and 3000s/mm2, TR/TE (5-10s/0.075-0.12s), and (0.8-1.7)x(0.8-1.7)x5mm3 voxels. The phantoms were thermalized in scanner rooms overnight before scanning. Internal T-calibration was performed using ADCb1500 measured for Gaussian diffusion materials of 20%&40% PVP (“PVP20”&”PVP40”), and water in lower and upper phantom tiers (“Wlo”&”Wup”) (Figure 1). Average water diffusion coefficient, Dw, was determined using PVP-ADC calibration5, and apparent scan temperature, Ta, was derived by inverting the Speedy-Angell relation6: Ta=Ts∙((Dw/D0)1/G+1)-273.15; Ts=215.05K;G=2.063;D0=16.35μm2/ms.
Centralized DWI analysis: Sites submitted locally-generated DK maps and DWI DICOM. Centralized analysis was performed to derive DK model parameters apparent diffusion, Da, and kurtosis, Ka, coefficients by linear model fit of voxel log-signal DWI versus b-value according to: Log(Sb/S0)=-Da·b+Ka(Da·b)2/6, using lscov function from MATLAB R2019b (Mathworks, Natick MA). The maximum b-value constraints bmax<3/(Ka·Da)7 and Sbmax/S0>0.01were implemented by iterative fitting8. Further cutoff was used for Ka<5 and Da < 2.5μm2/ms (Dw@29°C), and SNRb3000>2 threshold mask was applied before fitting.
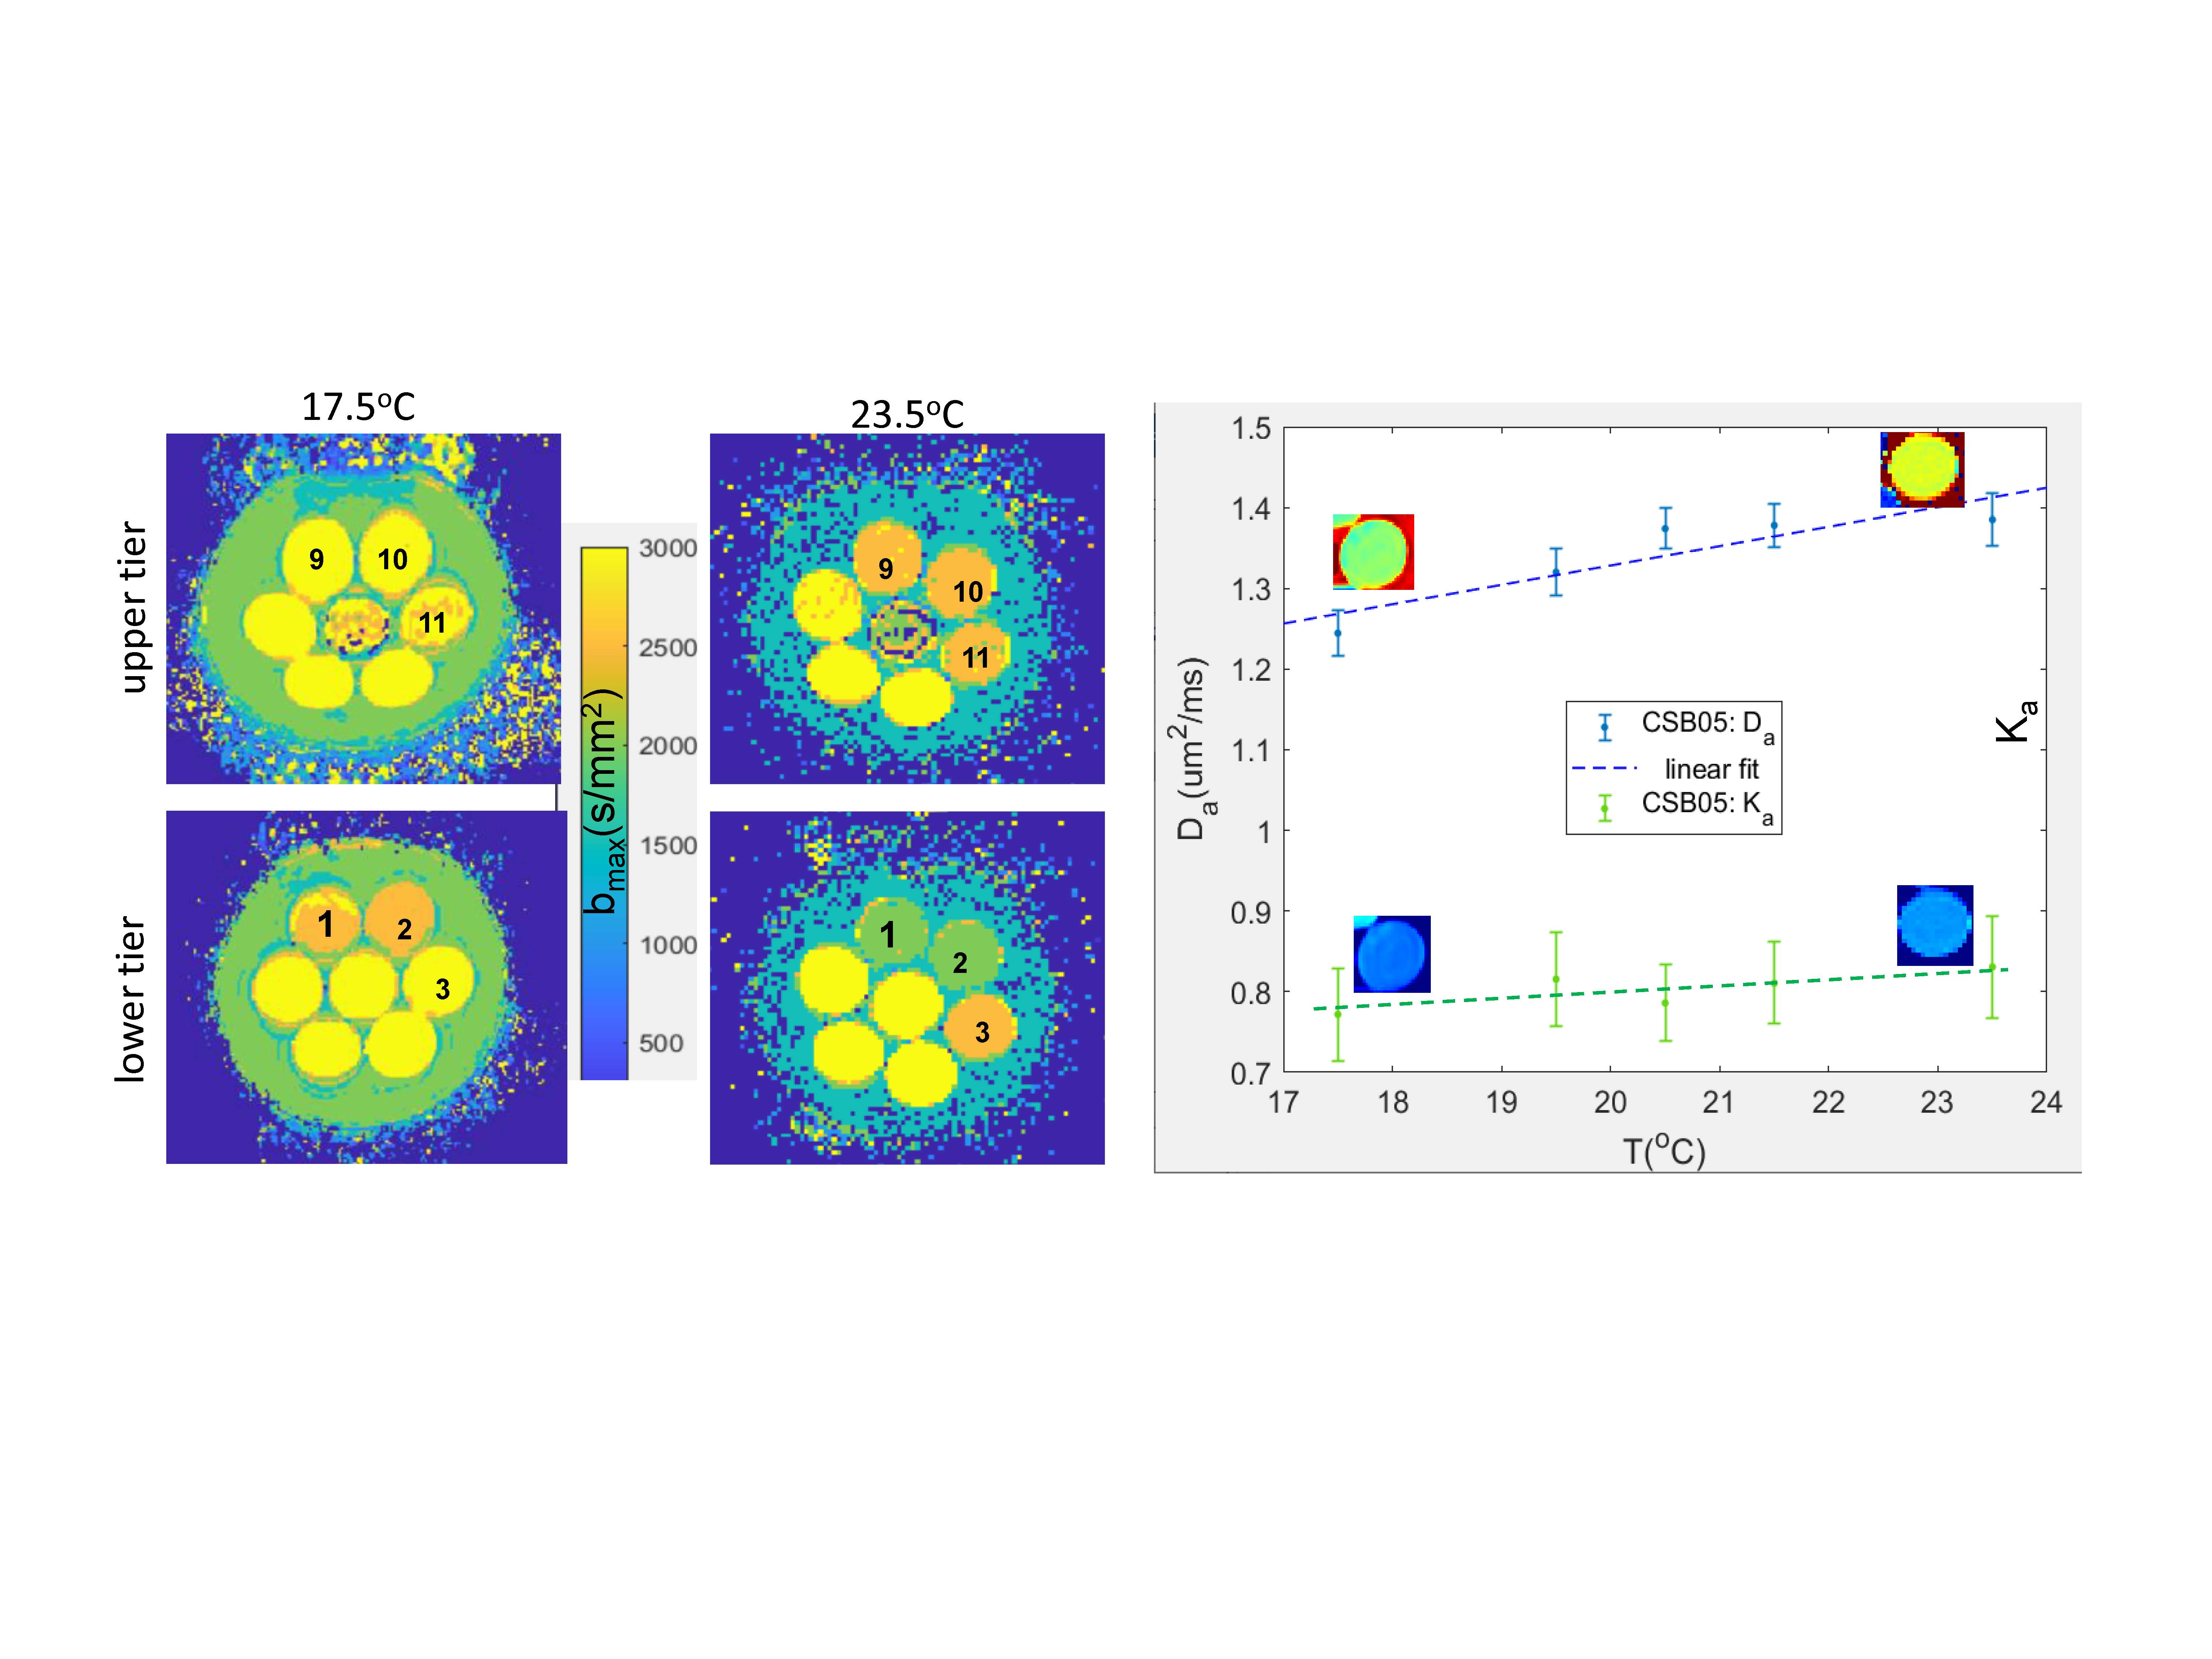
Inter-system reproducibility and T-dependence correction: 15mm diameter ROIs were manually placed in the centers of sample vials on the Da and Ka maps and water bath (single slice in both phantom tiers, Figure 1) to measure mean and standard deviation (SD) of fit DK model parameters. For comparison of site and centralized analysis, the same set of ROIs was applied and statistics generated, using QIBAphan-proc function9. Mean fit-errors within ROI were scaled by 1.96 to derive confidence intervals (CIs). T-dependence correction was performed by modelling the mean Da as linear-functions of apparent Ta, then subtracting the measured Da from the T-fit values and adding the differences to the fit values at (site-average) T=21°C. The bias for “controls” was assessed with respect to calibrated values5. The reproducibility was quantified by inter-system SD for site-specific analysis (sSD) versus centralized analysis (cSD).
Results and Discussion
Scans were performed on 5 MRI systems. Figure 1(parametric maps) illustrates example of differences between centralized and site DK model analysis, e.g., evident for Ka map (0.1-0.15 for ROI2,10,15). Ka>0 bias is also visible on site-generated maps for the water-bath (Ka=0 medium), which is reduced by the centralized processing.Self-calibrated system temperatures ranged Ta=(18.5-23.5)°C (Figure 2). For three systems that provided alcohol-thermometer T-measurement, the Ta was within T±0.5°C. Over this Ta-range, the fit bmax for “CSB”(1.5%,1.0%,0.5%) changed from 2500,2500,3000s/mm2 to 2000,2000,2500s/mm2; for “3C”(1.0%,1.5%,2.0%,2.5%) from 3000s/mm2 to 2500,2500,2500,1500s/mm2 ; and for water-bath from 2000s/mm2 to 1500s/mm2 (Fig.2, left). Higher fit-CIs were observed for Ka(6.5%-13.6%) compared to Da(2.6%-4.3%). The relative T-induced changes observed for Da exceeded CI (e.g., Fig.2, blue): Da(T)-fit slopes 0.02-0.04 for solid concentrations <2%, while T-induced Ka changes were not significant (e.g., Fig.2, green): Ka(T)-fit slopes<0.0054.
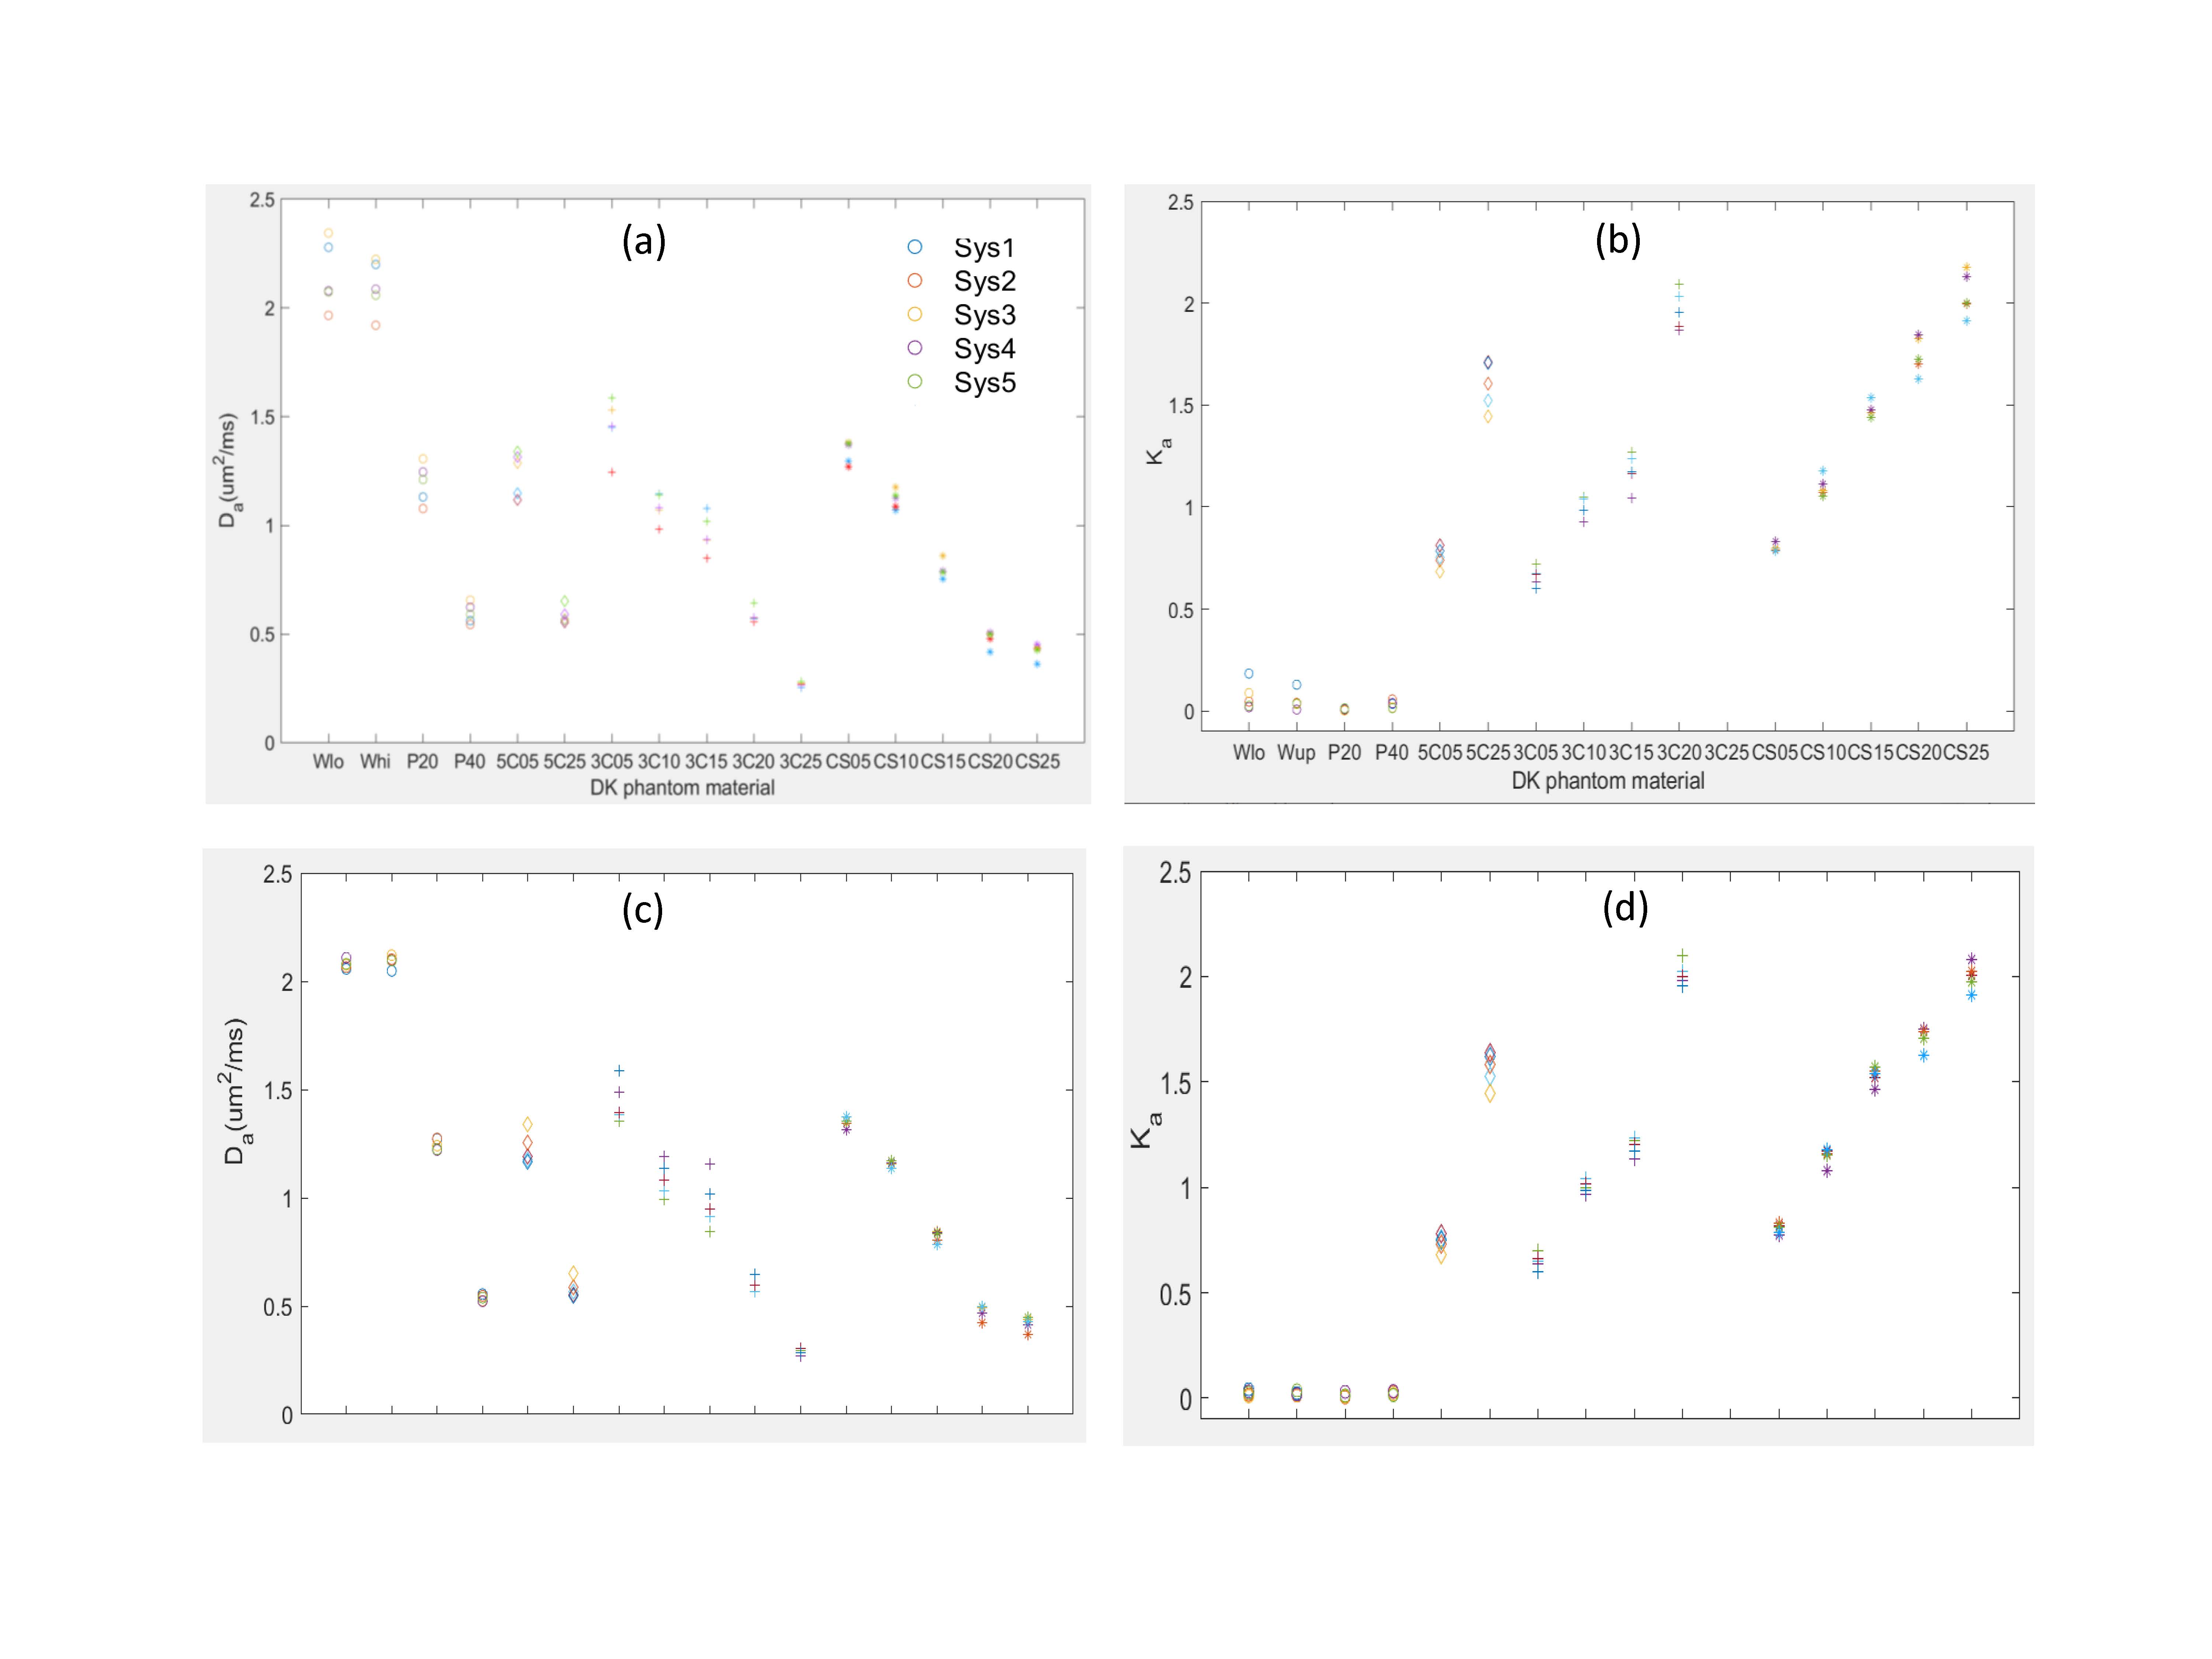
Within a material family (Figure 3), the Da decreases while Ka increases nearly linearly with increasing solid %(w/w). Centralized fit (with constrained bmax, Fig.3c,d) effectively eliminated the Ka bias for water (Ka=0), and reduced cSD(Ka) (vertical spread) predominantly for “5C” and “3C” materials (relative effect increasing with %(w/w)-solid: sSD-cSD=0.01-0.04), and for “CSB”(%(w/w)>1.5%). Temperature-correction mainly reduced cSD(Da) of negative-controls and “CSB”(%(w/w)<2%).
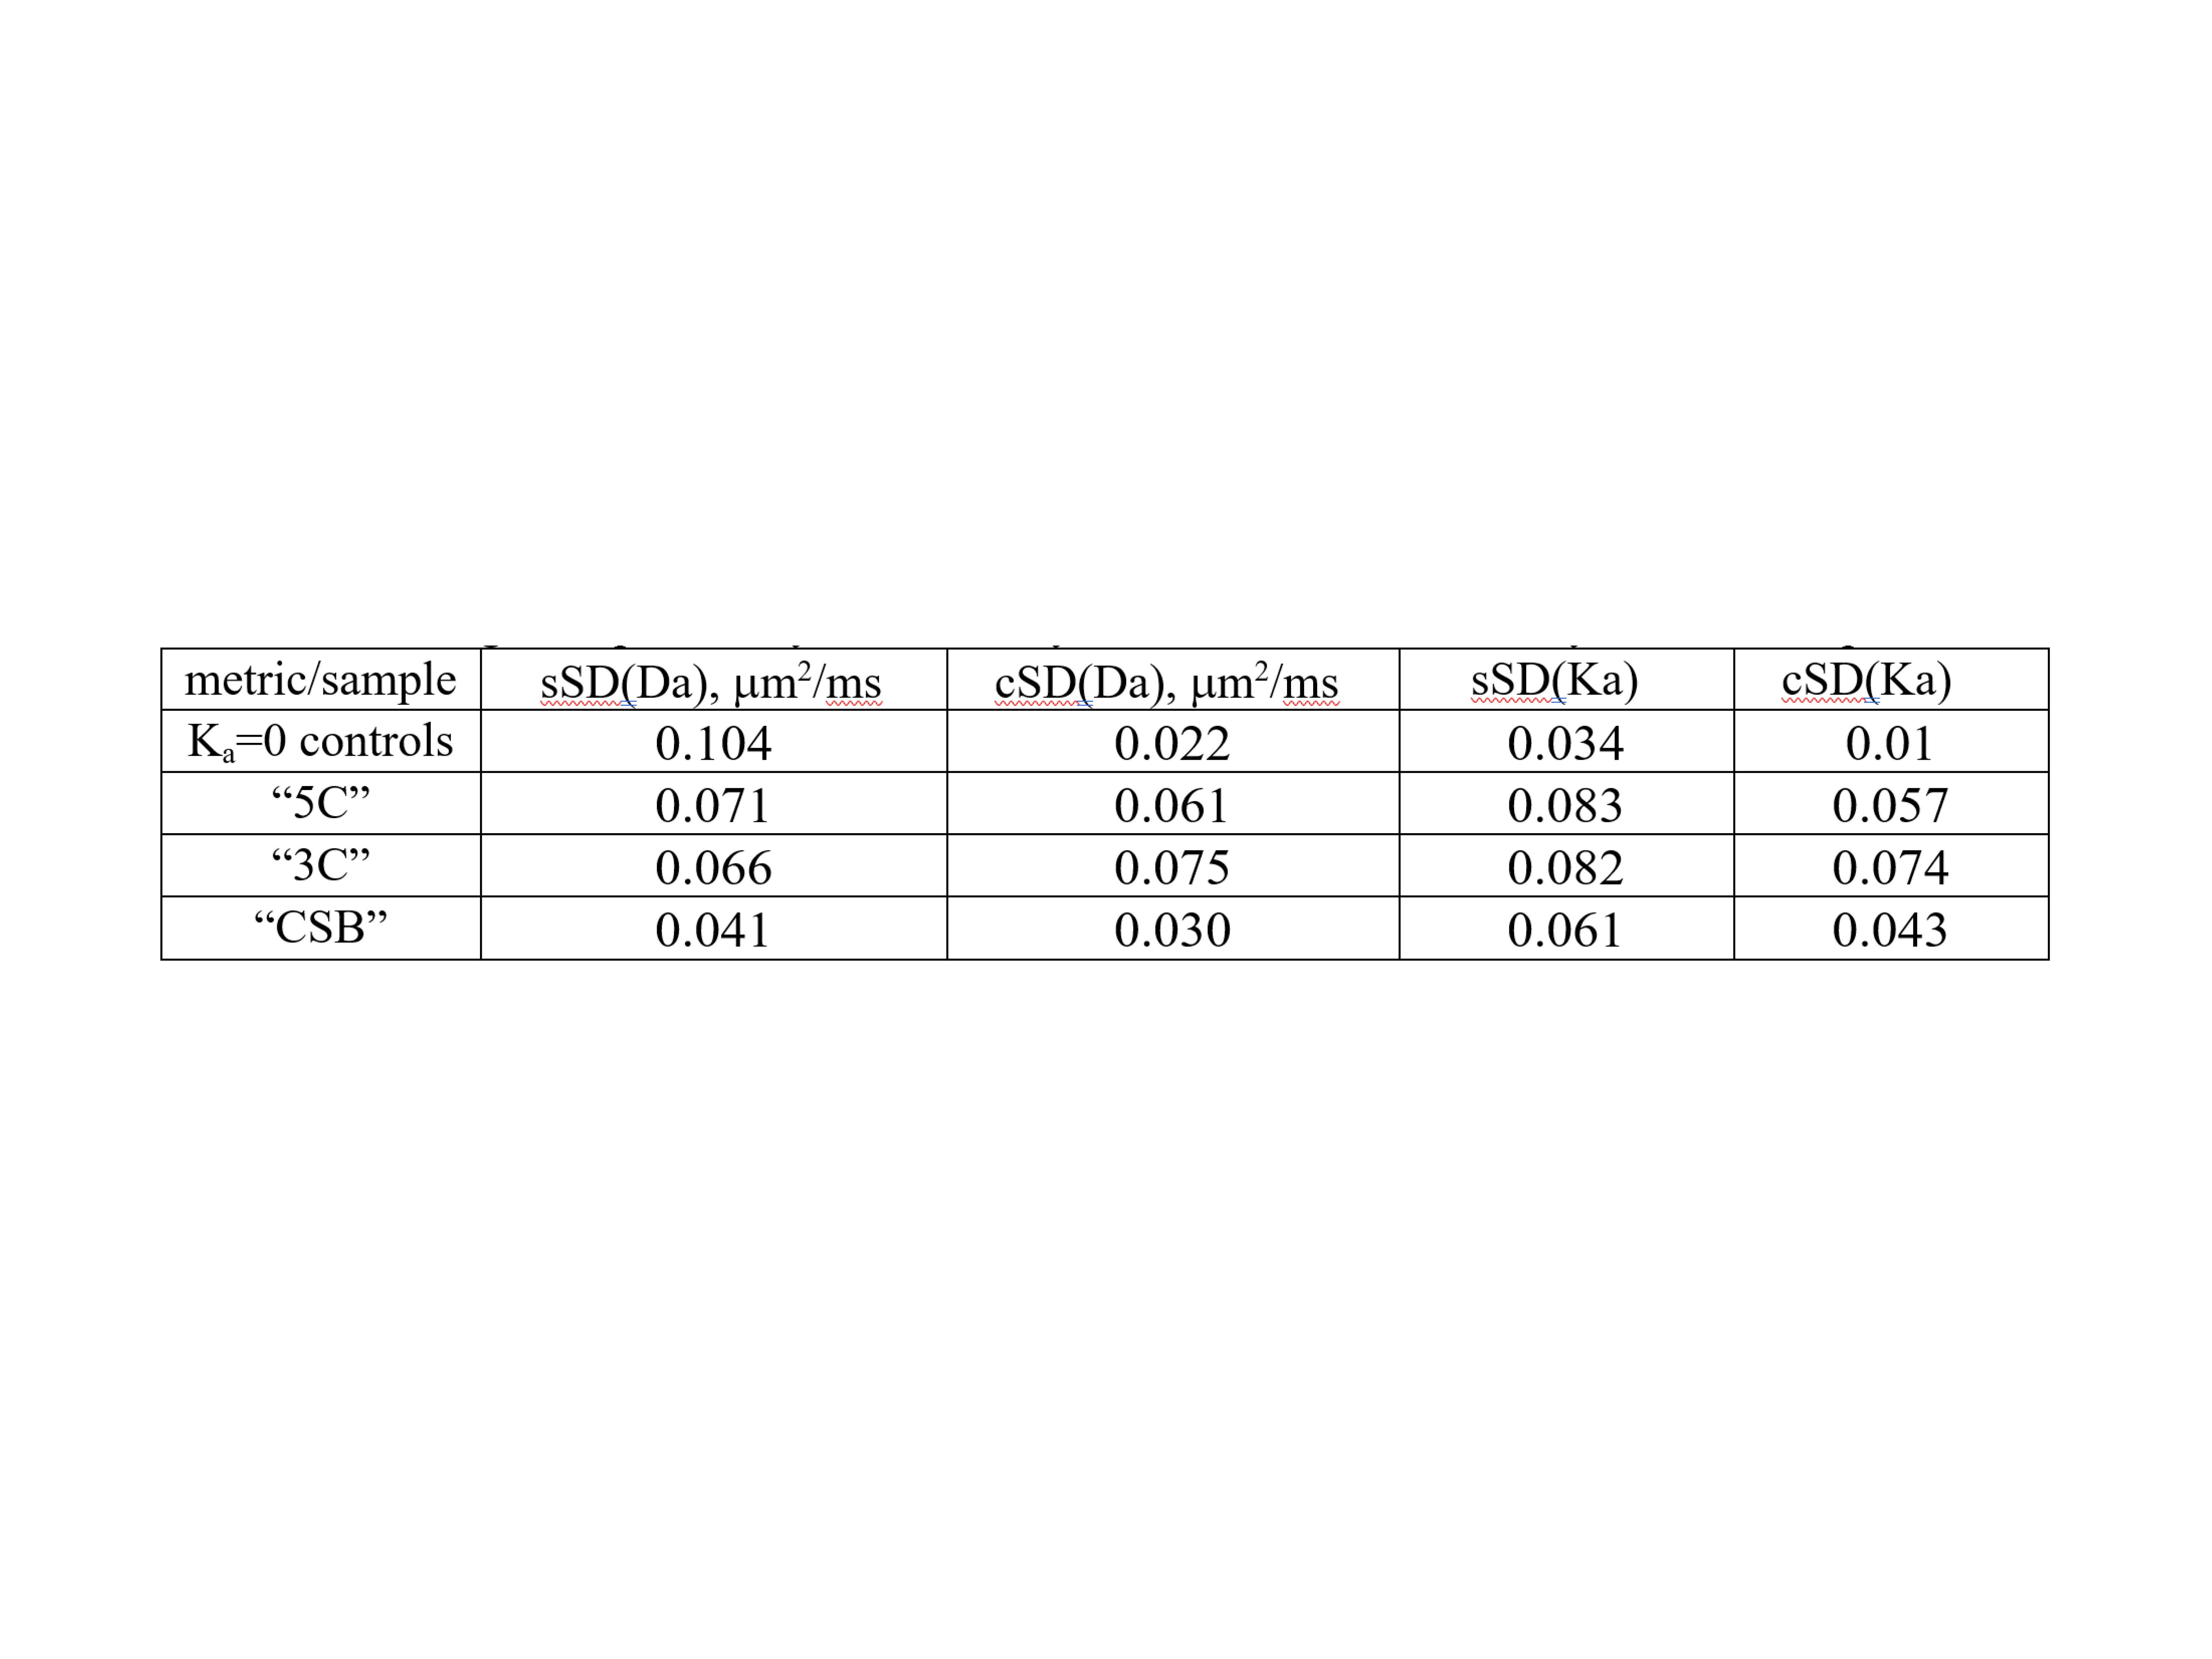
Table 1 summarizes %(w/w)-average SD of DK-fit parameters for phantom materials. For Gaussian-diffusion controls, centralized analysis and T-correction reduced mean bias (Da[μm2/ms];Ka): from (0.025;0.041) to (-0.004;0.021); and inter-system SD(Da[μm2/ms];Ka) from sSD=(0.104;0.022) to cSD=(0.034;0.01). Overall, reduced average cSD was observed for all DK parameters (Table 1), except Da(“3C”). The best reproducibility was achieved for “CSB” materials cSD=(0.03;0.043). Residual spread for T-corrected Da of “CSB” was comparable to that for (Ka=0) “controls” and was within the fit CIs(<0.035μm2/ms).
Higher variability observed for Da of “3C” materials could be related to different gradient system performance and timing (e.g., inconsistent TEs), since these materials are made of LVs with shorter-chain alcohols, which are more sensitive to diffusion-exchange time3. Residual variability for Da of Gaussian controls (and “CSB” materials) is likely related to T-calibration and fit-parameter uncertainties.
Conclusion
Centralized analysis with bmax fit-constraint improved Ka reproducibility for “5C”,“3C”, and “CSB”(>1.5%) materials, while temperature calibration and correction reduced Da variability of “CSB” (<2%). “CSB” materials provided best overall reproducibility of DK model parameters, with Da consistency comparable to that of mono-exponential diffusion controls.Acknowledgements
Funding support from National Institutes of Health Grants: U01CA166104, U24CA237683, U01 CA211205, R01CA190299, UH3CA228699 and 75N91021C00036.References
1. Panagiotaki E, Chan RW, Nikolaos Dikaios N, et al. Microstructural Characterization of Normal and Malignant Human Prostate Tissue With Vascular, Extracellular, and Restricted Diffusion for Cytometry in Tumors Magnetic Resonance Imaging. Inv. Rad. 2015;50: 218–227.
2. Hectors SJ, Semaan S, Song C, Lewis S, et al. Advanced Diffusion-weighted Imaging Modeling for Prostate Cancer Characterization: Correlation with Quantitative Histopathologic Tumor Tissue Composition-A Hypothesis-generating Study. Radiology 2018;286(3):918-28
3. Solomon E, Lembersky G, Baete S, Hu K, Malyarenko D, Swanson S, Shukla-Dave A, Russek SE, Zan E, Kim SG. Time-dependent diffusivity and kurtosis in phantoms and patients with head and neck cancer. Magn. Res. Med, 2022 (in press)
4. D. Malyarenko, T. Chenevert, S. Ono, T. Lynch, S. Swanson.: Temperature and Concentration Dependence of Diffusion Kurtosis Parameters in a Quantitative Phantom, ISMRM 30th annual conference, London, UK, DP 2429, 2022
5. Amouzandeh G, Chenevert TL, Swanson SD, Ross BD, Malyarenko DI: Technical note: Temperature and concentration dependence of water diffusion in polyvinylpyrrolidone solutions. Med Phys 2022; 49(5): 3325- 3332
6. M. Holz, S. R. Heil, and A. Sacco, “Temperature-dependent self-diffusion coefficients of water and six selected molecular liquids for calibration in accurate 1H NMR PFG measurements,” Phys. Chem. Chem. Phys., vol. 2, no. 20, pp. 4740–4742, 2000.
7. Jensen JH, Helpern JA. MRI quantification of non-Gaussian water diffusion by kurtosis analysis. NMR Biomed. 2010; 23: 698–710.
8. Malyarenko DI, Swanson SD, Konar AS, LoCastro E, Paudyal R, Liu MZ, Jambawalikar SR, Schwartz LH, Shukla-Dave A, Chenevert TL. Multicenter Repeatability Study of a Novel Quantitative Diffusion Kurtosis Imaging Phantom. Tomography. 2019; 5:36-43
9. QIBA DWI phantom QC analysis SW: https://qibawiki.rsna.org/index.php/Category:Software
Figures