5083
Improved diagnosis performance of CAD using single-bolus quantitative stress perfusion CMR imaging: a pilot study of reproducibility1Tongji Hospital,Huazhong University of Science and Technology, wuhan, China, 2MR Research, GE Healthcare, Beijing, China, 3MR Research, General Electric Healthcare, Chicago, IL, United States
Synopsis
Keywords: Quantitative Imaging, Ischemia, stress cardiac magnetic resonance imaging
Automated CMR perfusion maps enable quantification of MBF for detection of myocardial ischaemia rapidly within a clinical workflow. Stress perfusion CMR derived quantitative parameters had good to excellent reproducibility, as well as quantitative MPR was moderately correlated with semi-quantitative MPR. Quantitative myocardial perfusion CMR provides objective indices (MBF and MPR), which could better identify disease extent and detect coronary microvascular disease than visual interpretation.Purpose
Fully automated quantitative myocardial perfusion by stress cardiac magnetic resonance (CMR) may supplement visual interpretation of first-pass perfusion images for the detection of myocardial ischemia. The study aimed to investigate the reproducibility of quantitative myocardial perfusion parameters of stress perfusion CMR and the correlation between quantitative metrics with semi-quantitative parameters.Materials and Methods
17 patients with suspected or known coronary artery disease (CAD) were prospectively enrolled and underwent stress perfusion CMR examinations with a 3.0T MR scanner (SIGNA Architect, GE Healthcare). The perfusion sequence used a dual-sequence approach with separate pulse sequences for the arterial input function and myocardial tissue. Image analysis was performed automatically using commercially available software (CVI42, version 5.13.7, Circle Cardiovascular Imaging, Calgary, Canada), including global and regional stress and rest myocardial blood flow (MBF), and myocardial perfusion reserve (MPR). Reproducibility and correlation analysis was performed using Pearson correlation coefficient and intraclass correlation coefficient (ICC). Inter-observer variability was performed by two experienced observers with more than 5 years of experience independently and blindly, and intra-observer variability was derived from the repeated analysis by the first observer one month later. P value less than 0.05 was considered as statistical significance.Results
Intra-observer and inter-observer reliability of rest MBF (ICC=0.914, 0.918 and 95% confidence interval [CI] 0.790-0.966, 0.671-0.983, respectively), stress MBF (ICC=0.796, 0.849 and 95% CI 0.552-0.915, 0.417-0.968, respectively), and quantitative MPR (ICC=0.833, 0.813 and 95% CI 0.621-0.932, 0.363-0.9597, respectively) had good to excellent agreement in quantitative analysis. In addition, semi-quantitative MPR was moderately correlated with quantitative MPR (r= 0.831, P<0.0001) and stress MBF (r=0.589, p=0.013).Discussion and conclusions
The reproducibility of stress perfusion CMR-derived quantitative metrics was excellent, and quantitative MPR was moderately associated with semi-quantitative MPR. Additionally, some abnormalities confirmed by invasive coronary angiography were also observed in quantitative myocardial perfusion maps, while not in conventional CMR images (Figure 1-2), which demonstrated that quantitative myocardial perfusion maps could further improve the diagnostic performance of CAD and provide additional information beyond the visual interpretation of first-pass perfusion images. Future multi-center collaboration is necessary to further validate the clinical utilization of this quantitative CMR pulse sequence and the reliability of relevant software, and to explore the prognostic value of quantitative myocardial perfusion CMR.Acknowledgements
We acknowledged Martin Janichin's provision and technical support of CMR parameter settings and troubleshooting.References
- Kotecha T, Chacko L, Chehab O, et al. Assessment of Multivessel Coronary Artery Disease Using Cardiovascular Magnetic Resonance Pixelwise Quantitative Perfusion Mapping. JACC Cardiovasc Imaging. 2020;13(12):2546-2557. doi:10.1016/j.jcmg.2020.06.0412.
- Bradley AJ, Groves DW, Benovoy M, et al. Three Automated Quantitative Cardiac Magnetic Resonance Perfusion Analyses Versus Invasive Fractional Flow Reserve in Swine. JACC Cardiovasc Imaging. 2021;14(9):1871-1873. doi:10.1016/j.jcmg.2021.03.0133.
- Knott KD, Seraphim A, Augusto JB, et al. The Prognostic Significance of Quantitative Myocardial Perfusion: An Artificial Intelligence-Based Approach Using Perfusion Mapping. Circulation. 2020;141(16):1282-1291. doi:10.1161/CIRCULATIONAHA.119.0446664.
- Hsu LY, Jacobs M, Benovoy M, et al. Diagnostic Performance of Fully Automated Pixel-Wise Quantitative Myocardial Perfusion Imaging by Cardiovascular Magnetic Resonance. JACC Cardiovasc Imaging. 2018;11(5):697-707. doi:10.1016/j.jcmg.2018.01.0055.
- Larghat AM, Maredia N, Biglands J, et al. Reproducibility of first-pass cardiovascular magnetic resonance myocardial perfusion. J Magn Reson Imaging. 2013;37(4):865-874. doi:10.1002/jmri.238896.
- Sharrack N, Chiribiri A, Schwitter J, Plein S. How to do quantitative myocardial perfusion cardiovascular magnetic resonance. Eur Heart J Cardiovasc Imaging. 2022;23(3):315-318. doi:10.1093/ehjci/jeab1937.
- Kellman P, Hansen MS, Nielles-Vallespin S, et al. Myocardial perfusion cardiovascular magnetic resonance: optimized dual sequence and reconstruction for quantification. J Cardiovasc Magn Reson. 2017;19(1):43. Published 2017 Apr 7. doi:10.1186/s12968-017-0355-58.
- Quinaglia T, Jerosch-Herold M, Coelho-Filho OR. State-of-the-Art Quantitative Assessment of Myocardial Ischemia by Stress Perfusion Cardiac Magnetic Resonance. Magn Reson Imaging Clin N Am. 2019;27(3):491-505. doi:10.1016/j.mric.2019.04.002.
Figures
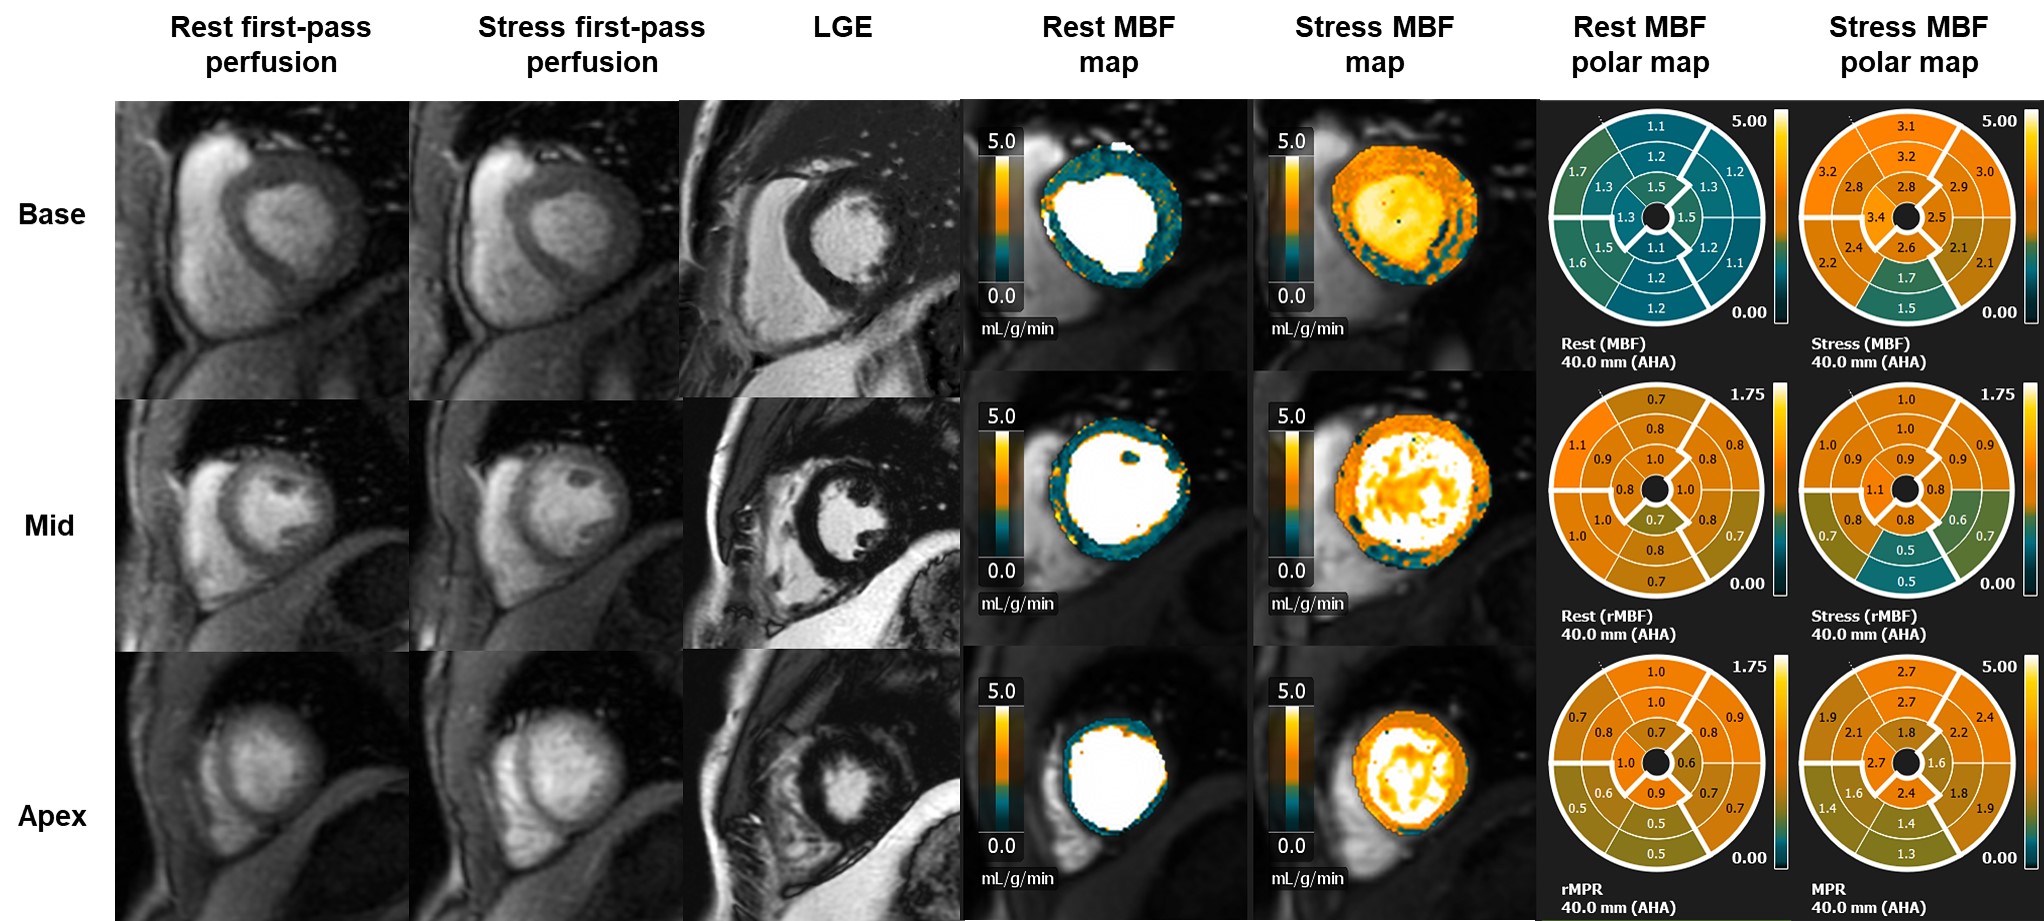
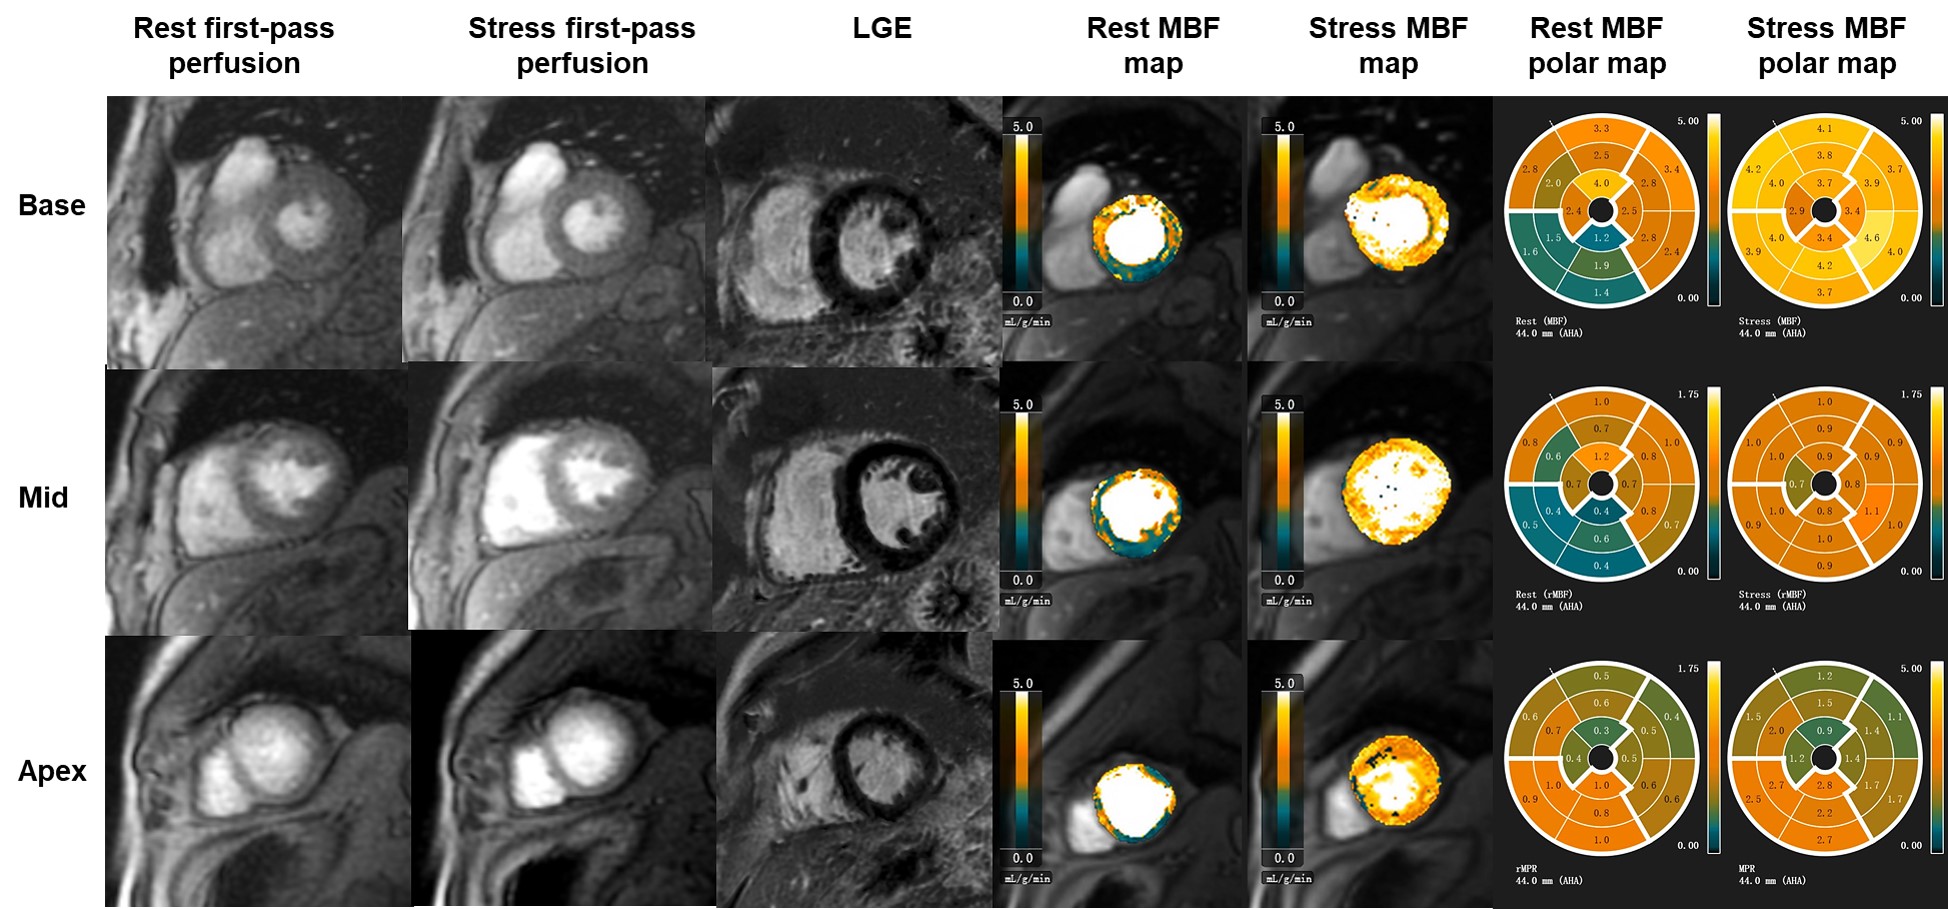
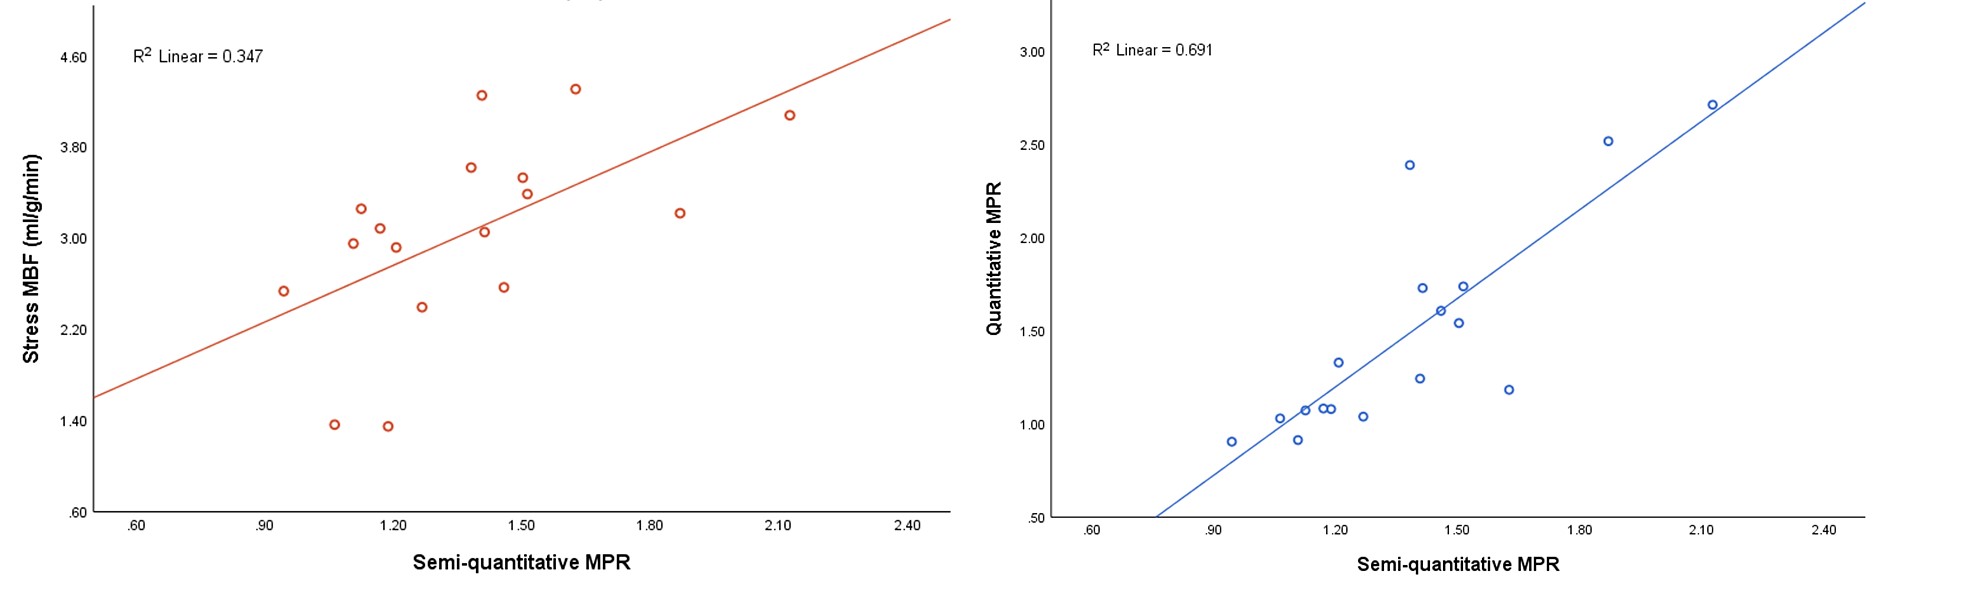
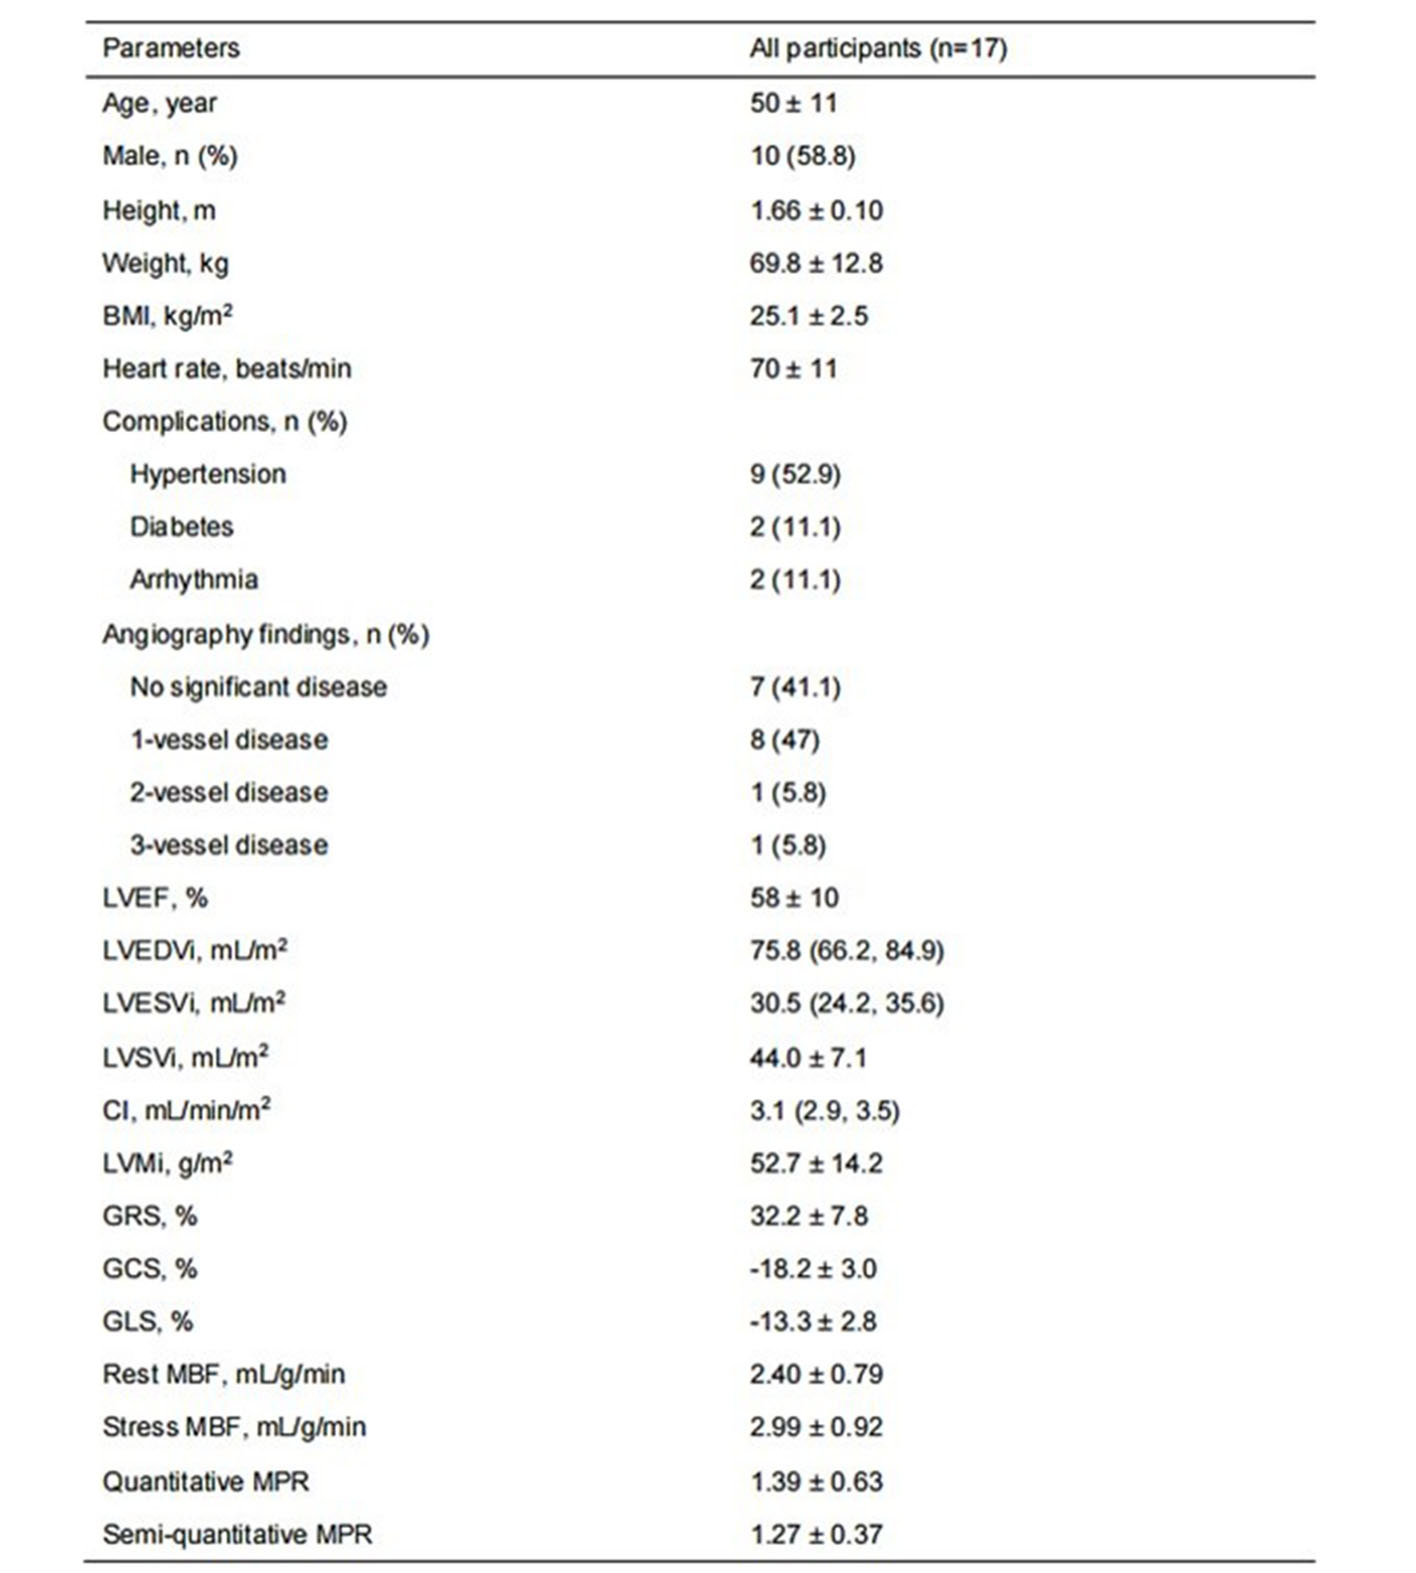
Table 1 Baseline clinical characteristics and CMR derived parameters of all participants.
Data presented as mean ± standard deviations, median (quartile 1, quartile 3), or n (percentage). BMI, body mass index; LVEF, left ventricular ejection fraction; EDVi, end-diastolic volume index; ESVi, end-systolic volume index; SVi, stroke volume index; CI, cardiac index; LVMI, left ventricular mass index; GRS, global peak radial strain; GCS, global peak circumferential strain; GLS, global peak longitudinal strain; MBF, myocardial blood flow; MPR, myocardial perfusion reserve.
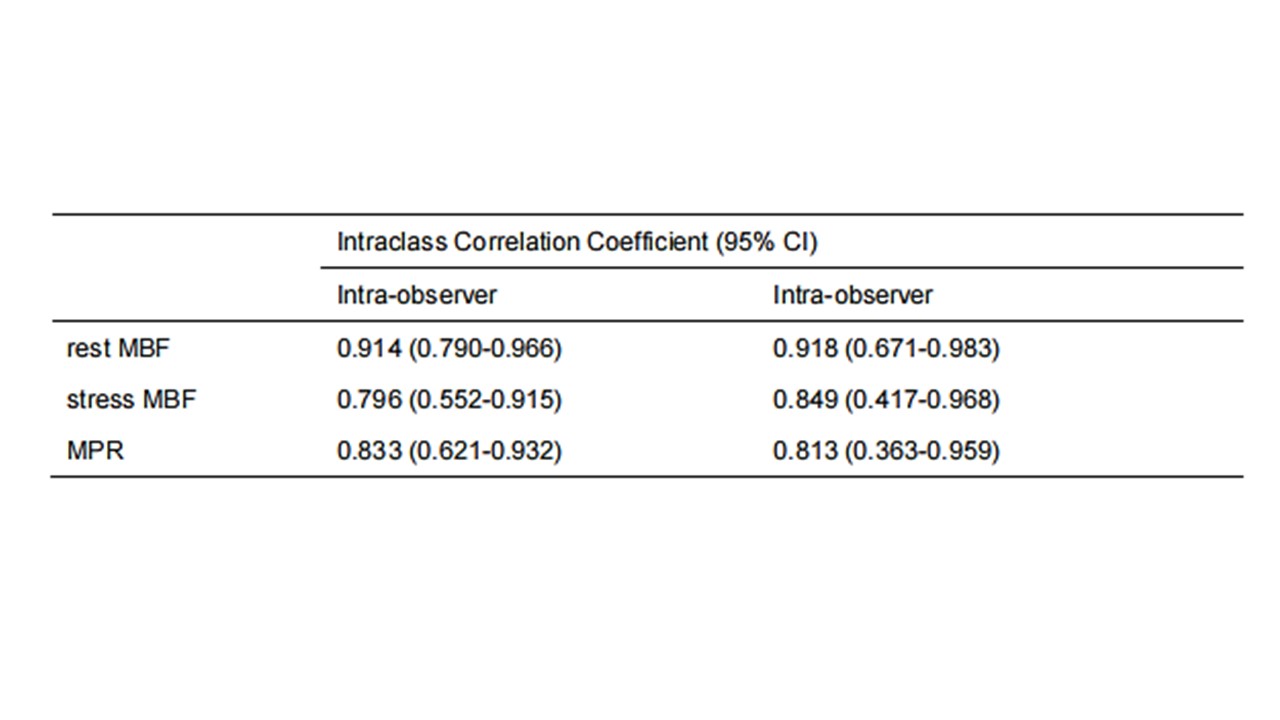
Table 2 Intra-observer and inter-observer variability of stress perfusion CMR derived parameters.
CI, confidence interval; MBF, myocardial blood flow; MPR, myocardial perfusion reserve.