5066
Signal-to-noise and B1 characterization of linear and quadrature 13C-cryocoils for preclinical MRSI1School of Medicine, Klinikum rechts der Isar, Department of Nuclear Medicine, Technical University of Munich (TUM),, Munich, Germany
Synopsis
Keywords: RF Arrays & Systems, RF Arrays & Systems
Cryogenically-cooled 13C radiofrequency (RF) coils (cryocoils) improve SNR by reducing thermal coil noise compared to room-temperature coils. Coil geometry impacts B1 patterns, which impact experiment design and must be characterized. The sensitivity profiles of a linear and a quadrature coil were characterized with varied RF powers, which is complicated by transmit B1 variation with position and resulting excitation variations. The sensitivity was compared to a room-temperature volume resonator. The quadrature cryocoil configuration offers better B1 uniformity but lower SNR closest to the coil compared to the linear configuration, both have an overall better SNR performance compared to the volume resonator.
Introduction
After adjusting transmit gain for a target location, RF coil sensitivity is determined by local receive B1. For surface coils, the highly inhomogeneous transmit and receive B1 must be separated to accurately characterize performance of different coil geometries. Normalizing the local excitation separately for each position (eg. to local 90°, with TR>>T1 for peak signal in each voxel) at sufficient detail would require many measurements. Instead, the signal vs. transmit power curve can be sampled, without need for multiple localized power adjustments, and fit to image voxel signals to estimate the local peak SNRs.Methods
The SNR geometry of two cryogenically cooled RF coils were assessed using gradient-recalled echo imaging (FLASH) of a 50ml phantom containing 2M 13C-Urea and 2mM DOTAREM™ (T1=860ms, T2=90ms).Imaging System:
A 7T preclinical scanner (Agilent/GE/Bruker) with two CryoProbeTM (Bruker) transmit-receive 13C RF coils, both featuring cryogenically cooling of the 20mm diameter coil elements (30K) and preamplifier (77K) with gaseous helium. One coil had a linear coil configuration (lcryo), and one quadrature with two partially-overlapping coil elements (qcryo). Both Cryocoils were used in combination with a 1H 86mm volume resonator (Bruker). In addition, a 13C/1H dual-tuned volume resonator (31mm ID, Rapid Biomedical) at room temperature was used.
MR Measurement:
Imaging parameters for the FLASH were FOV 32x32mm2, matrix 64x64, slice thickness 3mm centered axially with the coil elements, TR 4000ms, TE 4.34ms, Shinnar-Le Roux (SLR) pulse, nominal 90° tip angle, 2ms pulse duration and 4kHz pulse bandwidth, 9 repetitions each. The measurement was repeated with 21 different RF powers to compensate for the inhomogeneous excitation profiles. One image was acquired with nominal 0 RF power for noise determination.
To consider the inhomogeneous excitation profile of the surface coils, a B1 transmit/receive map was generated by performing a per-voxel fit to the signal S:
$$S(RF_{power}) = A* sin(π/p \times \sqrt(RF_{power}))$$
With A $$$\in$$$ ℂ. A 90° tip angle is reached with $$$RF_{power} = \frac{p^2}{4}$$$, and local peak signal given by |A|.
Maps of reference power were also calculated, which indicate the local RF pulse power calibration.
Signal to noise ratio:
The noise was obtained by fitting a Rayleigh distribution to the histogram of the voxels of the image acquired with nominal zero RF power and taking the standard deviation ($$$\sigma$$$) as noise [1].
The SNR for each image voxel was then calculated as:
$$ SNR = |A| / \sigma$$
Bloch Simulations:
A 2ms 4kHz SLR pulse in combination with a gradient of 14.564 kHz/cm (3mm slice thickness) with different B1-amplitudes was simulated to estimate slice excitation profiles [2].
Results
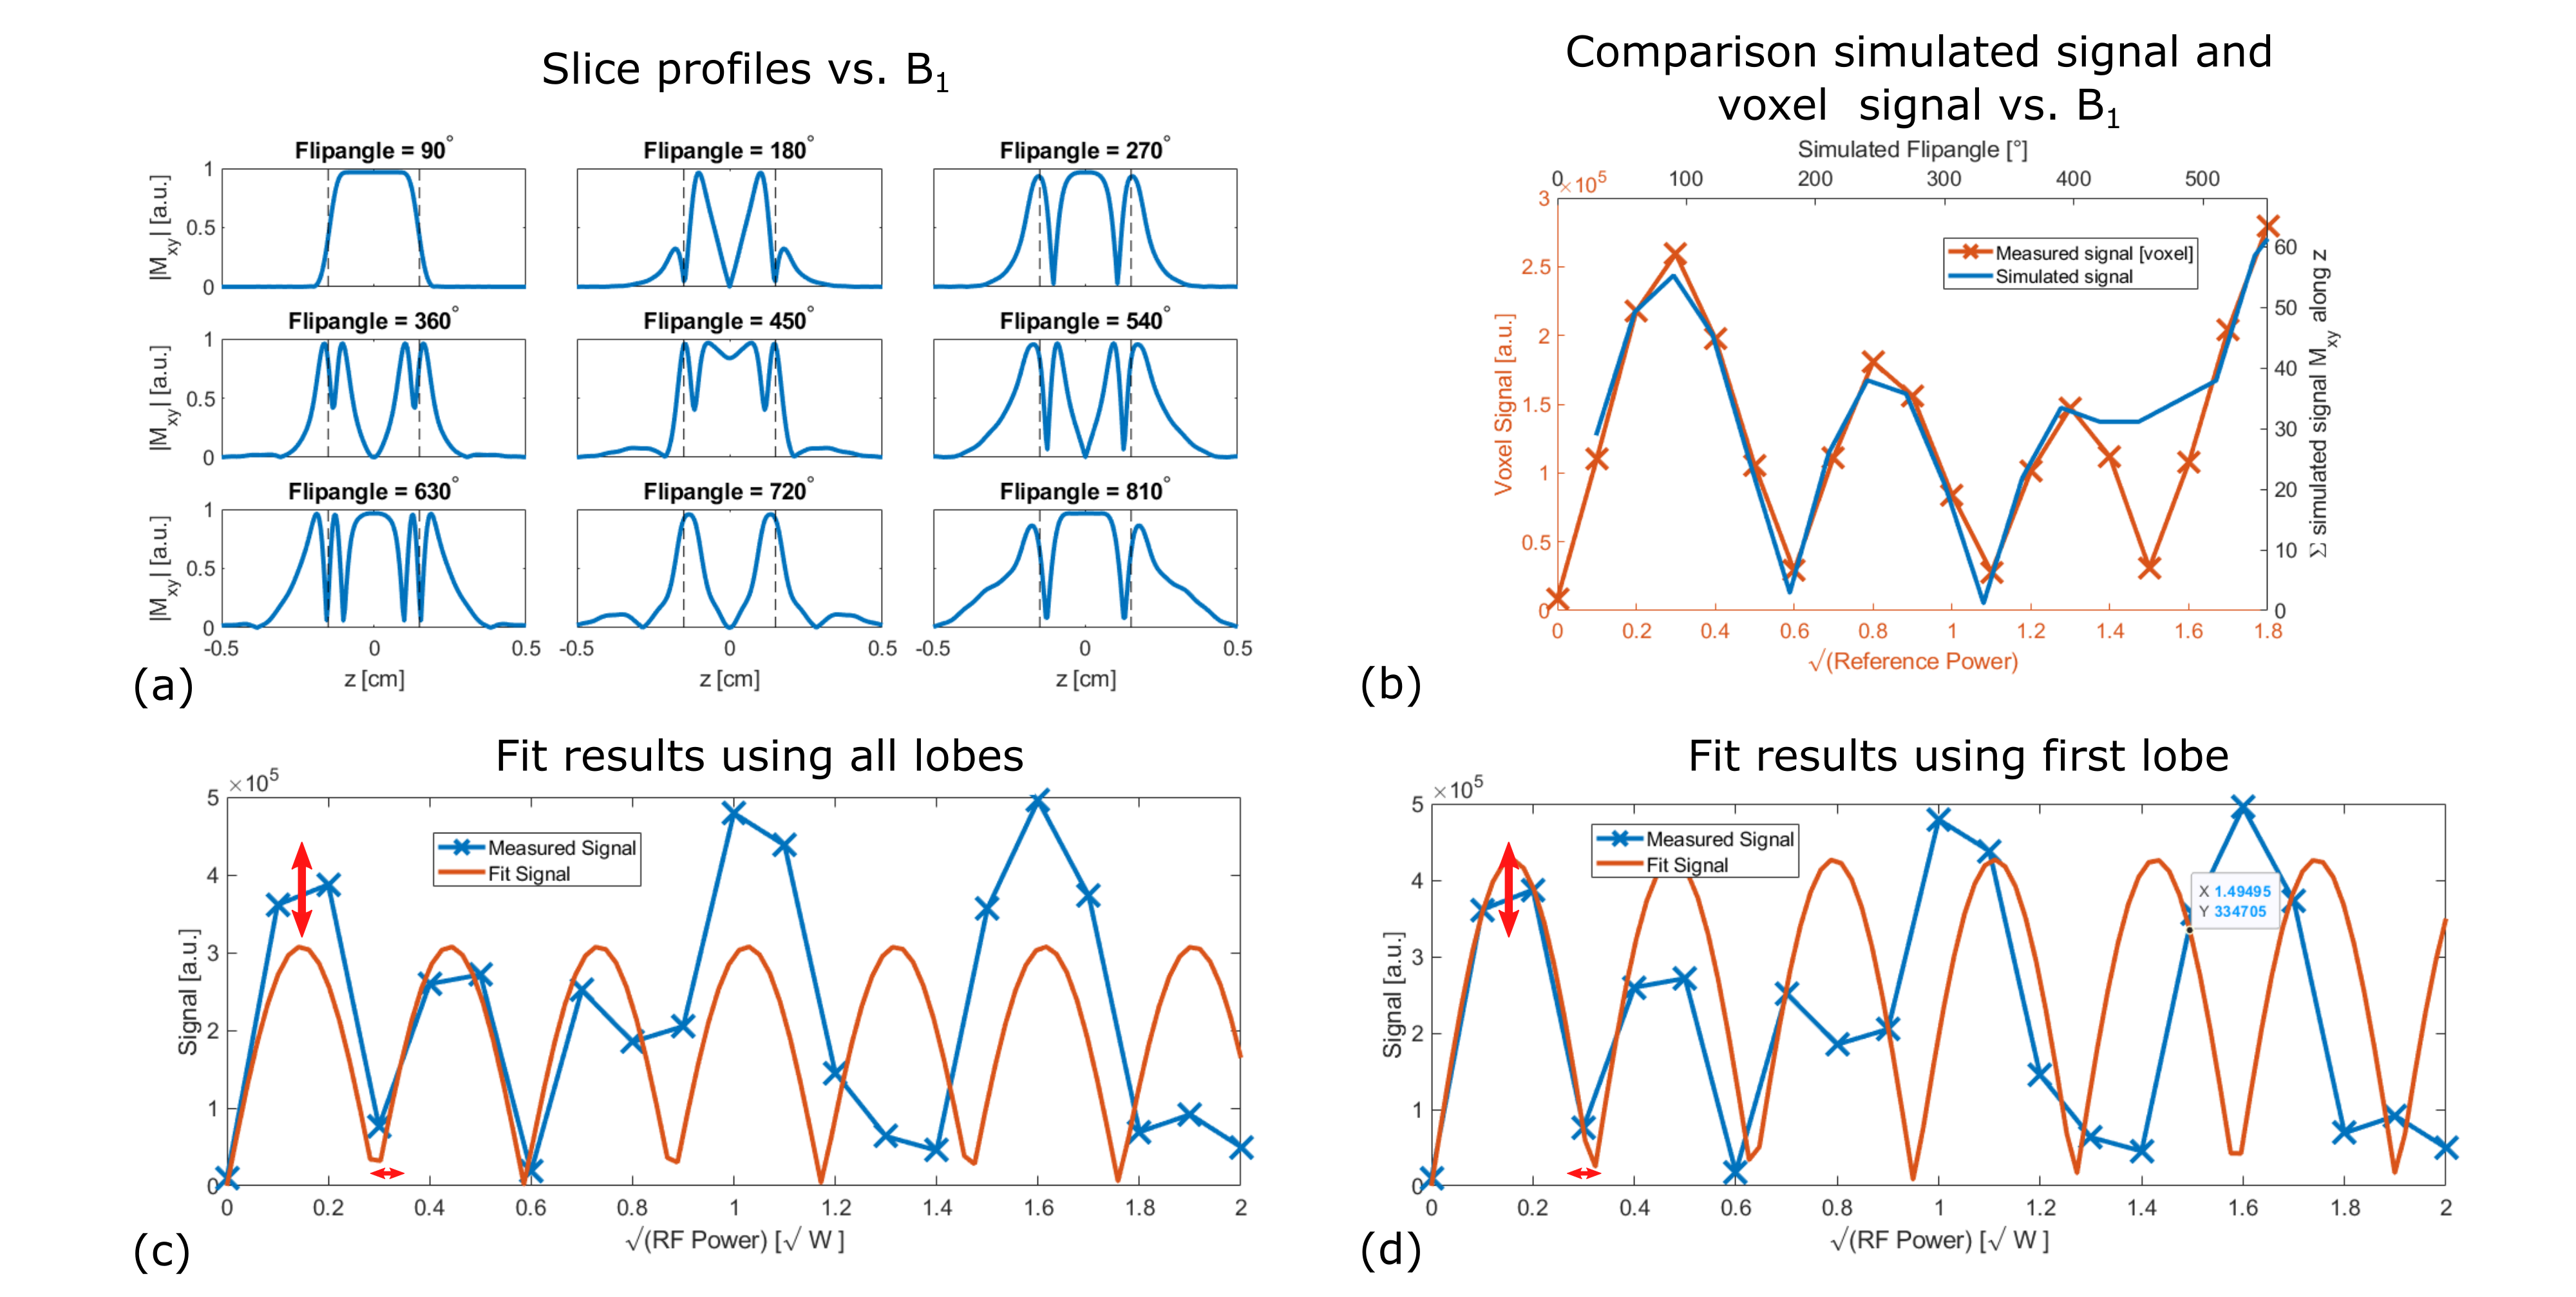
Bloch simulations:The slice profiles degrade with increasing B1. A nominal 180° tip angle only inverts the magnetization at the center of the slice (fig. 2 (a)).
B1 Mapping:
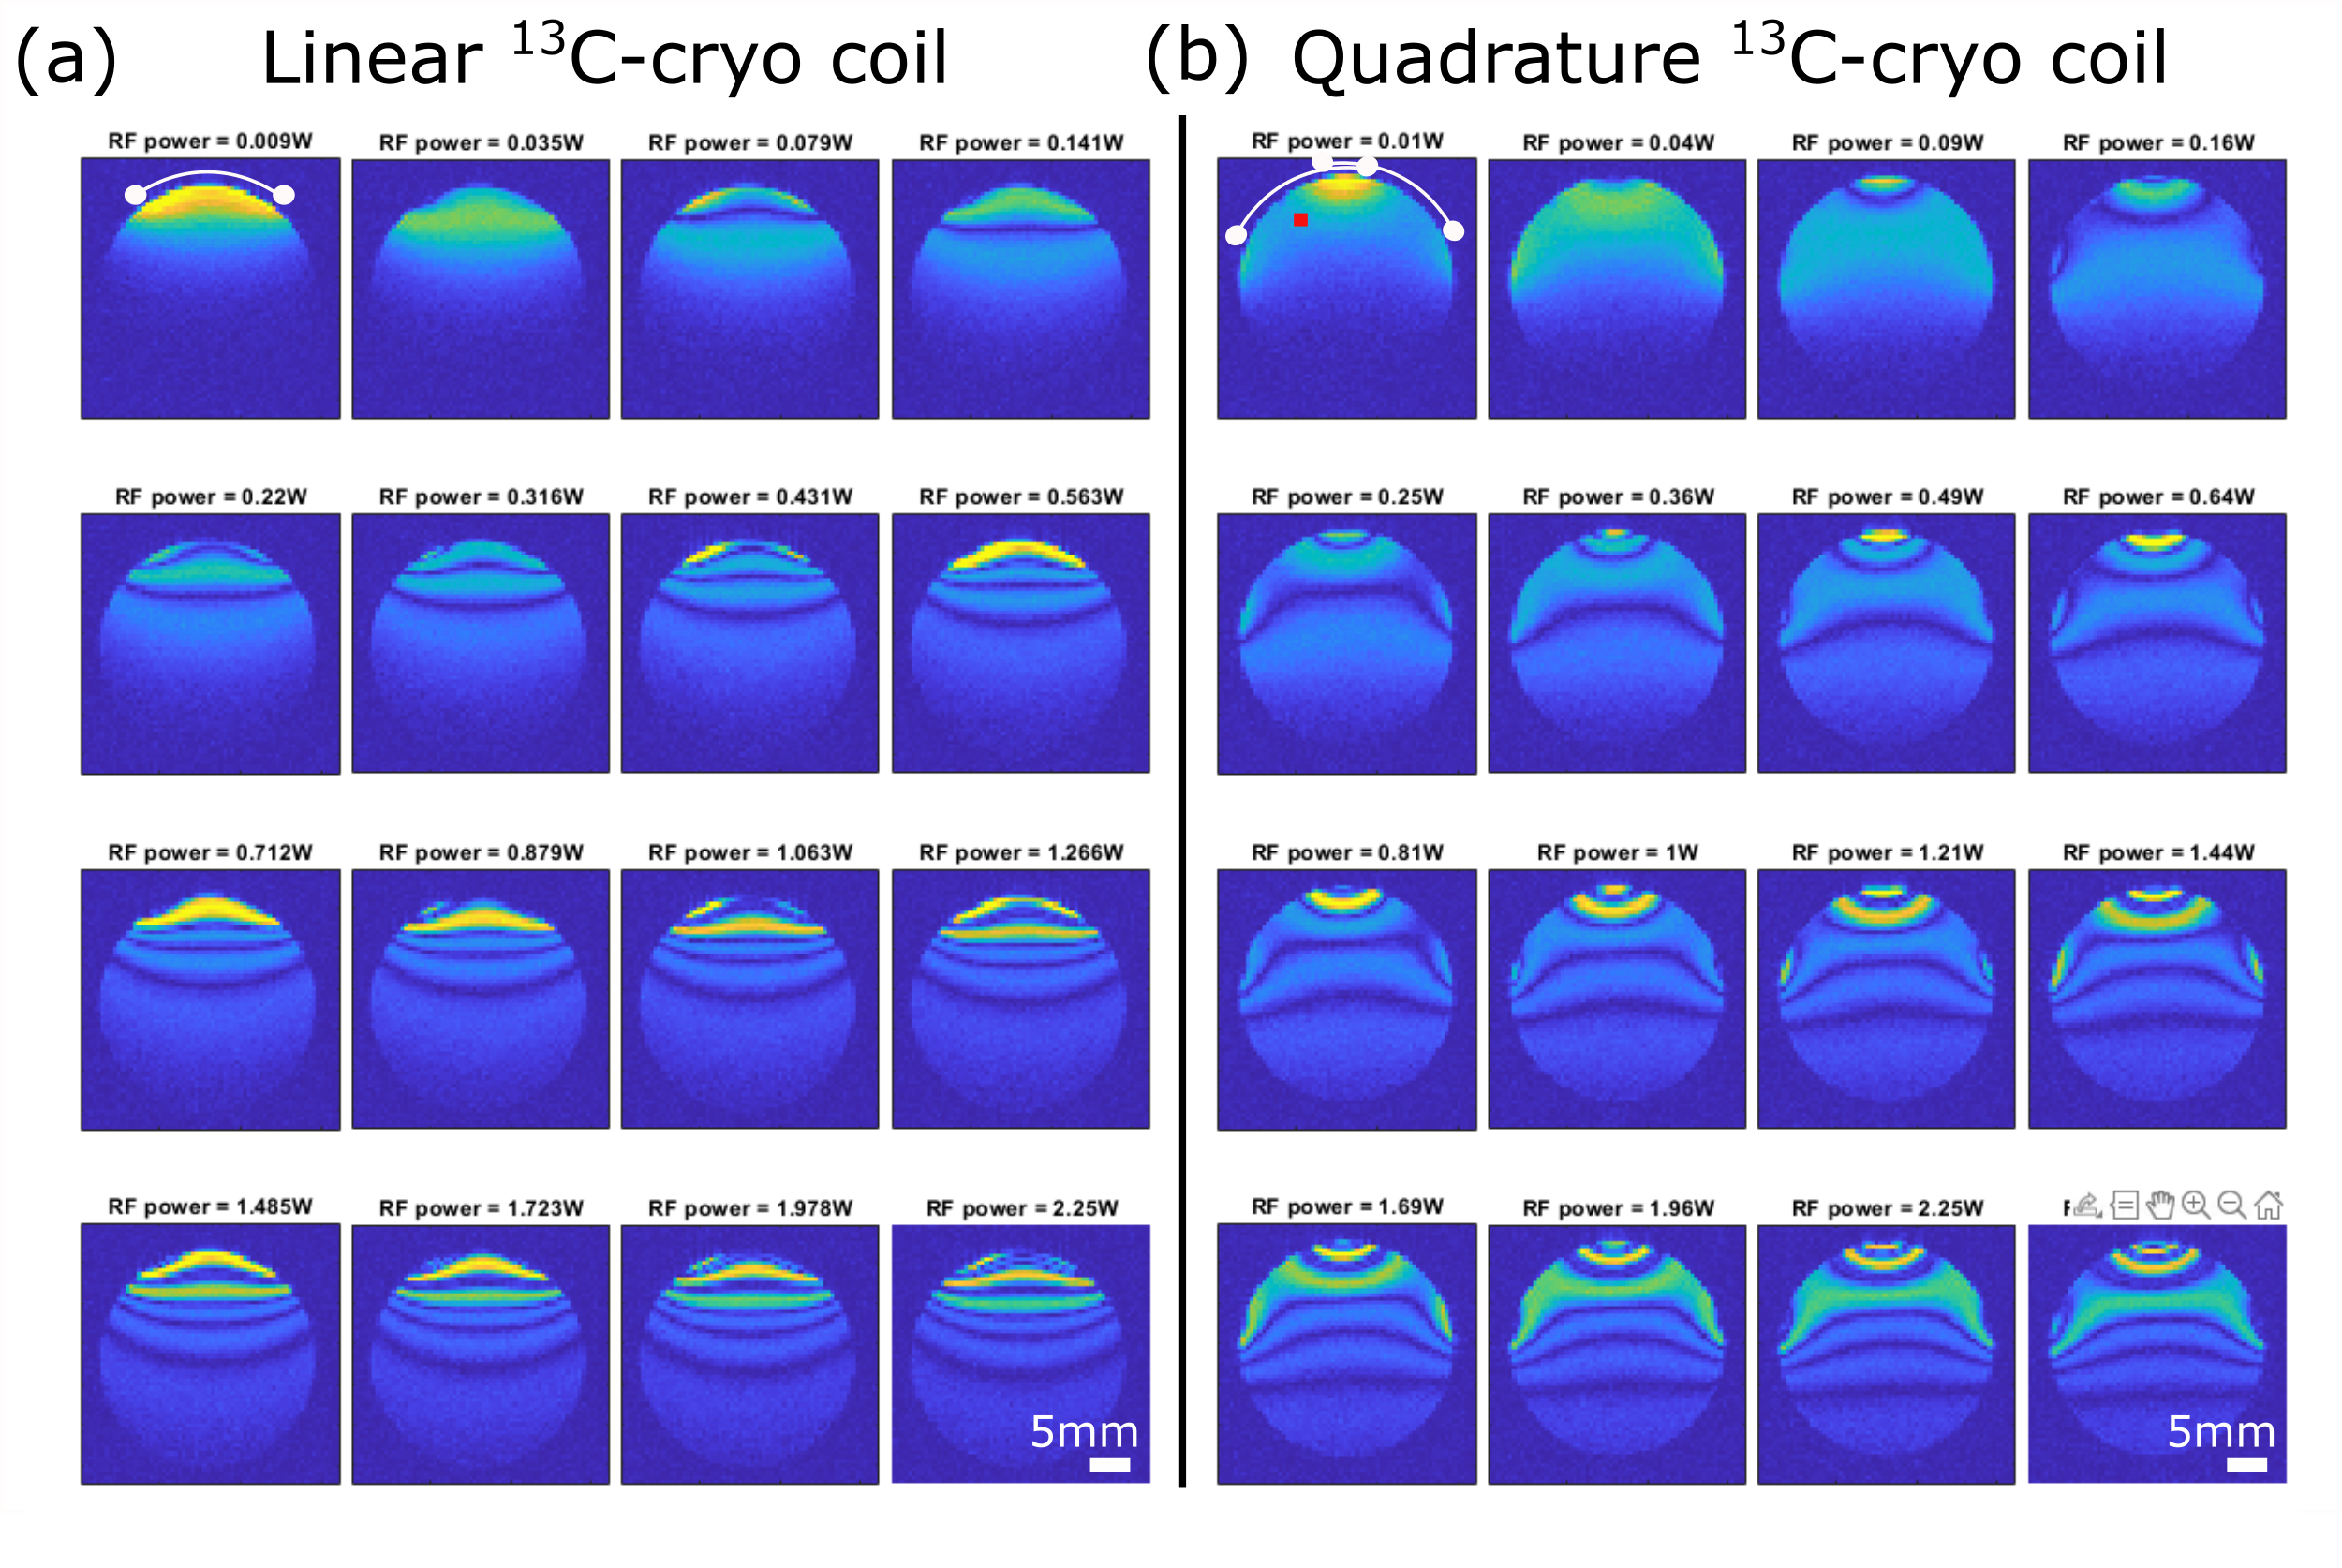
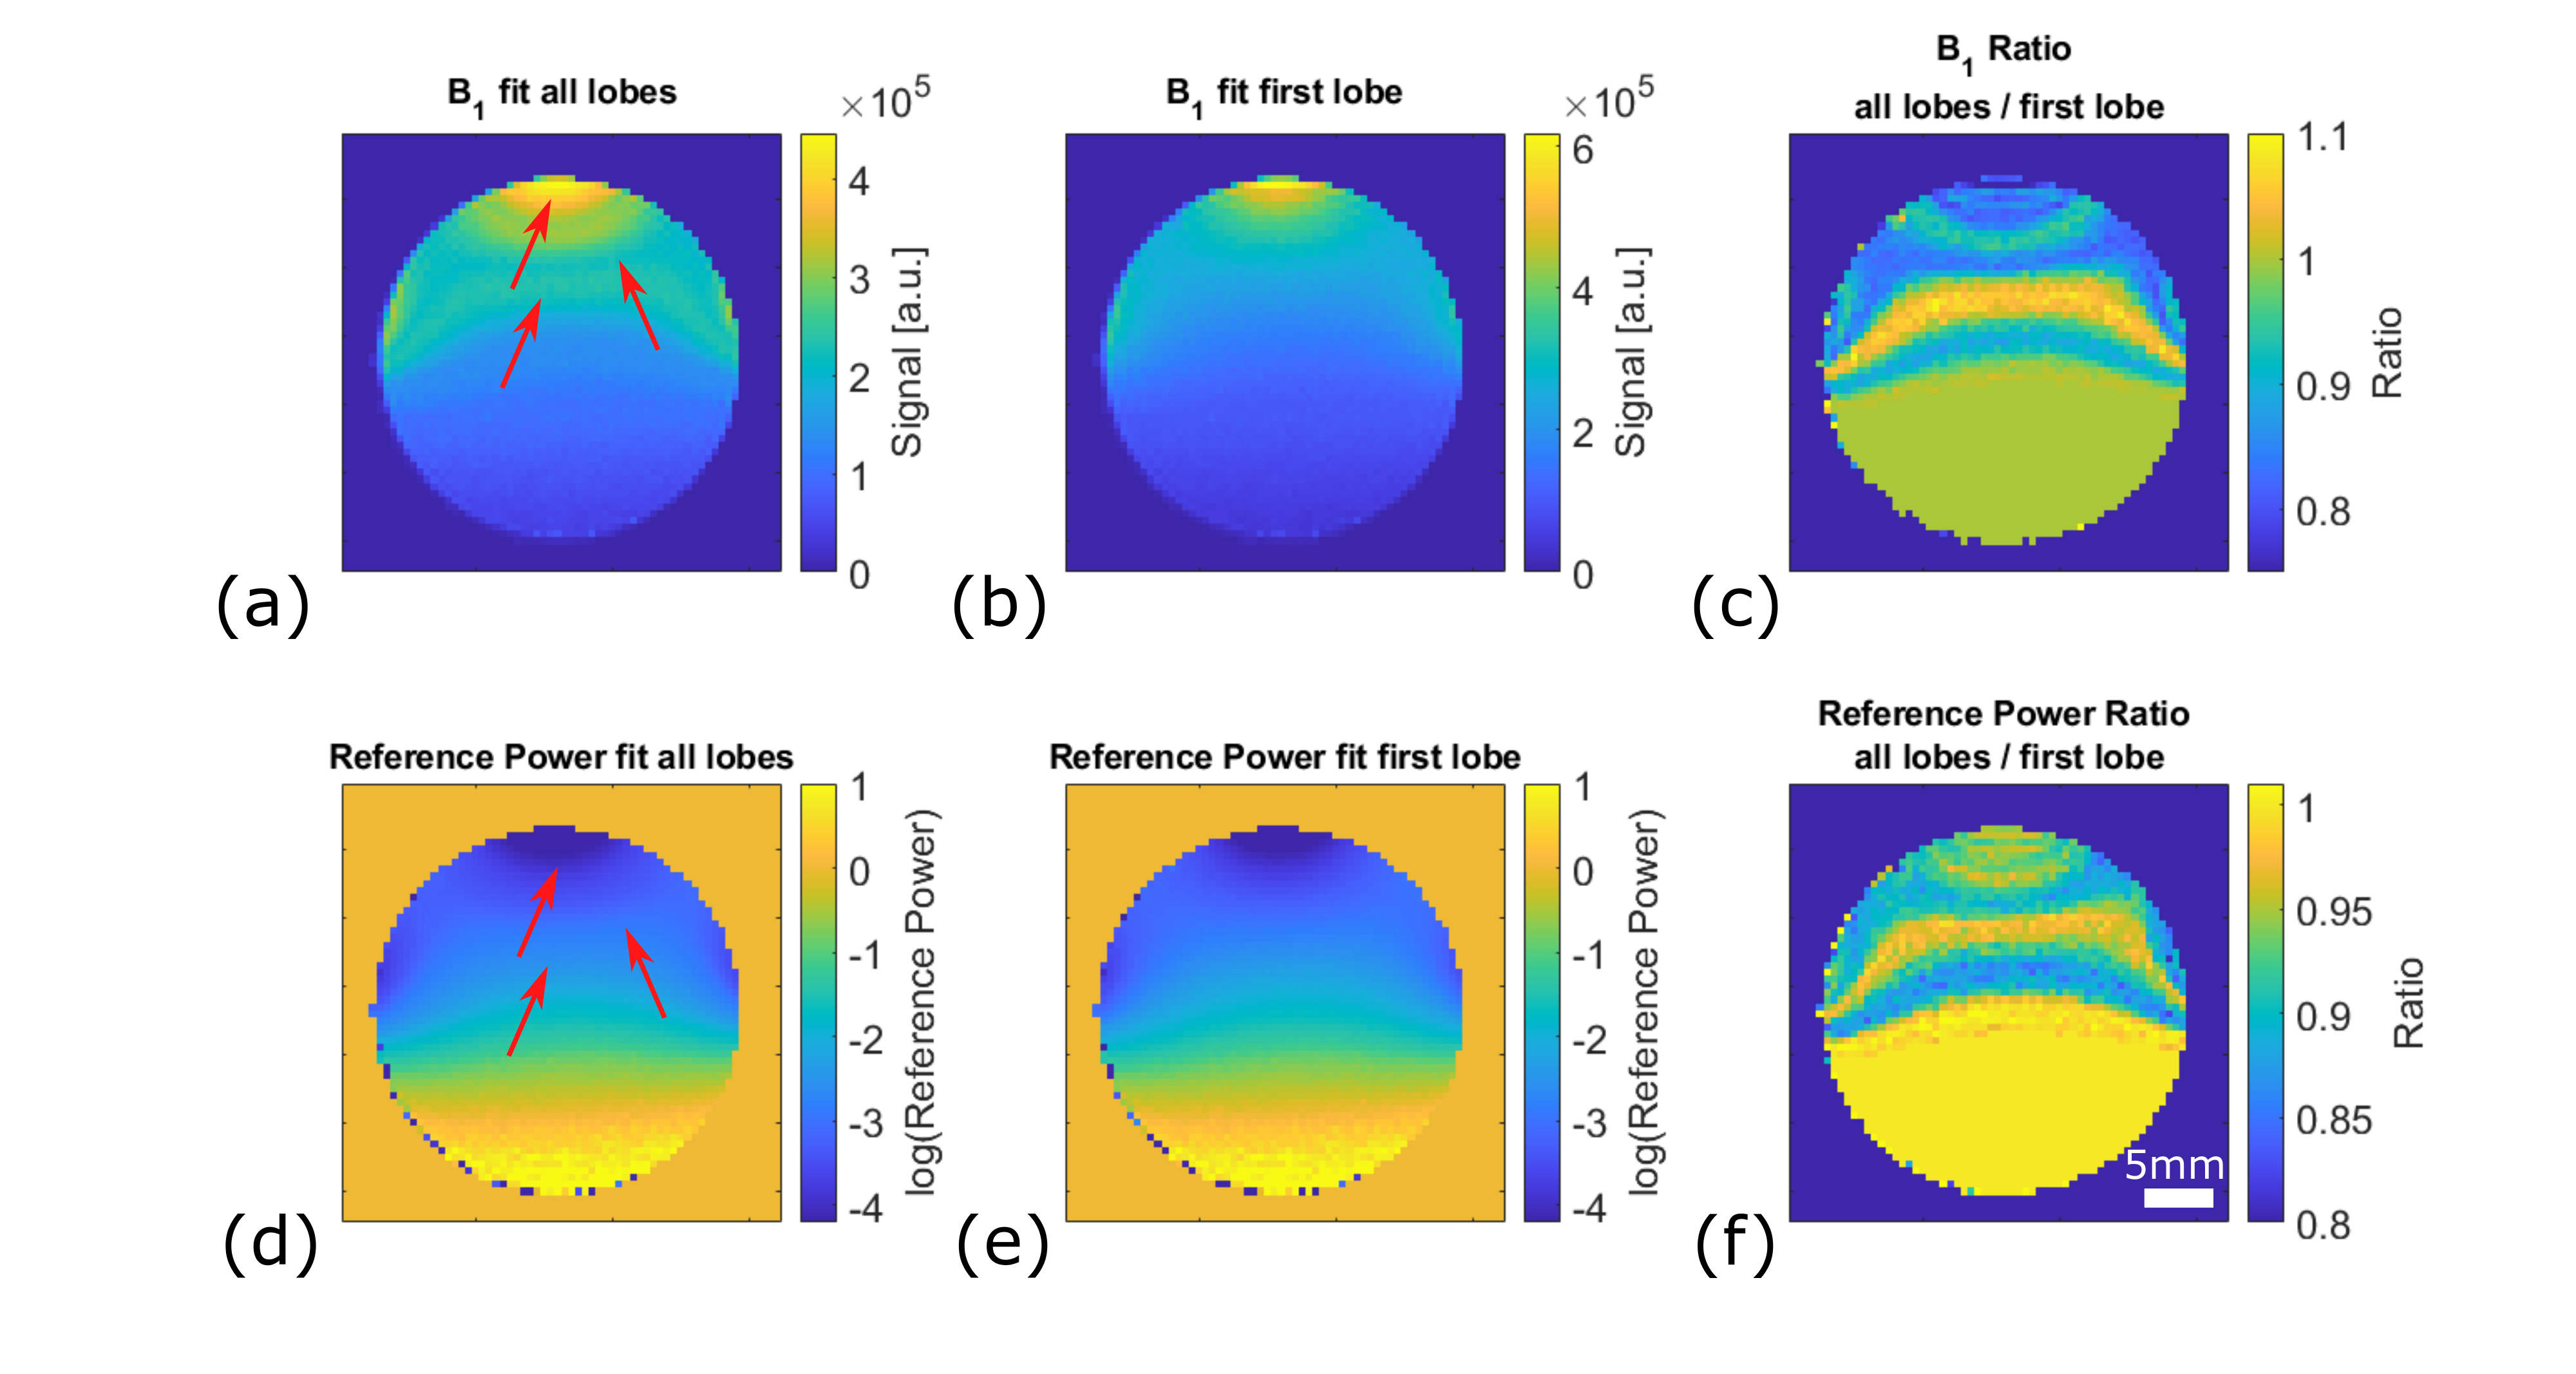
With increasing RF power, bands of excited and inverted magnetization become visible (fig. 1). Fitting a sinusoidal against the complex signal becomes inaccurate, especially for voxels close to the coil surface. This can be explained with the Bloch simulations that show a degradation of slice profile with increasing B1 (fig.2 (a,b)). Using only the signal up to the first inversion, where the assumption of a sinusoidal signal behavior is still valid, fits the signal better (fig2 c,d) and leads to smoother B1 receive maps (fig3 a,b), higher estimated receive B1 (fig3.c) as well as smoother and higher reference power maps (fig3 c-e).
Signal to noise ratio:
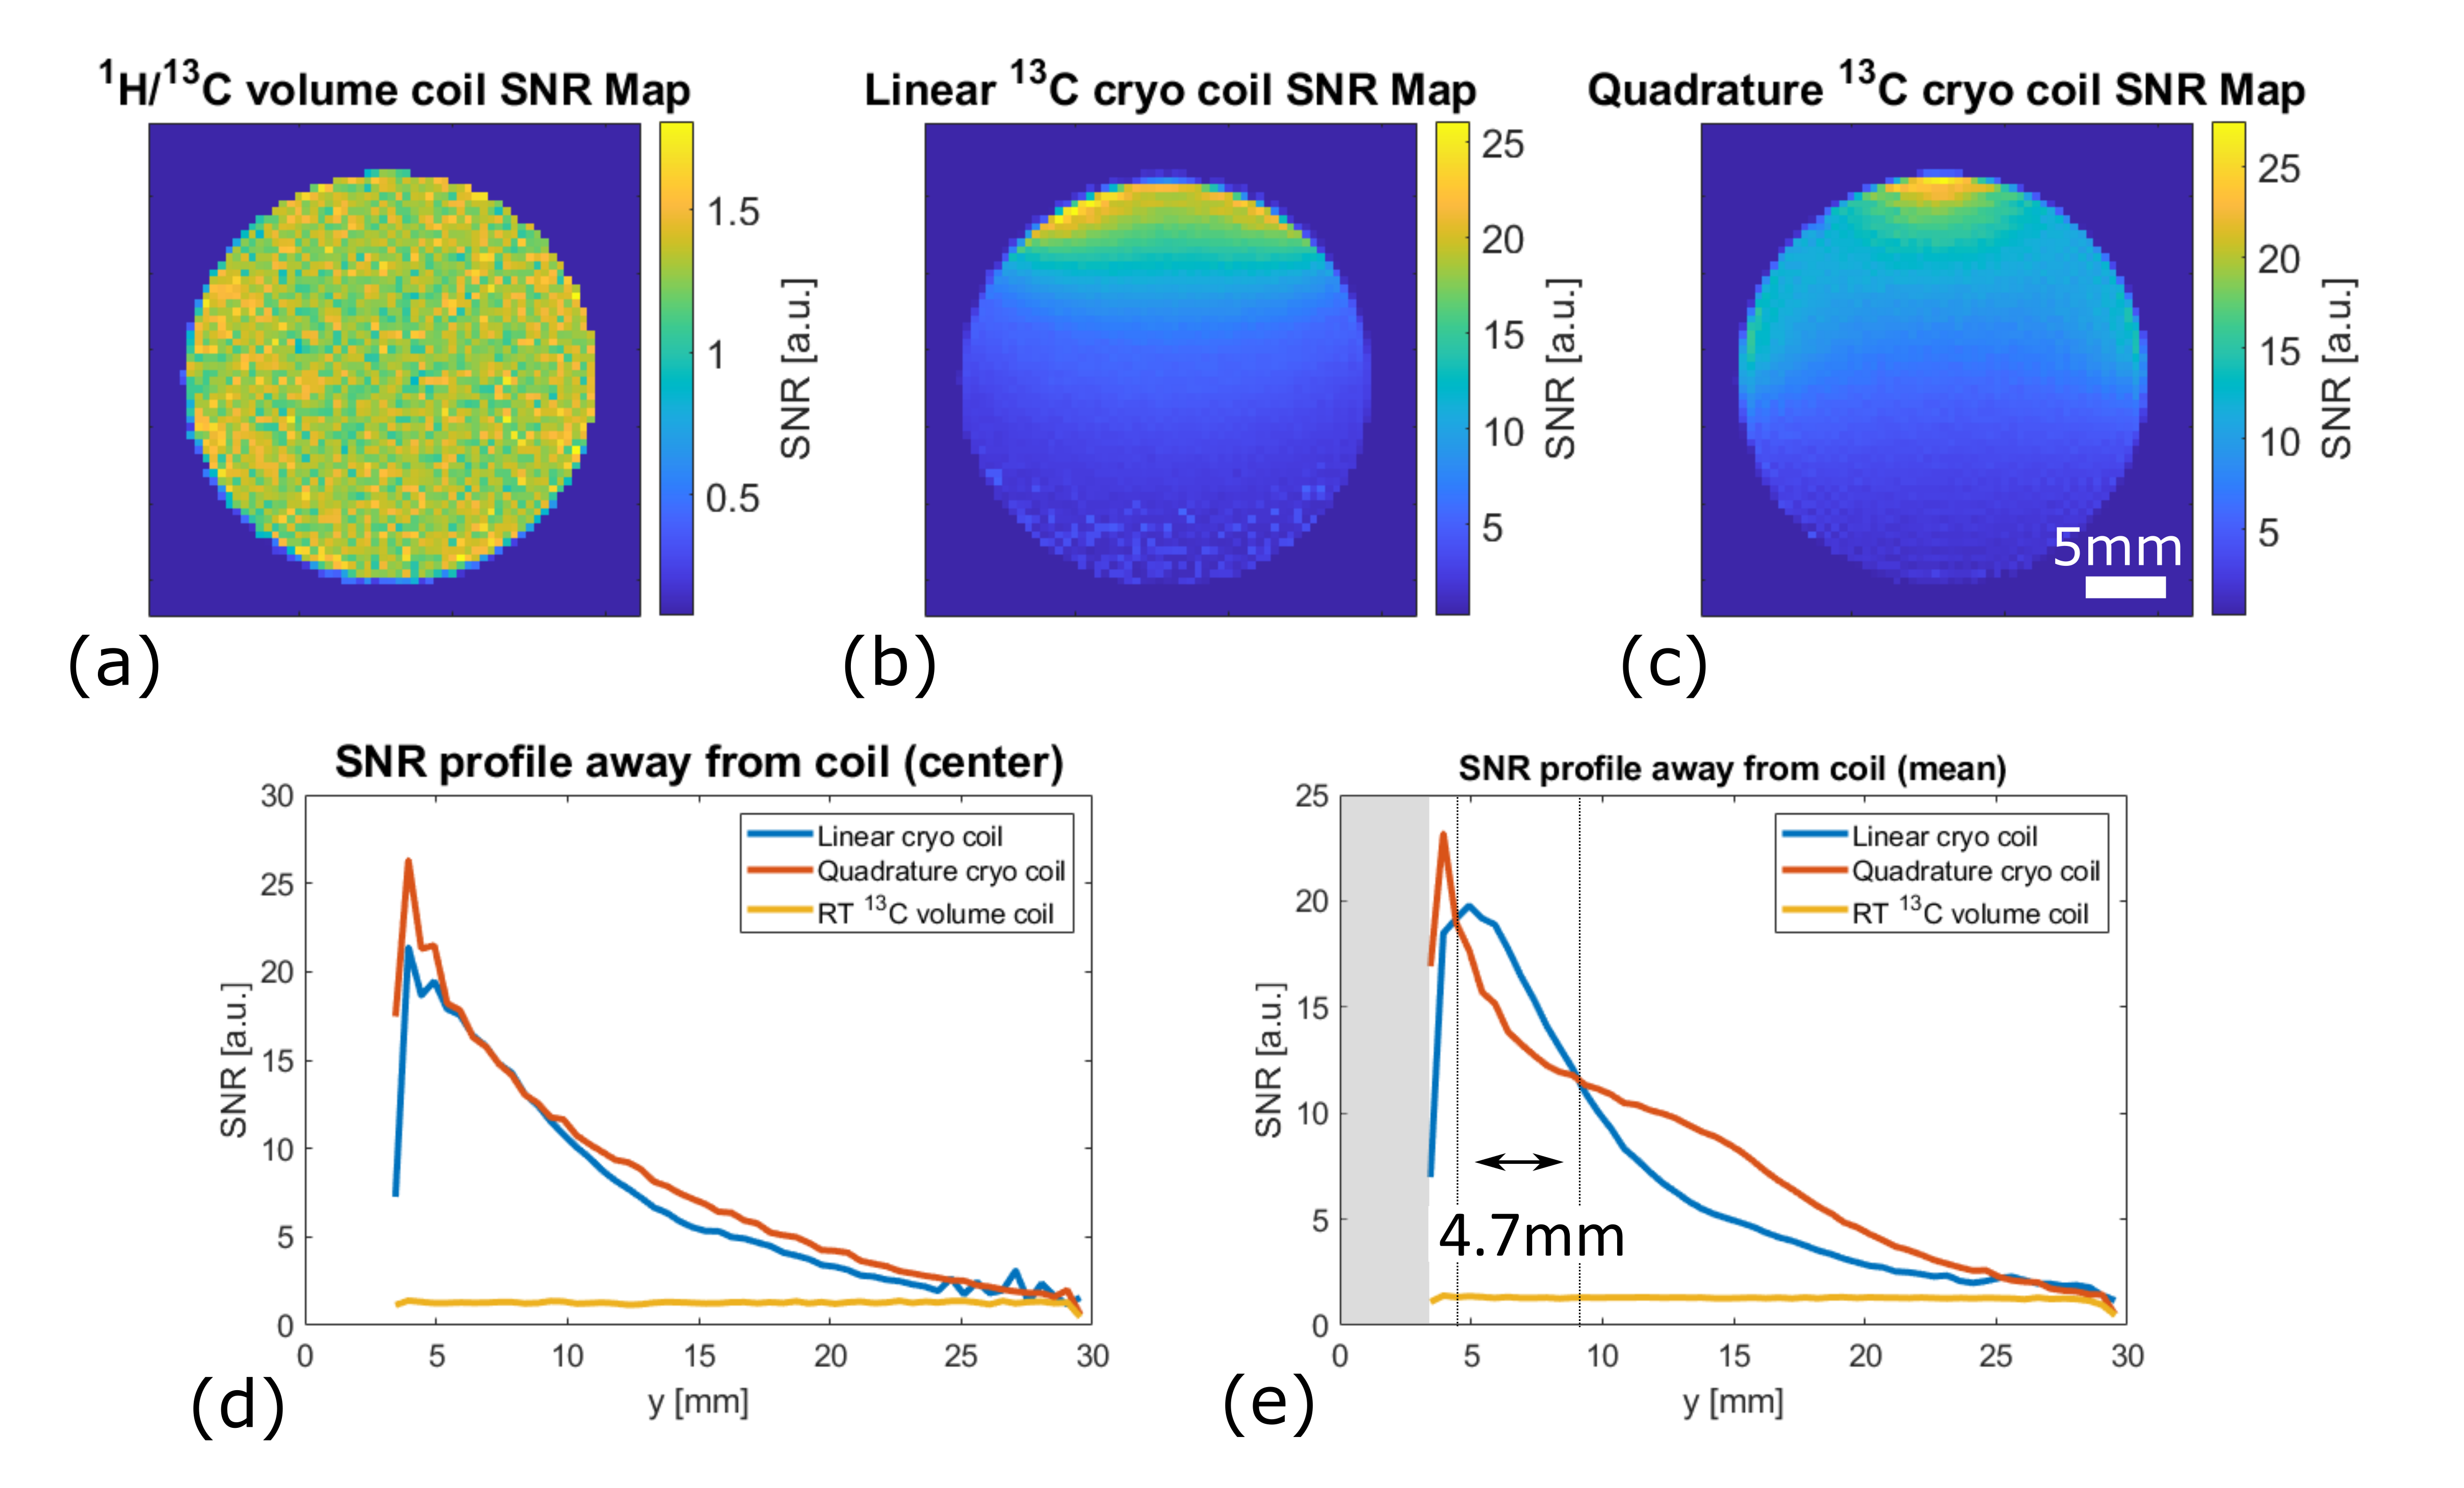
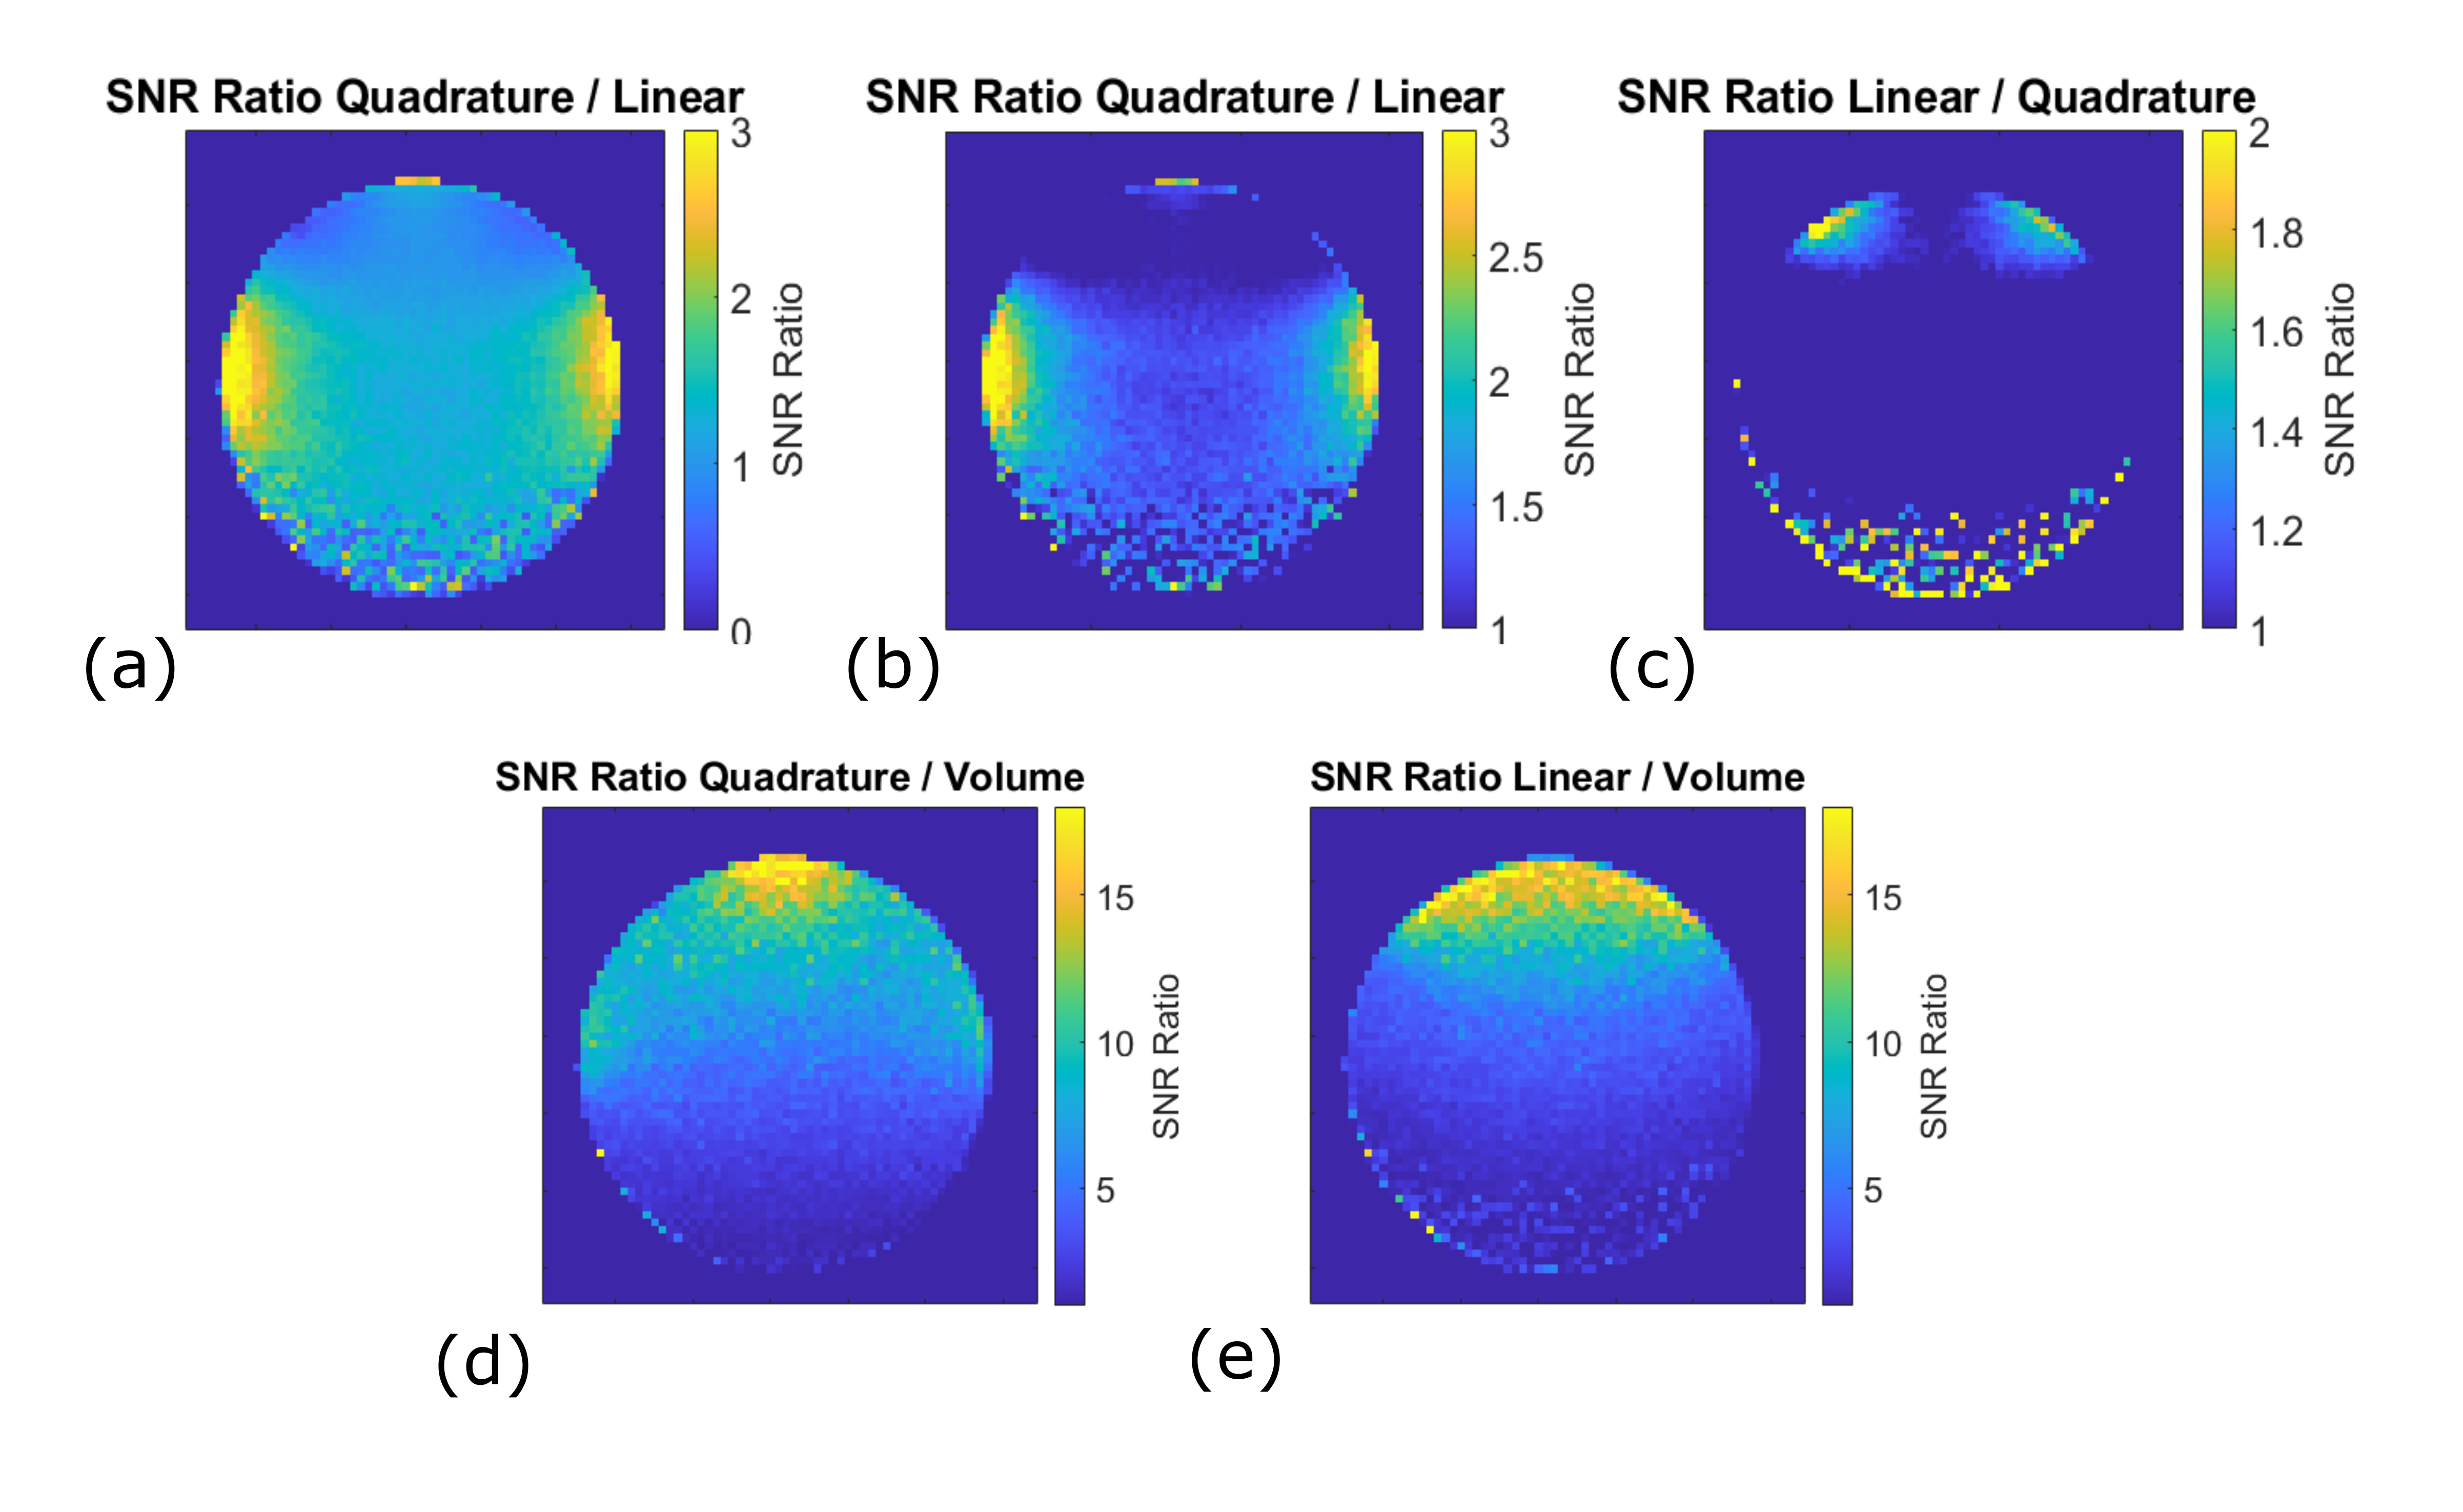
Highest SNR is measured near the overlapping coil elements (c) of the qcryo. Otherwise, the lcryo has better SNR until 4.7mm away from the coil surfaces, after which the qcryo has higher SNR. The lcryo has higher SNR (>2x) compared to the qcryo close to its coil elements. The qcryo has higher SNR (>3x) compared to the lcryo close to its non-overlapping elements and in the region more than 5 mm away from coil surface (SNR ~1.1 -2). A comparison of the SNR maps shows overall better performance of cryocoils compated to the room-temperature volume coil (fig.5).
Discussion
RF coils have highest peak SNR when the object is close to the coil elements due to near-field effects. The localized high near-coil SNR of the qcryo at the center and sides occurs due to the coil element wires, as seen in Fig. 1.Degrading slice profiles must be addressed when fitting the receive B1. Alternate solutions could include different RF pulse shapes to correct the profiles at higher tip angles, or employing 3D readout to reduce the impact of averaging across slice profiles, at the cost of increased acquisition time for additional phase encodes.
Due to its better SNR performance close-in, the lcryo could be used in subcutaneous mouse tumor models, whereas the qcryo, due to its higher penetration depth, could be more useful in abdominal organs or tumor models. With pulse sequences that benefit from homogeneous transmit B1, such as bSSFP, the volume resonator could be of advantage.
Conclusions
Both linear and quadrature cryo coils have high SNR performance compared to a room-temperature volume coil. The linear cryocoil outperforms the quadrature up to ~5mm away from the coil, while the quadrature cryocoil has higher penetration depth and higher SNR at the edges of the coil.Acknowledgements
The authors would like to thank Ralph Wißmann and Thomas Hasler for helpful discussions and Athanasia Kaïka for technical assistance. This project has received funding from the European Union’s Horizon 2020 research and innovation program under grant agreement No 820374.
References
[1] Gudbjartsson, Hákon, and Samuel Patz. "The Rician distribution of noisy MRI data." Magnetic resonance in medicine 34.6 (1995): 910-914.
[2] Hargreaves B, Bloch Equation Simulator. http://mrsrl.stanford.edu/~brian/blochsim/ Accessed November 9, 2021.
Figures